How much protein is optimal for health? In this article I’ll explain how to use a simple blood test to answer that question.
Blood urea nitrogen (BUN) is a blood test that you can get at a yearly checkup. It measures the amount of nitrogen, as contained in urea, in your blood. Independent of poor kidney function (where BUN levels are elevated because of an inability to excrete it), urea production is almost perfectly correlated (r = 0.98) to dietary protein intake (Young et al. 2000):
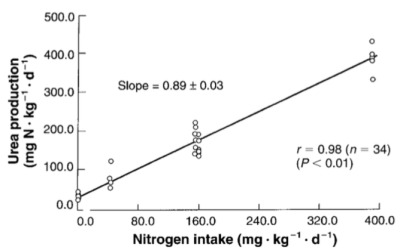
The main source of dietary nitrogen is protein, so if you eat a lot of protein, you’ll make a lot of urea. Circulating levels of urea can be easily calculated by measuring BUN, via:
Urea [mg/dL]= BUN [mg/dL] * 2.14). Therefore, measuring BUN can then be used to determine if your protein intake is too high or too low.
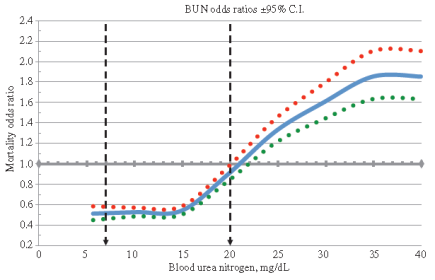
How much should BUN levels be, with the goal of optimizing health? The reference range for BUN is 5-20 mg/dL. Are BUN values of 5 equal to 20 in terms of mortality risk? What’s optimal? As shown below, BUN levels less than 15 mg/dL are associated with maximally reduced risk of death from all causes. As BUN increases above 15 mg/dL, mortality risk increases. For example, a person with a BUN of 20 would have ~50% higher mortality risk than someone with a value of 15 mg/dL:
Why would elevated circulating urea be associated with reduced health? Urea (42 mg/dL, light grey bars; 72 mg/dL, dark grey bars below) can diffuse into the gastrointestinal tract, where it’s involved in decreasing expression of the tight junction proteins, zonulin-1 (ZO-1), occludin, and claudin-1 (Vaziri et al. 2013):
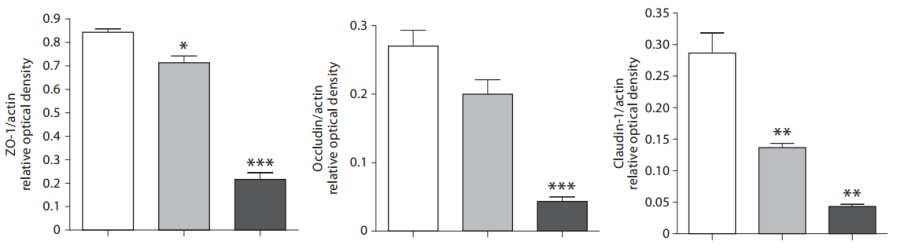
Decreased levels of ZO-1, occludin, and claudin-1 would be expected to increase gut leakiness, the process where bacteria and/or their metabolic products (i.e. lipopolysaccharide; LPS) move from the intestine into the blood. In support of this, tight junction protein expression decreases during aging (Tran and Greenwood-Van Meerveld, 2013) in parallel with increased circulating LPS (Ghosh et al. 2015). Elevated circulating LPS increases oxidative stress, inflammation, and insulin resistance (for more details see: https://www.amazon.com/dp/B01G48A88A), three major theories of aging!
It’s important to mention that the data of Vaziri et al. (2013) showed decreased tight junction protein expression at urea concentrations of 42 and 72 mg/dL. How does that translate into BUN values? Urea concentrations of 42 and 72 mg/dL correspond to BUN values of 19.6 and 33.6 mg/dL, respectively (42/2.14, 72/2.14). Interestingly, from the all-cause mortality data, a BUN value of 20 is associated with increased risk, compared with values less than 15, and this suggests that the effect of urea on gut leakiness may be one reason why!
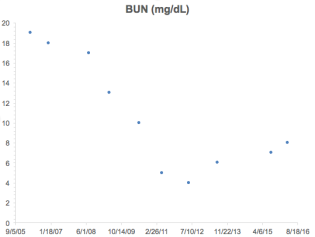
What’s my BUN? As shown below, I’ve measured BUN 10 times since 2006. At that time (and before), my diet was protein heavy, consuming 150+ grams of protein per day. This is reflected in my relatively high (greater than 15) BUN values until 2008, which is when I started to reduce my protein intake. In 2012, I tried a fruititarian diet for 1 year-the corresponding low protein intake (~40g protein/day) resulted in my lowest BUN value of 4. In 2013, I tried a vegan diet rich in whole grains for 1 year (~60g protein/day), and that small increase in protein compared with the fruititarian diet increased my BUN to 6. Since then, I’ve settled on a vegetable dominant, pesco-vegetarian dietary pattern that yields an average of ~85 grams of protein per day. Using that approach, my BUN is 8, well under the 15 threshold.
If you’re interested, please have a look at my book!
References
Ghosh S, Lertwattanarak R, Garduño Jde J, Galeana JJ, Li J, Zamarripa F, Lancaster JL, Mohan S, Hussey S, Musi N. Elevated muscle TLR4 expression and metabolic endotoxemia in human aging. J Gerontol A Biol Sci Med Sci. 2015 Feb;70(2):232-46.
Lustgarten M. Infectious Burden: The Cause Of Aging And Age-Related Disease. 2016. https://www.amazon.com/dp/B01G48A88A
Solinger AB, Rothman SI. Risks of mortality associated with common laboratory tests: a novel, simple and meaningful way to set decision limits from data available in the Electronic Medical Record. Clin Chem Lab Med. 2013 Sep;51(9):1803-13.
Tran L, Greenwood-Van Meerveld B. Age-associated remodeling of the intestinal epithelial barrier. J Gerontol A Biol Sci Med Sci. 2013 Sep;68(9):1045-56.
Vaziri ND, Yuan J, Norris K. Role of urea in intestinal barrier dysfunction and disruption of epithelial tight junction in chronic kidney disease. Am J Nephrol. 2013;37(1):1-6.
Young VR, El-Khoury AE, Raguso CA, Forslund AH, Hambraeus L. Rates of urea production and hydrolysis and leucine oxidation change linearly over widely varying protein intakes in healthy adults. J Nutr. 2000 Apr;130(4):761-6.

Benefits of Moderate to High Protein Intake over Age 66 — Warren Email 20140727
—–Original Message—–
From: Warren Taylor — Gmail [mailto:warren.taylor@gmail.com]
Sent: Sunday, July 27, 2014 3:58 PM
To: Main CR List
Subject: Benefits of Moderate to High Protein Intake over Age 66
For senior citizens age 66+, there is a 60% reduction
in cancer mortality for those with high protein diets,
compared to those with low protein diets.
For senior citizens age 66+, there is a 28% reduction
in all-cause mortality for those with high protein diets,
compared to those with low protein diets.
———————
See text, Top of page 409, left-hand-side.
Begin QUOTE:
When compared to those with low protein consumption,
subjects who consumed high amounts of protein had a
28% reduction in all-cause mortality (HR: 0.72; 95% CI: 0.55–
0.94), while subjects who consumed moderate amounts of protein
displayed a 21% reduction in all-cause mortality (HR: 0.78;
95% CI: 0.62–0.99). Furthermore, this was not affected by
percent calories from fat, from carbohydrates, or from animal
protein. Subjects with high protein consumption also had a
60% reduction in cancer mortality (HR: 0.40; 95% CI: 0.23–
0.71) compared to those with low protein diets, which was also
not affected when controlling for other nutrient intake or
protein source.
Endof QUOTE:
———————-
See text, Top of page 409, left-hand-side, and
data presented in Table 1 (page 410) for Source:
Low Protein Intake Is Associated with a Major Reduction
in IGF-1, Cancer, and Overall Mortality in the 65 and Younger
but Not Older Population.
Cell Metabolism 19, 407–417, March 4, 2014, 2014 Elsevier Inc.
———————
For the 4 models used in Table 410, these are the adjustments:
Model 1 (baseline model): Adjusted for age, sex, race/ethnicity,
education, waist circumference, smoking, chronic conditions
(diabetes, cancer, myocardial infarction), trying to lose weight
in the last year, diet changed in the last year, reported intake
representative of typical diet, and total calories.
Model 2: Adjusted for covariates and % kcals from
total fat.
Model 3: Adjusted for covariates and % kcals from
total carbohydrates.
Model 4: Adjusted for covariates and % kcals from
animal protein.
——————-
Ages 50–65 (N = 3,039)
Ages 66+ (N = 3,342)
LikeLike
Good point Warren! But the issue that I raise is still relevant-if your body is breaking down too much protein to elevate BUN>15, that’s still not good, whether you’re 65y.
LikeLike
This is Warren Taylor — and I thank you for posting my comments about
how higher protein diets are protective for cancer and all-cause-mortality
for those 66+. (It’s a lot of work to maintain a high-quality blog! Thanks!)
Following is information about Serum BUN to measure level of protein
in the human diet.
—–Original Message—–
From: Warren Taylor
Sent: Thursday, July 31, 2014 8:24 AM
To: Main CR List
Subject: Serum BUN Test Gives Dietary Protein Level (Low, Medium, High)
Regarding serum BUN testing… In a recent posting to
the CR Society Community List, I was correct in stating
that for a person in normal health and normal hydration,
the following is true:
— Low BUN levels are not common. Low BUN levels may be
seen in cases of protein malnutrition.
— Higher BUN levels may occur when there is more protein in
the diet.
Normal range of BUN = (7 to 20 mg/dL) — (2.5 to 7.1 mmol/L)
In common medical practice, serum BUN test is not normally
used to diagnose protein malnutrition. But it does indicate
whether dietary intake of protein is low or high —
but not necessarily adequate (assuming otherwise normal
health and normal hydration).
http://www.mayoclinic.org/tests-procedures/blood-urea-nitrogen/basics/results/prc-20020239
http://labtestsonline.org/understanding/analytes/bun/tab/test#what
Using Mayo Clinic normal range of 4 sigma interval = [7,20],
the values for the normal deviate (Gaussian) parameters are
sigma = (20-7)/4 = 3.25,
mean = (20 + 7)/2 = 13.50,
Using online Gaussian calculator:
http://www.mathportal.org/calculators/statistics-calculator/normal-distribution-calculator.php
here are the percentile points for different values of serum BUN:
BUN = 5.0 — 0.4% [z = ( 5.00 – 13.5)/3.25 = -2.615]
BUN = 7.0 — 2.3% [z = ( 7.00 – 13.5)/3.25 = -2.000]
BUN = 10.25 — 15.9% [z = (10.25 – 13.5)/3.25 = -1.000]
BUN = 13.50 — 50.0% [z = (13.50 – 13.5)/3.25 = 0.000]
BUN = 16.75 — 84.1% [z = (16.75 – 13.5)/3.25 = 1.000]
BUN = 20.00 — 97.7% [z = (20.00 – 13.5)/3.25 = 2.000]
BUN = 23.25 — 99.9% [z = (23.25 – 13.5)/3.25 = 3.000]
Here are values of serum BUN to target various percentile points:
BUN = 8.1 — 5%
BUN = 9.3 — 10%
BUN = 10.8 — 20%
BUN = 11.8 — 30%
BUN = 12.7 — 40%
BUN = 13.5 — 50%
BUN = 14.3 — 60%
BUN = 15.2 — 70%
BUN = 16.2 — 80%
BUN = 17.7 — 90%
BUN = 18.9 — 95%
In most cases (except for risk takers), you should
be targeting the range of the (5 to 95) percentile.
That means that your serum BUN value should be:
BUN = 7 or lower, (for extreme-low protein diets),
BUN = 8 to 9, (for non-extreme-low protein diets),
BUN = 10 to 12, (for medium-low protein diets),
BUN = 13 to 14, (for medium protein diets),
BUN = 15 to 17, (for medium-high protein diets),
BUN = 18 to 19, (for non-extreme-high protein diets),
BUN = 20 or higher, (for extreme-high protein diets),
Example 1: Michael Lustgarten, vegan advocate, reports
a BUN = 6.0. According to the calculations above,
Michael follows an extreme-low protein diet.
https://michaellustgarten.wordpress.com/2014/07/23/quantified-self-protein-intake-and-bun/
Example 2: Warren Taylor, a CR Society member, reports
a BUN of 18.0. According to the calculations above,
Warren follows a non-extreme-high protein diet.
LikeLike
Warren I’m not a “vegan advocate”. I’m a vegetarian, based on the extensive literature about it reducing mortality risk relative to meat eaters. I do eat meat, but very rarely, like 1x/year.
LikeLike
I too once followed a largely vegetarian (and sometimes vegan) diet in my younger days, for which the medical literature does indicate reduced mortality for younger people. But, for young people, their total mortality is very low. (!!!) So it doesn’t make much difference, following a vegetarian diet or not —- since the total mortality is very low at young ages —- regardless of dietary style. Only 15% of the population dies before age 66 (!!!). And many of these deaths have nothing to do with diet at all.
But for older people age 66+ (85% of the population who haven’t died yet), their total mortality is high, as they approach death. For this older group which is very large set of survivors compared to those who have already died younger, the medical literature (for the medical journal article I quoted) shows that the highest protein eaters have a reduced cancer rate 60% lower than the lowest protein eaters, plus they have a reduced all-cause-mortality rate 28% lower than the lowest-protein eaters.
So I will take the 85% who survived to age 66+ — since that includes ME right now. And I will include myself in the highest protein group also — to get the 60% reduced cancer rate, and the 28% reduced all-cause-mortality rate — relative to the lowest protein group.
So basically I am saying, a low protein vegetarian diet makes VERY LITTLE difference due to the low mortality in young people, and for the very few who die young (15%) — and often not from dietary causes. But the high protein diet makes a VERY BIG difference for both reducing cancer and all-cause-mortality, for the vastly great number of people who didn’t die young (85%).
So a vegetarian diet in the young hardly makes a hoot-of-difference-at-all, since so few die before age 66+ (15%), and seldom due to dietary causes. But the higher protein diet makes all-the-difference-in-the-world, for the very many who lived to age 66+ (85%), who often die of cancer — and who for sure, will die due to all-cause-mortality!
LikeLike
I don’t know why you don’t understand my post. The graph that I cited is very clear, increased mortality risk above BUN values of 15.
LikeLike
I agree. The chart does show a linearly increasing mortality risk that goes from 0.5 to 1.0 up to BUN = 21. And the chart also shows virtually no mortality risk reduction at all, for BUN values less than 15.
LikeLike
Need to look at it closely in our cohort
LikeLike