Yearly Archives: 2014

Grapes vs. Raisins: A Nutritional Analysis

If your goal is optimal nutrition, would you choose grapes or raisins? To most, the obvious answer would be grapes, because they’re less calorie dense than raisins. Grapes contain 20 calories per ounce, whereas raisins contain 85 calories/ounce. But, what if I asked the same question, and you had 100 calories to spend on either grapes or raisins? Although they’re the same fruit-raisins are dehydrated grapes-is there a difference in nutrition, when normalized to calories?

Before delving into the nutritional comparison it is important to briefly discuss what happens during the dehydration process. The grape obtains energy through photosynthesis occurring in the green stem. Once the grape is removed from its stem, it still has an energy requirement that needs to be met. Since the stem is no longer providing this energy, the grape begins to use its own chemical processes to maintain energy demand. At the core of the difference between the raisin and the grape is that once the grape leaves the stem, it starts to break down its own energy stores (ATP) to maintain the cellular energy demand, a process that consumes water.

Are there nutritional differences between the grapes and raisins?

grapes raisins

In the table we see that when normalized to 100 calories, there isn’t a difference in protein, fat or carbohydrate, when comparing grapes and raisins.

grapes raisins2

Among the minerals, Copper content is reduced by more than 40% in raisins when compared with grapes. Copper is a cofactor for the antioxidant enzyme, Copper-Zinc Superoxide Dismutase. That its content reduced in raisins indicates a diminished antioxidant response.

grapes raisins3

Antioxidant depletion in raisins is also evident when looking at the vitamin list. Vitamin C (95% reduced), β-Carotene (100%), Vitamin A (100%), Leutein + Zeaxanthin (100%), Vitamin E: α-Tocopherol (86%), and Vitamin E: γ-Tocopherol (90%) are all dramatically reduced in raisins, when compared with grapes. That raisins are depleted in antioxidants, when compared with grapes is confirmed by looking at their respective ORAC (Oxygen Radical Absorbance Capacity) values: 261 for grapes vs. 113 for raisins.

The B-vitamins riboflavin (59%), pantothenate (56%), and Vitamin B6 (54%), each of which are required for efficient energy metabolism are reduced in raisins.

Finally, both Vitamin K (94%) and choline (neurotransmitter, 54%) are also reduced in raisins, when compared with grapes.

So, if your interest is optimal nutrition, eat grapes, not raisins!

If you’re interested, please have a look at my book! 


References

Reference values for raisins and grapes obtained from http://www.nal.usda.gov/fnic/foodcomp/search/

ORAC values for raisins and grapes obtained from w ww.ars.usda.gov/SP2UserFiles/Place/…/Data/ORAC/ORAC_R2.pdf

Acrylamide is in Chocolate!

The media often tells us that dark chocolate is “healthier” than milk chocolate because of its high antioxidant content. Yes, this is true: dark chocolate contains more than four times the amount of antioxidants than milk chocolate (~200 Units/gram vs. ~45 Units/gram; Miller et al. 2006):

choco aos

However, as shown below, what they neglect to tell us is that cocoa powder beats both dark and milk chocolate, with ~800 antioxidant Units/gram! That translates into 4-fold more antioxidants than dark chocolate, and approximately 18-fold more antioxidants than milk chocolate! So, make your own chocolate at home, with cocoa powder, right?

Maybe not. To make cocoa powder, cacao beans are first roasted at a high temperature. Roasted cocoa beans are processed to remove its cocoa butter, leaving behind the cocoa solids which are then ground, forming cocoa powder. One could argue that the remaining cocoa powder, when used in chocolate is better for health than using raw (non-roasted), ground cacao beans because cocoa powder has less saturated and total fat. Although this is true, roasting the cocoa bean (or any grain, nut, or seed) produces acrylamide, a compound that has been shown to be both neurotoxic and carcinogenic (Burek et al. 1980; Johnson et al. 1986; Friedman et al. 1995). Raw cacao beans, because they have not been roasted, do not contain acrylamide.

How much acrylamide is in a Hershey’s dark chocolate bar? One 43 gram bar contains approximately 30 grams of cocoa powder (70% cocoa solids). Hershey’s cocoa powder contains 909 µg/kg of acrylamide, and when multiplied by 0.03 kg (30 grams), this yields 27.3 µg total acrylamide. The lowest risk for dietary acrylamide-induced toxicity has been recommended to be less than 1.5µg/kg body weight/day (Shipp et al. 2006). This value translates into 75 µg/day for a 50 kg woman, or 112.5 µg/day for a 75 kg man. So, if you eat one Hershey’s dark chocolate bar, you will have ingested a significant amount towards the 75 or 112.5 µg/day upper limit. It’s important to note that there is indeed difference in acrylamide content when comparing Hershey’s and Ghiradelli cocoa powder: Hershey’s contains 3-fold more acrylamide than Ghiradelli (909 µg/kg vs. 316 µg/kg). Therefore, to minimize acrylamide-related risk, if you’re making your own chocolate at home the best thing to do would be to grind your own raw cacao beans, as I do (https://michaellustgarten.wordpress.com/2014/09/21/homemade-chocolate-in-2-minutes/).

Another food that is thought of as “healthy” are baked potato chips, but they’re not healthy in terms of acrylamide content! Baked! Lay’s Original Naturally Baked Potato Crisps have 31 µg of acrylamide per 1 ounce bag. Listed below are other notable sources of dietary acrylamide, including one unhealthy (Pringles), and others commonly thought to be “healthy”.

1 oz. (16 crisps), Pringles Sweet Mesquite BBQ Flavored Potato Crisps: 70 µg of acrylamide

1 oz. (6 crackers), Health Valley Original Oat Bran Graham Crackers: 43 µg of acrylamide

1 serving (2 oz.), Nature’s Path Organic Optimum Power Breakfast, Flax, Soy, Blueberry: 22 µg of acrylamide

1 oz., Blue Diamond Roasted Salted Almonds: 6.7 µg of acrylamide

2 slices, Arnold Bakery Light 100% Whole Wheat Bread: 5.7 µg of acrylamide

If you’re interested, please have a look at my book!

References:

Acrylamide list: http://www.fda.gov/food/foodborneillnesscontaminants/chemicalcontaminants/ucm053549.htm

Burek JD, Albee RR, Beyer JE, Bell TJ, Carreon RM, Morden DC, Wade CE, Hermann EA, Gorzinski SJ, 1980. Subchronic toxicity of acrylamide administered to rats in the drinking water followed by up to 144 days of recovery. J. Environ. Pathol. Toxicol. 4,157-182.

Friedman MA, Dulak LH, Stedham MA, 1995. A lifetime oncogenicity study in rats with acrylamide. Fundam. Appl. Toxicol. 27, 95-105.

Johnson KA, Gorzinski SJ, Bodner KM, Campbell RA, Wolf CH, Friedman MA, Mast RW, 1986. Chronic toxicity and oncogenicity study on acrylamide incorporated in the drinking water of Fischer 344 rats. Toxicol. Appl. Pharmacol. 85, 154-168.

Miller KB, Stuart DA, Smith NL, Lee CY, McHale NL, Flanagan JA, Ou B, Hurst WJ, 2006. Antioxidant activity and polyphenol and procyanidin contents of selected commercially available cocoa-containing and chocolate products in the United States. J Agric Food Chem. 31;54(11), 4062-8.

Shipp A, Lawrence G, Gentry R, McDonald T, Bartow H, Bounds J, Macdonald N, Clewell H, Allen B, Van Landingham C, 2006. Acrylamide: review of toxicity data and dose-response analyses for cancer and noncancer effects. Crit. Rev. Toxicol. 36, 481-608.

High Fructose Corn Syrup, Fruit and Health: A Perspective

Consumption of high fructose corn syrup (HFCS) has been linked to a variety of adverse health conditions, including non-alcoholic fatty liver disease, type II diabetes, increased blood pressure, dislipidemia (i.e. decreased good cholesterol, HDL), and obesity (Nseir et al. 2010).

So, consumption HFCS is not good for health. But, I’d like to add a bit of perspective: the main sugar found in fruit is fructose! Is it possible to suffer from the same adverse metabolic effects by eating too much fruit? How much fruit would one have to consume to reach the levels of fructose found in soda?

One 20 oz. soda contains 240 calories and 65 g sugar. All of this sugar comes from HFCS, which is 55% fructose. To determine the amount of fructose in soda, we multiply 65 grams by 0.55, to obtain 35.75 grams of fructose.

How much fructose is contained within fruit? When normalized to the same amount of calories as a 20 oz. soda, bananas contain 16.4 g of fructose; strawberries, 20.1 g; cherries, 20.8 g; blueberries, 21.2 g; oranges (navels), 21.6 g; peaches, 24.0 g; raisins, 24.0 g; pears 27.4 g; grapes, 28.6 g; apples, 32.0 g. So, we see that most fruits, with the exception of apples contain about 10 grams less fructose than that found in a 20 oz. soda.

If you’re worried about the adverse metabolic effects from eating too much fructose, I suggest, upon your next visit to the doctor to pay close attention to your blood test results. If your triglycerides are higher than 60 mg/dL, if your HDL is low (~40 µM), and if you have liver enzyme (ALT and AST) readings higher than 20 U/L, cutting down fructose containing foods would be a good idea.

If you’re interested, please have a look at my book!

References:

Fructose values determined via http://www.nal.usda.gov/fnic/foodcomp/search/

Nseir W, Nassar F, Assy N. Soft drinks consumption and nonalcoholic fatty liver disease. World J Gastroenterol. 2010 Jun 7;16(21):2579-88.

Raw Vegan vs. Vegan: Which Diet is Best for Optimal for Health?

In a previous article I wrote about how vegans have been shown to have decreased risk of heart disease, cancer, and all-cause mortality. In addition, in 3 separate articles I’ve written about how cooking food at high temperature (above boiling, 212ºF), whether it is roasting, baking, frying or grilling produces molecules that have been shown to shorten lifespan (AGE products), and, that cause cancer in rodents (both acrylamide and furan). Collectively these data indicate that a vegan diet without cooking any of the food at high temperature is optimal for health. However, within the confines of a vegan diet, which is best for health, raw, or raw plus boiled? In this article, I will discuss why a purely raw food diet is not optimal for health.

In short, the reason is because of fructose. Fructose isn’t only found in HFCS, it’s also the main sugar found in fruit. Raw food diets consist of nuts, seeds, fruit and vegetables. However, on a 80-10-10 diet, in which nuts are rarely used, almost all of the calories will come from fruit. For example, bananas contain 27% fructose (http://ndb.nal.usda.gov/ndb/foods/list). In other words, if you eat nothing but bananas in a single day, this would be equivalent to a 27% fructose diet. And, on the fructose scale, bananas are relatively low in fructose. For example, strawberries, cherries, blueberries, oranges, peaches, pears, grapes, watermelon and apples contain 34%, 35%, 35%, 36%, 40%, 46%, 48%, 53%, 53% fructose, respectively. If you ate nothing but watermelon all day you would be on a 46% fructose diet. So, are there any adverse health effects of this amount of dietary fructose?

The answer is yes: both high and low fructose diets have been shown to elevate blood levels of triglycerides, which are a well documented risk factor for cardiovascular disease (Austin et al. 1998). On a 20% fructose diet for 5 weeks, triglycerides (20%), LDL (12%) and total cholesterol (10%) each increased (Reiser et al. 1989). In contrast, although triglycerides were not found to elevated after 4 weeks of a 20% fructose diet (compared with 3% fructose in the controls) in a separate study, both LDL and total cholesterol were significantly elevated (Swanson et. al  1992). However, evidence from 2 additional studies in humans clearly show the positive association between increased fructose intake and elevated triglycerides. Le et. al (2006) found that fructose supplemented at 1.5g/kg body weight for only 1 month was sufficient to raise blood levels of triglycerides by 36% and VLDL-triglycerides by 72%. The amount of fructose supplemented is the Le study is equivalent to 75g and 105g fructose for a 50kg and 70 kg woman and man, respectively, and can easily be obtained by eating 11-15 bananas. In addition, Faeh et. al (2005) showed that fructose supplemented at 3 grams/kg body weight increased triglycerides by 79%. This amount of supplemented fructose is equivalent to eating 22-30 bananas. In addition, these are relatively low-fructose containing diets.

In contrast, rats fed a 67% fructose diet (the control diet contained only starch) more than doubled plasma triglycerides, increased the concentration of triglycerides in liver, increased liver size, and, decreased liver copper content. The importance of copper depletion is illustrated by its role as a cofactor in the enzyme Copper-Zinc superoxide dismutase (CuZnSOD), the first line of defense against superoxide radicals located in the cytosol of all cells. Depletion of liver copper would be expected to reduce CuZnSOD activity, thereby increasing liver oxidative stress. Indeed, the concentration of lipid peroxidation products was shown to be higher in plasma, heart and urine in rats fed the high fructose diet (Busserolles et al. 2003). The good news is that an all fruit diet would never reach the 67% fructose diet found in the Busserolle study, but evidence from relatively low fructose diets (20%) still show elevations in triglycerides.

If on a raw food diet the answer is to not to eat only fruit, what should be substituted? As mentioned earlier, there is no risk of forming AGE products, acrylamide or furan when boiling food. Therefore, substitution of some amount of fruit on a raw food diet, perhaps one third to half of the total calories should come from whole grains. Boiled whole grains (with vegetables, for the added flavor) is a great way to keep your total fructose intake relatively low. To ensure no loss of nutrients during the boiling process, don’t dump the soup, drink it, it’s delicious! The tocotrienols found almost exclusively in whole grains have been shown to reduce cholesterol (Zaiden et. al 2010), to reduce inflammation (Wu et al. 2008), to reduce DNA damage (Chin et al. 2008), to reduce cancer progression (Wada et al. 2005), and are neuroprotective (Khana et al. 2003). Therefore, when substituting fruit for whole grains, you won’t be sacrificing nutrition!

From a personal experience, in 2011 I switched from a Mediterranean diet to almost exclusively raw vegan. However, my triglycerides, which have never been higher than 60 mg/dL jumped from 40 mg/dL in 2011 to 90 in 2012! Nothing else changed in my routine-the supplements that I take, or how often I exercise, my body weight/composition was the same-only my diet changed. Based on this, it seems like raw plus boiled may be the path to optimal health!

If you’re interested, please have a look at my book!

References:
Austin MA, Holkanson JE, Edwards KL. Hypertriglyceridemia as a cardiovascular risk factor. Am J Cardiol 1998;81:7B-12B.

Busserolles J, Gueux E, Rock E, Demigné C, Mazur A, Rayssiguier Y. Oligofructose protects against the hypertriglyceridemic and pro-oxidative effects of a high fructose diet in rats.
J Nutr. 2003 Jun;133(6):1903-8.

Chin SF, Hamid NA, Latiff AA, Zakaria Z, Mazlan M, Yusof YA, Karim AA, Ibahim J, Hamid Z, Ngah WZ. Reduction of DNA damage in older healthy adults by Tri E Tocotrienol supplementation. Nutrition. 2008 Jan;24(1):1-10.

Faeh D, Minehira K, Schwarz J, Periasami R, Seongus P, Tappy L. Effect of fructose overfeeding and fish oil administration on hepatic de novo lipogenesis and insulin sensitivity in healthy males. Diabetes 2005;54: 1907-13.

Khanna S, Roy S, Ryu H, Bahadduri P, Swaan PW, Ratan RR, Sen CK. Molecular basis of vitamin E action: tocotrienol modulates 12-lipoxygenase, a key mediator of glutamate-induced neurodegeneration J Biol Chem. 2003 Oct 31;278(44):43508-15.

Lê KA, Faeh D, Stettler R, Ith M, Kreis R, Vermathen P, Boesch C, Ravussin E, Tappy L. A 4-wk high-fructose diet alters lipid metabolism without affecting insulin sensitivity or ectopic lipids in healthy humans. Am J Clin Nutr. 2006 Dec;84(6):1374-9.

Fructose data in foods provided by http://ndb.nal.usda.gov/ndb/foods/list

Reiser S, Powell AS, Scholfield DJ, Panda P, Ellwood KC, Canary JJ. Blood lipids, lipoproteins, apoproteins, and uric acid in men fed diets containing fructose or high-amylose cornstarch. Am J Clin Nutr. 1989 May;49(5):832-9.

Swanson JE, Laine DC, Thomas W, Bantle JP. Metabolic effects of dietary fructose in healthy subjects. Am J Clin Nutr. 1992 Apr;55(4):851-6.

Wada S, Satomi Y, Murakoshi M, Noguchi N, Yoshikawa T, Nishino H. Tumor suppressive effects of tocotrienol in vivo and in vitro. Cancer Lett. 2005;229:181-91.

Wu SJ, Liu PL, Ng LT. Tocotrienol-rich fraction of palm oil exhibits anti-inflammatory property by suppressing the expression of inflammatory mediators in human monocytic cells. Mol Nutr Food Res. 2008 Aug;52(8):921-9.

Zaiden N, Yap WN, Ong S, Xu CH, Teo VH, Chang CP, Zhang XW, Nesaretnam K, Shiba S, Yap YL. Gamma delta tocotrienols reduce hepatic triglyceride synthesis and VLDL secretion. J Atheroscler Thromb. 2010 Oct 27;17(10):1019-32.

War on drugs? Where is the government war on obesity?

War on drugs? Where is the government war on obesity?

The government sponsored war on drugs, at a cost $15.5 billion/year has as its goal to reduce drug use and its consequences in the US (Ref. 1, 2011 FY Budget Summary). Sadly, in 2007 (the most recent year for which data were available), the economic impact of illicit drug use on American society totaled more than $193 billion (Ref. 1).

But, where is the war on obesity? In 2009, the consequences of being overweight or obese cost a combined $270 billion (overweight, $72 billion; obesity, $198 billion; Ref. 2) in excess medical costs, mortality, and disability. The Society of Actuaries in 2010 (Ref. 2) reviewed almost 500 research articles published between 1980-2009 on obesity and its relation to mortality, and found that being overweight or obese is associated with increased prevalence of diabetes, cardiovascular disease, hypertension, cancer, kidney disease, stroke, osteoarthritis and sleep apnea. In addition, being obese significantly increases the risk of death and morbidity (Ref. 2). Although the government has sponsored a “let’s move” program, and, has invested $750 million in research with the goal of preventing tobacco use, obesity and heart disease (Ref. 4), these are minor moves when compared with the $270 billion economic burden of being overweight or obese.

The number of Americans that are overweight (BMI between 25.0–29.9) or obese (BMI of more than 30) is continuing to rise, and, it has been projected that by the year 2030, half of all US citizens will be obese, resulting in an additional cost of ~$60 billion/year (Ref. 5).

What’s the solution to this health crisis? In my opinion, taxes on all prepared and junk food. In other words, fruits, vegetables, raw nuts, meat, fish, eggs and dairy would not be taxed. There would be no taxes on farmed items, but, additional taxes on everything else. And, I believe this will work for the same reason that cigarette taxes have reduced the amount of smokers in the state of NY.

In 2008, NY increased its state cigarette excise tax by $1.25 to a total of $2.75 per pack, making it the highest state cigarette tax in the nation at the time. One year later, adult smoking in the state was at its lowest rate ever recorded, 16.7% of all New Yorkers. This was a 12% decrease, or nearly 310,000 fewer adult smokers than in 2008 (Ref. 3).

Furthermore, when reading the upcoming quote, the same argument can be made for reducing both childhood and adult obesity: “Cigarette taxes and are the most effective way to reduce smoking because higher prices drive people to quit, and, prevent young people from starting smoking. The Campaign for Tobacco Free Kids estimated that New York’s $1.25 cigarette tax increase would prevent more than 243,000 New York children alive today from smoking and motivate 140,000 more New York smokers to quit for good” (Ref. 3).

In an attempt to further reduce cigarette smoking in NY, the cigarette tax was raised an additional $1.60 in 2010.

Isn’t it about time that city, state and the federal government start a war against obesity?


References:

1) http://www.whitehouse.gov/ondcp/2011-national-drug-control-strategy (2011 FY Budget Summary)

2) Society of Actuaries, “Obesity and its Relation to Mortality and Morbidity Costs” 2010.

3) http://www.health.ny.gov/press/releases/2009/2009-06-04_cigarette_tax_iincrease_anniversary.htm

4) http://www.hhs.gov/news/press/2011pres/02/20110209b.html, “HHS Announces $750 million Investment in Prevention”

5) Wang YC, McPherson K, Marsh T, Gortmaker SL, Brown M. Health and economic burden of the projected obesity trends in the USA and the UK. Lancet. 2011 Aug 27;378(9793):815-25.


Vegans, Vegetarians, Fish and Meat eaters: Which diet is best for minimizing risk of disease and death?

To answer the question proposed in the title, today I’ll look at the results of the Oxford Vegetarian study, in which risk for all-cause mortality, ischemic heart disease and malignant neoplasms was determined (Appelby et al.  1999). 6000 vegetarians and 5000 non-vegetarians were recruited, and, all participants were further divided into 4 groups: vegans, defined as those who never ate animal products; vegetarians, who never ate meat or fish but did eat dairy products, eggs, or both; fish eaters, who ate fish but no meat; and meat eaters (who ate meat more than once per week).

All groups consumed the same amount of total calories. However, when comparing individual macronutrients, vegans had the lowest protein (3.3% of total calories less than meat eaters) and fat intake (4.6 % less), but they made up for this difference by having a higher carbohydrate intake (9.5%), relative to all other groups. A similar dietary pattern was found in vegetarians, when compared with both fish and meat eaters.

A decreased total cholesterol/HDL ratio (TC/HDL) was found in vegans, when compared with vegetarians, fish and meat eaters  The TC/HDL ratio has been shown to be a strong independent predictor for the development of peripheral arterial disease (PAD, Ridker et al.  2001), a disease in which plaque builds up in the arteries that carry blood to the head, organs, and limbs. In vegans, TC/HDL = 2.88; in vegetarians, 3.25; fish eaters, 3.21; meat eaters 3.56. Based on these results, the incidence of ischemic heart disease was predicted to be 57% lower in lifelong vegans and 24% in lifelong vegetarians than in meat eaters.

When considered as a whole group (11,000 subjects), significant associations between individual dietary components and mortality risk for ischemic heart disease were determined. For example, eating up to 5 eggs per week did not significantly increase mortality risk, but eating 6+ eggs per week increased risk by 270%. Eating cheese (excluding cottage) up to 4 times per week did not increase mortality risk, but eating cheese more than 5 times per week increased mortality risk by 247%.  Relative to the lowest intake of animal and saturated fat, mortality risk was increased by 329% and 277%, in the highest intake, respectively. Similarly, those that ate the most cholesterol had a 353% increased mortality risk, relative to the lowest intake. In other words, high amounts of eggs cheese, animal and saturated fat were found to be associated with increased risk for ischemic heart disease.

Death rates, risk of ischemic heart disease and the risk of malignant cancer were 20%, 28% and 39% reduced in in non-meat-eaters when compared with meat eaters.Cumulatively, these results provide yet another reason to reduce meat consumption! (Also see http://atomic-temporary-71218033.wpcomstaging.com/2014/07/25/methionine-restriction-extends-lifespan-another-reason-to-reduce-meatprotein-intake/).

If you’re interested, please have a look at my book!

References:

Appleby PN, Thorogood M, Mann JI, Key TJ. The Oxford Vegetarian Study: an overview. Am J Clin Nutr. 1999 Sep;70(3 Suppl):525S-531S.

Ridker PM, Stampfer MJ, Rifai N. Novel risk factors for systemic atherosclerosis: a comparison of C-reactive protein, fibrinogen, homocysteine, lipoprotein(a), and standard cholesterol screening as predictors of peripheral arterial disease. JAMA. 2001 May 16;285(19):2481-5

Don’t Eat Whole Grains? Where Will You Get Your Daily Dose of Tocotrienols?

Humans can’t synthesize Vitamin E and therefore, must obtain it from the diet. Vitamin E exists in 8 different forms: alpha (α), beta (β), gamma (γ) delta (δ)-tocopherol, and α, β, γ, and δ-tocotrienol.  The importance of Vitamin E during aging is illustrated by the finding that high blood levels of both tocopherols and tocotrienols are associated with a reduced risk (50%-90%) of developing mild cognitive impairment and Alzheimer’s disease in people older than 75 years (Mangialasche et. al 2010; Mangialasche et. al 2011).

However, is there a difference between tocopherols and tocotrienols, in terms of health? The answer is yes: tocotrienols have been shown to have better antioxidant properties (Serbinova et. al 1991), and, they have a greater ability to inhibit oxidative damage, relative to tocopherols (Kamat et. al 1997, Kamat, J. P. & Devasagayam 1995).

Tocotrienols have been used to reduce triglycerides (Zaiden et. al 2010), a well documented risk factor for cardiovascular disease (Austin et. al 1998). Tocotrienols have also been shown to reduce inflammation (Wu et. al 2008), to reduce DNA damage (Chin et. al 2008), to reduce the progression of both liver and lung cancer (Wada et. al 2005), and are neuroprotective (Khana et. al 2003, Nakagawa et. al 2007).  Furthermore, tocotrienols have been shown to be effective against tumor angiogenesis (Shibata et. al 2008). Angiogenesis-the formation of new blood vessels-plays an important role in many pathological processes, such as the growth and metastasis of solid tumors, diabetic retinopathy, rheumatoid arthritis, and psoriasis (Kim et. al 1993)

For those of you who are endurance athletes, tocotrienol supplementation has been shown to increase endurance capacity, in rats (Lee et al. 2009). It’s important to note that no human studies to date have investigated the role of tocotrienol supplementation on aerobic exercise capacity. In the Lee study, rats given a low dose of (25 mg/kg) of a tocotrienol rich supplement for one month doubled their swim time to exhaustion, whereas a high dose of tocotrienols (50 mg/kg) increased their swim time to exhaustion by 2.5-fold. In contrast, rats given a low dose (25 mg/kg) of α-tocopherol did not significantly increase swim endurance capacity.

So, where can we find dietary tocotrienols? Whole grains have the highest tocotrienol content, approximately 3 mg of tocotrienols/kg food, when compared with all other food groups (Sookwong et. al 2010). Tocotrienols are second most abundant in nuts and seeds, at 1.5 mg/kg. Tocotrienols are almost completely absent in all other food groups. The attached table in the right corner of this article lists tocotrienol content (in nanograms, ng) per calorie in commonly consumed whole grains, nuts/seeds, beans and oils. α-tocotrienol is particularly rich in oats and barley; durum wheat has ~5-fold more β tocotrienol than any other grain, although barley and soybeans are also good sources; corn contains the highest amount of γ-tocotrienol, approximately 4-fold more than barley; and, safflower oil contains the highest concentration of δ-tocotrienol, containing approximately 3-fold more δ-tocotrienol than adzuki beans.

Considering that both wheat and barley contain gluten, celiac disease-susceptible individuals may want to avoid these grains. However, celiac disease affects 1 in 133 Americans (http://www.uchospitals.edu/pdf/uch_007937.pdf), so 99.2% of the population should be able to eat these tocotrienol-rich grains without issue. It’s important to note that if you have celiac disease, you can obtain full tocotrienol coverage by eating the combination of cashews and peanuts, albeit at a far lower concentration than found in whole grains, as shown in the attached Table.

toco

On a final note, sesame seeds have been shown to elevate the concentration of tocotrienols found in skin (Ikeda et al. 2001), so if you want to get the biggest nutritional bang for your buck, consume tocotrienol-containing foods with sesame seeds. I do!

If you’re interested, please have a look at my book!

References
Austin MA, Holkanson JE, Edwards KL. Hypertriglyceridemia as a cardiovascular risk factor. Am J Cardiol 1998;81:7B-12B.

Chin SF, Hamid NA, Latiff AA, Zakaria Z, Mazlan M, Yusof YA, Karim AA, Ibahim J, Hamid Z, Ngah WZ. Reduction of DNA damage in older healthy adults by Tri E Tocotrienol supplementation. Nutrition. 2008 Jan;24(1):1-10.

Ikeda S, Toyoshima K, Yamashita K. Dietary sesame seeds elevate alpha- and gamma-tocotrienol concentrations in skin and adipose tissue of rats fed the tocotrienol-rich fraction extracted from palm oil. J Nutr. 2001 Nov;131(11):2892-7.

Kamat, J. P., Sarma, H. D., Devasagayam, T.P.A., Nesaretnam, K. & Basiron, Y. (1997) Tocotrienols from palm oil as effective inhibitors of protein oxidation and lipid peroxidation in rat liver microsomes. Mol. Cell. Biochem. 170: 131-138.

Kamat, J. P. & Devasagayam, T.P.A. (1995) Tocotrienols from palm oil as potent inhibitors of lipid peroxidation and protein oxidation in rat brain mitochondria. Neurosci. Lett. 195: 179-182.

Khanna S, Roy S, Ryu H, Bahadduri P, Swaan PW, Ratan RR, Sen CK. Molecular basis of vitamin E action: tocotrienol modulates 12-lipoxygenase, a key mediator of glutamate-induced neurodegeneration J Biol Chem. 2003 Oct 31;278(44):43508-15.

Kim KJ, Li B, Winer J, Armanini M, Gillett N, Phillips HS, Ferrara N. Inhibition of vascular endothelial growth factor induced angiogenesis. Nature 1993;362:841-4.

Lee SP, Mar GY, Ng LT. Effects of tocotrienol-rich fraction on exercise endurance capacity and oxidative stress in forced swimming rats. Eur J Appl Physiol. 2009 Nov;107(5):587-95.

Mangialasche F, Kivipelto M, Mecocci P, Rizzuto D, Palmer K, Winblad B, Fratiglioni L. High plasma levels of vitamin E forms and reduced Alzheimer’s disease risk in advanced age. J Alzheimers Dis. 2010;20(4):1029-37.

Mangialasche F, Xu W, Kivipelto M, Costanzi E, Ercolani S, Pigliautile M, Cecchetti R, Baglioni M, Simmons A, Soininen H, Tsolaki M, Kloszewska I, Vellas B, Lovestone S, Mecocci P; AddNeuroMed Consortium. Tocopherols and tocotrienols plasma levels are associated with cognitive impairment. Neurobiol Aging. 2011 Dec 20.

Nakagawa K, Shibata A, Yamashita S, Tsuzuki T, Kariya J, Oikawa S, Miyazawa T. In vivo angiogenesis is suppressed by unsaturated vitamin E, tocotrienol. J Nutr. 2007 Aug;137(8):1938-43.

Serbinova E, Kagan V, Han D, Packer L. Free radical recycling and intramembrane mobility in the antioxidant properties of a-tocopherol and a-tocotrienol. Free Radic Biol Med. 1991;10:263-75.
Shibata A, Nakagawa K, Sookwong P, Tsuzuki T, Oikawa S, Miyazawa T. Tumor anti-angiogenic effect and mechanism of action of delta-tocotrienol. Biochem Pharmacol. 2008 Aug 1;76(3):330-9.

Sookwong P, Nakagawa K, Yamaguchi Y, Miyazawa T, Kato S, Kimura F, Miyazawa T. Tocotrienol distribution in foods: estimation of daily tocotrienol intake of Japanese population. J Agric Food Chem. 2010 Mar 24;58(6):3350-5.

Wada S, Satomi Y, Murakoshi M, Noguchi N, Yoshikawa T, Nishino H. Tumor suppressive effects of tocotrienol in vivo and in vitro. Cancer Lett. 2005;229:181-91.

Wu SJ, Liu PL, Ng LT. Tocotrienol-rich fraction of palm oil exhibits anti-inflammatory property by suppressing the expression of inflammatory mediators in human monocytic cells. Mol Nutr Food Res. 2008 Aug;52(8):921-9.

Zaiden N, Yap WN, Ong S, Xu CH, Teo VH, Chang CP, Zhang XW, Nesaretnam K, Shiba S, Yap YL. Gamma delta tocotrienols reduce hepatic triglyceride synthesis and VLDL secretion. J Atheroscler Thromb. 2010 Oct 27;17(10):1019-32.

Vegans and Vegetarians Have Higher Levels of Lifespan-Shortening AGE Products?

Crispy, brown toast and grill marks on your chicken, fish or beef both contain elevated amounts of Advanced Glycation End (AGE) Products, a group of molecules formed during high temperature cooking (greater than 250ºF; i.e. frying, grilling, roasting, baking). In a previous article (https://michaellustgarten.wordpress.com/2014/07/25/advanced-glycation-end-products-theres-more-to-health-than-counting-calories-protein-fat-and-carbs/) I wrote about the adverse health effects of consuming a high AGE product diet (measured as carboxymethyl-lysine, CML), including increased body weight (without increasing food intake), increased oxidative stress and oxidative damage, insulin resistance, and, a reduced lifespan (Cai et al. 2007). In a second study, the lifespan extending effects of calorie restriction (the gold standard in terms of extending lifespan) were abolished by adding the AGE products CML and methylglyoxal (MG) back into the diet (Cai et al. 2008). However, these results are in rodents- what does the evidence say in people?

Unfortunately, in people the story does not get better. AGE products have been shown to play a causative role in atherosclerosis, diabetes, cardiovascular disease, and, chronic kidney disease (Semba et al. 2010). And, it gets worse-older adults with elevated levels of CML are at greater risk for arterial stiffness (Semba et al. 2009), anemia (Semba et al. 2008), poor muscle strength (Dalal et al. 2009), low physical performance (Semba et al. 2010), and, increased risk of all-cause mortality (Semba et al. 2009). Not good!

So, the take home message is to not eat food browned at a high temperature, and, to reduce the amount of AGE products consumed in the diet, right? After all, the contribution of dietary AGE products to the total pool of AGE products in the body is much greater than the amount of AGE products that are endogenously generated by abnormal glucose metabolism or lipid oxidation (Henle 2003).

But, vegans and vegetarians have been shown to have higher levels of the AGE product CML in their blood, relative to meat-eaters (Sebeková et al. 2001, Krajcovicová-Kudlácková et al. 2002)! And, obese children have lower levels of CML than lean children (Sebeková et al. 2009). Furthermore, people with high levels of fat have been shown to have lower levels of CML, and vice versa-those with low body fat have been shown to have high levels of CML (Semba et al. 2011)! In other words, populations that are well documented to have improved health, including vegans, vegetarians and lean subjects have elevated blood levels of the same AGE product, CML that has been shown to be either associated with or that cause all sorts of bad things in both rodents and people. Does that mean that vegans, vegetarians and lean subjects will eventually suffer from the same AGE product induced ill-health? Let’s dissect the data…

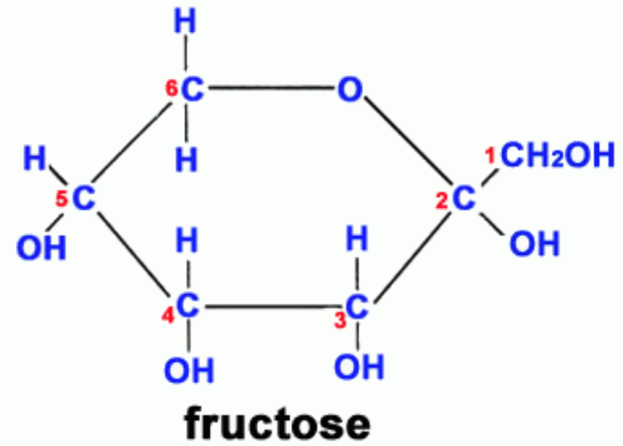
Study #1: AGE products (measured as CML and fluorescence) were shown to be higher in vegans, lacto-ovo-vegetarians and semi-vegetarians, relative to omnivores. Study strengths: young subjects, between 30-40y (thereby minimizing the confounding affect of age on AGE product formation), and, all groups were within a healthy BMI range (<25 kg/m2). As expected, the BMI for vegans and vegetarians was significantly lower than found in omnivores. All subjects had been on these diets for 7-8 years.  Weakness: small study population-9 vegans, 19 lacto-ovo-vegetarians, 14 semi-vegetarians, 19 omnivores. The authors hypothesized that higher fruit intake by vegans and vegetarians might be the reason for the elevated CML found in these groups (Sebekova et al. 2001). CML is primarily formed via the reaction of fructose (the main sugar found in fruit) with the amino acid lysine (Figure 2). In support of this, AGE products (measured by fluorescence) have been shown to form at a greater rate in the presence of fructose, relative to glucose (Jakus et al. 1998).

Study #2: Plasma CML and fluorescent AGE products were found to be higher in vegetarians, relative to meat eaters. As in study#1, a lower BMI was reported for vegetarians (22 kg/m2), relative to meat-eaters (24 kg/m2), indicating that this was a healthy cohort. Also, young subjects in both groups-on average, 31y for meat-eaters and 36y for vegetarians. However, a limited number of total study subjects, 38, were used. In support of the hypothesis from study#1 that a higher fruit intake was responsible for the elevation in CML found in vegetarians, the frutose/lysine ratio was found to be higher in vegetarians, compared with meat-eaters (Krajcovicová-Kudlácková et al. 2002).

Study #3: Overweight children (BMI 27 kg/m2, compared with 22 kg/m2 for controls; average age, 12y) had significantly reduced (~30% ) concentrations of plasma AGE product fluorescence, fructose-lysine, and CML than their lean counterparts, despite being insulin resistant, having elevated inflammation, and, elevated protein and DNA oxidation (Sebeková et al. 2009).

Study #4: Serum CML was found to be inversely associated with total fat mass, trunk fat mass, and fat mass in the arms + legs combined, after adjusting for age, sex, BMI, systolic blood pressure, TG, HDL cholesterol, and renal function (Semba et al. 2011). In other words, those with high CML were found to have have low fat mass, whereas those with low CML have high fat mass.

Study #5: No difference in serum CMLwas found when comparing obese with lean subjects; CML was reported to be elevated in fat tissue from obese subjects (Gaens et al 2007).

What’s going on here? Leanness is well documented as associated with improved health, yet, in these studies, lean subjects had higher CML relative to those with higher fat mass. In addition, two separate studies showed higher CML in healthy vegans and vegetarians, compared with meat eaters! How is this possible?

First, use of fluorescence to detect products related to oxidative stress has been problematic (Muller 2009), as auto-oxidation of the probes commonly used for detection often makes the measurement unreliable. But what about CML? There is a wealth of data detailing the adverse effects of CML on both rodent and human health. In my opinion, this is a perfect example of correlation not proving causation. In most of the studies that measure AGE products, CML is used as the global marker of AGE product content. Because the data in healthy populations (vegans, vegetarians, lean subjects) contradicts the wealth of CML related evidence in terms of health, something must be wrong in using CML as a marker of AGE products, and, overall health. In other words, CML is associated with many adverse outcomes, but does not prove it. In support of this, in one of the rodent studies that showed a reduction in lifespan that was associated with increased CML, an additional AGE product, methylglyoxal was also associated with this adverse outcome. Methylglyoxal has been shown to increase inflammation (TNF-α production) and oxidative stress (glutathione depletion) to a much greater degree than CML (Cai et al. 2002). Although both methylglyoxal and CML have both been shown to increase during aging (Uribarri et al 2007), methylglyoxal is not commonly measured in relation to the adverse outcomes found in humans.

So, if you’re lean, vegan or vegetarian and you have high levels of CML, should you worry that you’re on the road to ill-health? The easy answer is no, but, in my opinion, if your methylglyoxal levels are also high, it might be time to stop/minimize eating foods that have been cooked at a high temperature…

If you’re interested, please have a look at my book!

References:

Cai W, Gao QD, Zhu L, Peppa M, He C, Vlassara H. Oxidative stress-inducing carbonyl compounds from common foods: novel mediators of cellular dysfunction. Mol Med. 2002 Jul;8(7):337-46.

Cai W, He JC, Zhu L, Chen X, Wallenstein S, Striker GE, Vlassara H. Reduced oxidant stress and extended lifespan in mice exposed to a low glycotoxin diet: association with increased AGER1 expression.Am J Pathol. 2007 Jun;170(6):1893-902.

Cai W, He JC, Zhu L, Chen X, Zheng F, Striker GE, Vlassara H. Oral glycotoxins determine the effects of calorie restriction on oxidant stress, age-related diseases, and lifespan. Am J Pathol. 2008 Aug;173(2):327-36.

Dalal M, Ferrucci L, Sun K, Beck J, Fried LP, Semba RD. Elevated serum advanced glycation end products and poor grip strength in older community-dwelling women. J Gerontol A Biol Sci Med Sci. 2009;64:132-137.

Gaens KHJ, van de Waarenburg MPH, Nijhuis J, Scheijen J, Stehouwerr CDA, Schalkwijk CG. Increased formation of N-(carboxymethyl)lysine (CML) in human adipose tissue; possible biological consequences. 9th International Symposium on the Maillard Reaction, 2007. Abstract.

Henle T. AGEs in foods: do they play a role in uremia? Kidney Int. 2003; Suppl 84:S145-7.

Jakus V, Rietbrock N, Hrnciarová M (1998) Study of inhibition of protein glycation by fluorescence spectroscopy. Chem Papers 52:446

Krajcovicová-Kudlácková M, Sebeková K, Schinzel R, Klvanová J. Advanced glycation end products and nutrition. Physiol Res. 2002;51(3):313-6.

Muller FL. A critical evaluation of cpYFP as a probe for superoxide. Free Radic Biol Med. 2009 Dec 15;47(12):1779-80.

Sebeková K, Somoza V, Jarcusková M, Heidland A, Podracká L. Plasma advanced glycation end products are decreased in obese children compared with lean controls. Int J Pediatr Obes. 2009;4(2):112-8.

Sebeková K, Krajcoviová-Kudlácková M, Schinzel R, Faist V, Klvanová J, Heidland A. Plasma levels of advanced glycation end products in healthy, long-term vegetarians and subjects on a western mixed diet. Eur J Nutr. 2001 Dec;40(6):275-81.

Semba RD, Patel KV, Sun K, Guralnik JM, Ershler WB, Longo DL, Ferrucci L. Association of serum carboxym­ethyl-lysine, a dominant advanced glycation end product, with ane­mia in adults: the Baltimore Longitudinal Study of Aging. <i>J Am Geriatr Soc</i>. 2008;56:2145-2147.

Semba RD, Bandinelli S, Sun K, Guralnik JM, Ferrucci L. Plasma carboxymethyl-lysine, and advanced glycation end product, and all-cause and cardiovascular disease mortality in older community-dwelling adults. <i>J Am Geriatr Soc</i>. 2009;57:1874-1880.

Semba RD, Najjar SS, Sun K, Lakatta EG, Ferrucci L. Serum car­boxymethyl-lysine, an advanced glycation end product, is associated with increased aortic pulse wave velocity in adults. Am J Hypertens. 2009;22:74-79.

Semba RD, Nicklett EJ, Ferrucci L. Does accumulation of advanced glycation end products contribute to the aging phenotype? J Gerontol A Biol Sci Med Sci. 2010;65:963-75.

Semba RD, Bandinelli S, Sun K, Guralnik JM, Ferrucci L. Relation­ship of an advanced glycation end product, plasma carboxymethyl-lysine, with slow walking speed in older adults: the InCHIANTI study. <i>Eur J Appl Physiol</i>. 2010;108:191-195.

Semba RD, Fink JC, Sun K, Windham BG, Ferrucci L. Elevated se­rum advanced glycation end products are associated with renal insuf­ficiency: the Baltimore Longitudinal Study of Aging. J Ren Nutr. 2010;20:74-81.

Semba RD, Arab L, Sun K, Nicklett EJ, Ferrucci L. Fat mass is inversely associated with serum carboxymethyl-lysine, an advanced glycation end product, in adults. J Nutr. 2011 Sep;141(9):1726-30.

Uribarri J, Cai W, Peppa M, Goodman S, Ferrucci L, Striker G, Vlassara H. Circulating glycotoxins and dietary advanced glycation endproducts: two links to inflammatory response, oxidative stress, and aging. J Gerontol A Biol Sci Med Sci. 2007;62:427-33.

Aluminum intake and congnitive decline: Watch out for aluminum in your deodorant

How much aluminum is in your food, or in products (which would allow for aluminum to be absorbed through the skin) such as deodorant? When most people think about aluminum, food sources are most likely not to come to mind, but rather, aluminum foil or aluminum pots. However, up to 10 mg of aluminum/day is ingested from freshly-prepared natural sources, mainly fresh fruit, vegetables and meat. Taking into account data from a US food additives survey, Greger (1993) estimated that approximately 50% of Americans ingest up to 24 mg aluminum/day, 45% ingest between 24 and 95 mg aluminum/day, and 5% take in more than 95 mg aluminum/day. The higher dietary aluminum range is likely accumulated from its presence in baking powder, as additives in commercially-processed foods and beverages and, from cooking with aluminum pots.

So, why is aluminum intake important? Is there an association with lifespan? The short answer is no. No effect on lifespan was shown by Walton (2007) when diets containing low, intermediate or high doses of aluminum (that in humans would be equivalent to 20, 25 or 85 mg/day for a 120 lb. woman, and 29, 36 or 122 mg/day for a 160 lb. man) were supplemented to rats, starting in middle age (16 months) forward in rats. Rats on the control diet lived, on average, 31.3 months; lifespan of rats on the low, intermediate and high aluminum diets were  31.1, 32.4 and 30.5 months, respectively.

However, an association between aluminum intake and an accelerated loss of cognitive function was shown by Walton (2009). Beginning in middle age, rats consumed a daily amount of aluminum that would be equivalent to 22, 27 or 92 mg/day for a 120 lb. woman, and 29, 36 or 124 mg/day for a 160 lb. man. Of the 30 rats that survived to at old age, 0/10 on the lowest aluminum dose, 2/10 on the intermediate dose, and 7/10 on the higher dose performed worse on a spatial memory test, when compared with their values in middle age. In addition, rats that performed worse on the test had a significant amount of aluminum deposition in the brain. From these data it can be concluded that increasing dietary aluminum consumption may increase the susceptibility for age-related cognitive decline. In addition, a link between aluminum intake and the brain pathology that is associated with Alzheimer’s disease has been identified (Walton 2006; Walton 2007), but a causative role for aluminum has yet to be proved.

Is the answer then, to eat a diet that eliminates processed foods (and aluminum foil/pots), to reduce risk of cognitive decline? The answer is yes, but there is an overlooked source of aluminum that we all use: deodorant. For example, Gillette Clinical Strength contains 20% (by weight) aluminum. In a 1.7 (48 grams) ounce package, approximately 10 grams of aluminum is present. Assuming use of one deodorant per month, to calculate the daily aluminum exposure we divide the 10 grams by 30 days to obtain ~330 mg aluminum/day. When considering that a diet rich in fruits and vegetables and that eliminates both aluminum containing processed foods and aluminum foil/pots, one would ingest ~10 mg of aluminum per day, absorption of only 25% (~80 mg) of the aluminum present in the Gillette deodorant would place one in the highest quartile of aluminum intake (greater than 100 mg/day), based on Walton’s cognitive function study of 2009. At worst, if all of the aluminum as present in deodorant is absorbed through the skin into the bloodstream, blood levels of aluminum would be more than 3-fold higher than tested in Walton’s rat studies. In other words, even on a pure diet, one could be at risk for high-aluminum related conditions, because of deodorant-based aluminum. Aluminum-free deodorants do exist, and if your goal is to minimize the risk of cognitive decline and potentially, Alzheimer’s disease, buy aluminum-free deodorant!

If you’re interested, please have a look at my book!

References:
Greger JL. Dietary and other sources of aluminium intake.Ciba Found Symp. 1992;169:26-35.

Walton JR. Aluminum in hippocampal neurons from humans with Alzheimer’s disease. Neurotoxicology. 2006 May;27(3):385-94.

Walton JR. A longitudinal study of rats chronically exposed to aluminum at human dietary levels. Neurosci Lett. 2007 Jan 22;412(1):29-33.

Walton JR. Functional impairment in aged rats chronically exposed to human range dietary aluminum equivalents. Neurotoxicology. 2009 Mar;30(2):182-93.

Methionine restriction extends lifespan

Calorie restriction is well documented as the gold standard in terms of minimizing disease risk and maximizing longevity in almost every organism tested-worms, flies, mice, rats, dogs and monkeys. However, eating 10-30% less calories than usual is a difficult task for most people, as evidenced by the continuous rise in global obesity. But, there may be a way to reap the benefits of a calorie restricted diet without actually eating less calories, one that involves eating less methionine.

Methionine is one of the 20 essential amino acids, meaning that the human body cannot synthesize it, and therefore, it must be supplied by the diet. As shown below, a 5.5-fold restriction in dietary methionine (0.17% of total calories compared with 0.86%) without any other dietary changes (in rats) has been shown to increase average lifespan by ~20%, and maximal lifespan by 12% (Orentreich et al. 1993). Translated into human lifespan, a 20% increase would equate to an average lifespan from 75 to 90 years and a maximal lifespan from 122 to 134 years!

methio

More importantly, food intake when normalized to body weight was greater in methionine-restricted animals, evidence that indicates that the lifespan extending effect was not due to a reduction in calories.

methio food

In other words, the methionine-restricted rats ate more than rats on the normal diet, but, these calories were not deposited as fat (or muscle), but burned as heat. This concept, of an increase in heat production (as opposed to energy production) is known as uncoupling, and has also been shown to be associated with an increased lifespan (Speakman et al. 2004). Furthermore, dietary methionine restriction has been shown to increase uncoupling (Hasek et al. 2010), and may be playing a part in the observed extended lifespan shown by Orentreich et al. (1993).

So how can we incorporate methionine restriction into our every day diet? The easy answer would be to reduce overall protein intake. For example, a diet that included a 4-egg white omelet for breakfast, a tuna sandwich for lunch, and a relatively lean (85-15, protein-fat) burger for dinner would contain a total of ~75 grams of protein and ~2.1 grams of methionine (based on the methionine content list as reported by McCarty et al. 2009) . Replacing these protein (and methionine) rich sources with an equivalent amount of calories (80 calories, egg whites; 170 calories, tuna; 250 calories beef) with whole wheat pasta (500 calories, or any other grain) reduces the overall protein intake to 24 grams, with ~300 mg (0.3 grams) of methionine. As you can see, elimination of egg/fish/meat reduces the methionine content by 7-fold, and, may be feasible in humans as a means for increasing lifespan.

My 7-day average protein intake is shown below. Within that, my average methionine intake is 0.8g/day. However, it is important to note that the nutrient-tracking software that I use (cronometer.com) for some reason doesn’t have the amino acid breakdown for my daily can of sardines, which adds 0.6 g of methionine. In total, I consume on average, 0.8 g + 0.6 g = 1.4 daily grams of methionine. Each gram of protein contains 4 calories. Therefore, my daily methionine intake =1.4*4 = 5.6 calories. My average calorie intake during that 7-day period was 2241 calories. 5.6/2241 *100 = 0.25%, which puts me closer to the 0.17% long-lived diet than to the shorter-lived 0.86% of Orentreich et al. 1993.

methio crono

If you’re interested, please have a look at my book!

References:

Hasek BE, Stewart LK, Henagan TM, Boudreau A, Lenard NR, Black C, Shin J, Huypens P, Malloy VL, Plaisance EP, Krajcik RA, Orentreich N, Gettys TW. Dietary methionine restriction enhances metabolic flexibility and increases uncoupled respiration in both fed and fasted states. Am J Physiol Regul Integr Comp Physiol. 2010 Sep;299(3):R728-39.

McCarty MF, Barroso-Aranda J, Contreras F. The low-methionine content of vegan diets may make methionine restriction feasible as a life extension strategy. Med Hypotheses. 2009 Feb;72(2):125-8.

Orentreich N, Matias JR, DeFelice A, Zimmerman JA. Low methionine ingestion by rats extends life span. J Nutr. 1993 Feb;123(2):269-74.