On my latest blood test (August 2015), my total cholesterol was 127 mg/dL-is that value optimal for health and longevity?
Based on data for 1,104,294 men younger than 60y (median age, 40y) that were followed for up to 14 years (Fulks et al. 2009), my 127 mg/dL value (1 – 2.4%) puts me relatively close to maximally reduced all-cause mortality risk, which occurs at 146-158 mg/dL (5-9% on the graph below):

But what about the data for men older than 60?
In a 10-year study of 2,277 older adults (average age, ~77y), total cholesterol levels less than 175 mg/dL were associated with ~2-fold higher risk of all-cause mortality, compared with values greater than 226 mg/dL (Schupf et al. 2005):

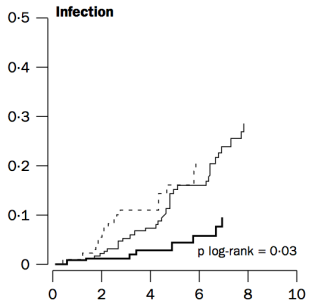
Similarly, in a 10-year study of even older adults (median age, 89y; 724 subjects), all-cause mortality risk was significantly increased in subjects with total cholesterol values less than 193 mg/dL (dark black line below), compared with values greater than 251 mg/dL (dashed line; Weverling-Rijnsburger et al. 1997). In addition, subjects with cholesterol values greater than 251 mg/dL lived ~2 years longer than those with values less than 191 mg/dL. So higher cholesterol in very old adults…increased lifespan! Does that mean I should alter my dietary approach to increase my circulating cholesterol levels after I reach 60?

To address that issue, it’s important to understand why cholesterol increases during aging. One possible mechanism involves the role of cholesterol in immune defense against infectious agents (bacteria, viruses, parasites, etc.). Obviously, our immune system is supposed to eliminate these pathogens, but immune function decreases with age (Targonski et al. 2007). As a compensatory mechanism, cholesterol can protect against infectious agents. For example, LDL cholesterol binds to and partially inactivates Staphylococcus aureus (Bhakdi et al. 1983). Staphylococcus aureus infection increases during aging, as its incidence rate is ~3-fold higher in adults older than 60y, when compared with younger subjects (Laupland et al. 2008). In addition, LDL cholesterol inhibits bacterial endotoxin (Weinstock et al. 1992), whose presence in the blood increases during aging (Ghosh et al. 2015). In support of the link between circulating cholesterol with infectious agents, in the older adults of Weverling-Rijnsburger et al. (1997), cholesterol values greater than 251 mg/dL (solid black line) were associated with significantly decreased infectious disease-related mortality, when compared with values less than 193 mg/dL:
So if we’re better able to keep infectious agents out of our blood, that would be expected to reduce the need for elevated circulating cholesterol during aging. How can we do that?
One approach involves increased dietary fiber. Fermentation of dietary fiber by gut bacteria produces short-chain fatty acids, which improve gut barrier function (Chen et al. 2013), and decrease cholesterol synthesis (Wright et al. 1990). However, older adults do not eat high-fiber diets, as values of only ~19g/day have been reported (Lustgarten et al. 2014). In contrast, dietary fiber intakes greater than only 29g/day are associated with less infectious disease (and all-cause mortality) risk (Park et al. 2011). So definitely eating at least 29g fiber/day is important, but is that amount optimal to minimize the need for elevated cholesterol during aging?
In a 2-week study of the role of dietary fiber on circulating cholesterol, subjects that ate only 10g fiber/1000 calories did not significantly reduce their baseline total cholesterol values from ~182 mg/dL (Jenkins et al. 2001). In contrast, a dietary fiber intake of 19g/1000 calories reduced baseline total cholesterol from 185 to 150 mg/dL, and subjects that ate even more fiber than that, 55g/1000 calories reduced their total cholesterol values from ~182 to 142 mg/dL, a drop that was also significantly different compared with the 19g fiber/1000 calorie group.
Collectively, these data suggest that to maximally boost gut barrier function, thereby minimizing circulating infectious agents and the need for elevated circulating cholesterol during aging, a very-high fiber-diet may be important. Accordingly, my average daily fiber intake is ~100 g/day on a 2300 calorie diet, resulting in ~43g fiber/1000 calories. Based on this, I don’t expect for my total cholesterol values to change during aging, as my gut barrier function will be optimal, and infectious agents in my blood will be minimized.
To add some specificity to this approach, 2 additional measurements may be important: serum albumin and HDL cholesterol. In agreement with the studies of Weverling-Rijnsburger et al. and Schupf et al., in a 5-year study of 4,128 older adults (average age, ~79y), those with total cholesterol values less than 160 mg/dL had significantly higher all-cause mortality risk, compared with values greater than 240 mg/dL (Volpato et al. 2001):

However, when considering subjects’ albumin and HDL cholesterol levels, the differential mortality risk was abolished. Subjects that had low total cholesterol but also high (within-range) albumin and HDL had improved survival compared to the higher cholesterol groups:

If your total cholesterol values are less than 160 mg/dL, what serum albumin and HDL values should you shoot for? As shown below, albumin levels greater than 38 g/L and HDL values greater than 47 mg/dL were associated with maximally reduced all-cause mortality risk in subjects with total cholesterol values less than 160 mg/dL (Volpato et al. 2001):

My albumin values are consistently between 46-48 g/L, but during recent measurements my HDL levels have been lower than optimal (35 mg/dL on 8/2015). The good news is that I was able to increase my HDL from 28 (7/2013 measurement) to 35 mg/dL by adding ~4 oz of fish every day! To further increase my HDL, I’ve doubled my fish oil intake (~3.3 g of combined EPA + DHA per day, from 5-9 g of cod liver oil). I’ll test the effect of this on my circulating biomarkers in a couple of months, so stay tuned!
3/23/2016 Update: Because of concerns that the pre-formed Vitamin A (that is found in cod liver oil) may negate the potential health-promoting effects of optimal Vitamin D levels (Schmutz et al. 2016), I stopped taking cod liver oil during the 3-month period that preceded my latest blood test (3/23/2016). However, I was able to increase my HDL from 35 to 53 mg/dL! I attribute this increase to the daily inclusion of ~60g/walnuts per day. In doing that, although I only replaced ~200 calories from carbohydrates with fat, lower carbohydrate diets have been shown to increase HDL (Manor et al. 2016).
Nonetheless, in terms of the all-cause mortality data that includes total cholesterol (137 mg/dL), albumin (51 g/L), and HDL (53 mg/dL), based on my latest blood test results, my risk is now maximally low!
If you’re interested, please have a look at my book!
References
Bhakdi S, Tranum-Jensen J, Utermann G, Füssle R. Binding and partial inactivation of Staphylococcus aureus alpha-toxin by human plasma low density lipoprotein. J Biol Chem. 1983 May 10;258(9):5899-904.
Chen H, Mao X, He J, Yu B, Huang Z, Yu J, Zheng P, Chen D. Dietary fibre affects intestinal mucosal barrier function and regulates intestinal bacteria in weaning piglets. Br J Nutr. 2013 Nov;110(10):1837-48.
Eaton SB, Eaton SB 3rd, Konner MJ. Paleolithic nutrition revisited: A twelve-year retrospective on its nature and implications. Eur J Clin Nutr. 1997 Apr;51(4):207-16.
Fulks M, Stout RL, Dolan VF. Association of cholesterol, LDL, HDL, cholesterol/ HDL and triglyceride with all-cause mortality in life insurance applicants. J Insur Med. 2009;41(4):244-53.
Ghosh S, Lertwattanarak R, Garduño Jde J, Galeana JJ, Li J, Zamarripa F, Lancaster JL, Mohan S, Hussey S, Musi N. Elevated muscle TLR4 expression and metabolic endotoxemia in human aging. J Gerontol A Biol Sci Med Sci. 2015 Feb;70(2):232-46.
Jenkins DJ, Kendall CW, Popovich DG, Vidgen E, Mehling CC, Vuksan V, Ransom TP, Rao AV, Rosenberg-Zand R, Tariq N, Corey P, Jones PJ, Raeini M, Story JA, Furumoto EJ, Illingworth DR, Pappu AS, Connelly PW. Effect of a very-high-fiber vegetable, fruit, and nut diet on serum lipids and colonic function. Metabolism. 2001 Apr;50(4):494-503.
Laupland KB, Ross T, Gregson DB. Staphylococcus aureus bloodstream infections: risk factors, outcomes, and the influence of methicillin resistance in Calgary, Canada, 2000-2006. J Infect Dis. 2008 Aug 1;198(3):336-43.
Lustgarten MS, Price LL, Chalé A, Fielding RA. Metabolites related to gut bacterial metabolism, peroxisome proliferator-activated receptor-alpha activation, and insulin sensitivity are associated with physical function in functionally-limited older adults. Aging Cell. 2014 Oct;13(5):918-25.
Mansoor N, Vinknes KJ, Veierød MB, Retterstøl K. Effects of low-carbohydrate diets v. low-fat diets on body weight and cardiovascular risk factors: a meta-analysis of randomised controlled trials. Br J Nutr. 2016 Feb;115(3):466-79.
Park Y, Subar AF, Hollenbeck A, Schatzkin A. Dietary fiber intake and mortality in the NIH-AARP diet and health study. Arch Intern Med. 2011 Jun 27;171(12):1061-8.
Schmutz EA, Zimmermann MB, Rohrmann S. The inverse association between serum 25-hydroxyvitamin D and mortality may be modified by vitamin A status and use of vitamin A supplements. Eur J Nutr. 2016 Feb;55(1):393-402.
Schupf N, Costa R, Luchsinger J, Tang MX, Lee JH, Mayeux R. Relationship Between Plasma Lipids and All-Cause Mortality in Nondemented Elderly. J Am Geriatr Soc. 2005 Feb;53(2):219-26.
Targonski PV, Jacobson RM, Poland GA. Immunosenescence: role and measurement in influenza vaccine response among the elderly. Vaccine. 2007 Apr 20;25(16):3066-9.
Vasto S, Scapagnini G, Rizzo C, Monastero R, Marchese A, Caruso C. Mediterranean diet and longevity in Sicily: survey in a Sicani Mountains population. Rejuvenation Res. 2012 Apr;15(2):184-8.
Volpato S, Leveille SG, Corti MC, Harris TB, Guralnik JM. The value of serum albumin and high-density lipoprotein cholesterol in defining mortality risk in older persons with low serum cholesterol. J Am Geriatr Soc. 2001 Sep;49(9):1142-7.
Weinstock C, Ullrich H, Hohe R, Berg A, Baumstark MW, Frey I, Northoff H, Flegel WA. Low density lipoproteins inhibit endotoxin activation of monocytes. Arterioscler Thromb. 1992 Mar;12(3):341-7.
Weverling-Rijnsburger AW, Blauw GJ, Lagaay AM, Knook DL, Meinders AE, Westendorp RG. Total cholesterol and risk of mortality in the oldest old. Lancet. 1997 Oct 18;350(9085):1119-23.
Wright RS, Anderson JW, Bridges SR. Propionate inhibits hepatocyte lipid synthesis. Proc Soc Exp Biol Med. 1990 Oct;195(1):26-9.

Any data for women?
LikeLike
With the exception of the first figure, all the other data is for both men and women. For women younger than 60, the data is similar to in the men: lowest all-cause mortality risk at 139-149 mg/dL (Fulks et al. 2009).
LikeLike
I could not find fulltext for the Schupf study, but lipid lowering drugs seem like a big confounder here.
LikeLike
Schupf et al. explored that issue:
” Inclusion of treatment with lipid-lowering drugs (statins) in the model attenuated but did not abolish the associations between low plasma lipid levels and risk of death (RR = 1.5, 95% CI =
1.0–2.1 for total cholesterol, RR = 1.5, 95% CI 5 1.0–2.0 for non-HDL-C, and RR = 1.9, 95% CI = 1.3–2.8 for LDL-C for those in the lowest quartile compared with those in the highest quartile) (Model 2, not shown).”
LikeLike
You said that your 127 mg/dL value is (1 – 2.4%) on the graph. How can I associate my value with the graph if my TC is 175 mg/dL? How do you convert this?
Thanks!
LikeLike
175 mg/dL puts you in the 10-25% group
LikeLike
How do linseeds/flaxseeds compare with walnuts?
Does it have a similar effect on cholesterol?
Thanks
LikeLike
Flaxseeds don’t have a similar effect on my HDL. In fact, my HDL was at its lowest level when I ate ~ 2oz of flax/day. I still eat it, but occasionally. But what works for me may be different for you!
LikeLiked by 1 person
According to WHO data as assembled in the following website, all cause mortality is a minimum at cholesterol around 222 mg/dL. What do you think of this data?
http://perfecthealthdiet.com/2011/06/blood-lipids-and-infectious-disease-part-i/

LikeLike
That data is in line what I wrote about-the purported decreased ACM risk for higher TC in older adults. But also note (in my article) that when albumin and HDL are considered in the TC model, lower, not higher, cholesterol is associated with reduced risk in older adults. imo, the strength of the data when you add additional biomarkers.
LikeLike
Thanks for the quick reply!
But isn’t the data I posted across ALL age demographics? Isn’t that what “age-standardized” means? (See Y-axis.) (I may be misinterpreting that…)
LikeLike