
Circulating levels of white blood cells (WBCs) are one of the 10 variables used to quantify biological age with PhenoAge (https://atomic-temporary-71218033.wpcomstaging.com/2019/09/09/quantifying-biological-age). The reference range for WBCs is 4.5 – 11 *10^9 cells/L, but within that range, what’s optimal?
Several studies have reported that WBCs greater than 5 are associated with an increased all-cause mortality risk (Ahmadi-Abhari et al. 2013, Samet et al. 2005, Weijenberg et al. 1996). While observational studies are important for identifying associations with mortality risk, stronger evidence is obtained when the data from the same subjects are tracked for a long time period. Perhaps the best evidence for the association between WBCs with mortality risk comes from the Baltimore Longitudinal Study on Aging (BLSA), which studied 2803 men and women over a period of 44 years (Ruggiero et al. 2007). As shown below, subjects that had circulating WBCs between 3.5 – 6 had the best survival, whereas WBCs below 3.5, between 6 – 10, and 10+ each had successively higher risk. The 0.5 point on the y-axis of the curve (survival) is defined as 50% mortality, and is the point where half of the study subjects died, whereas the remaining 50% were still alive. At that point, compared with subjects that had WBCs between 6 – 10, people that had WBCs between 3.5 – 6 lived ~7 years longer! So getting your WBC into that range may be a big deal for increasing life expectancy.

How can you reduce circulating WBCs? One way to reduce WBCs is to eat less calories, thereby reducing your body weight. As shown below, eating less calories resulted in a decreased BMI and decreased WBCs in the Biosphere II project (Walford et al. 2002), almost exactly in the same pattern:

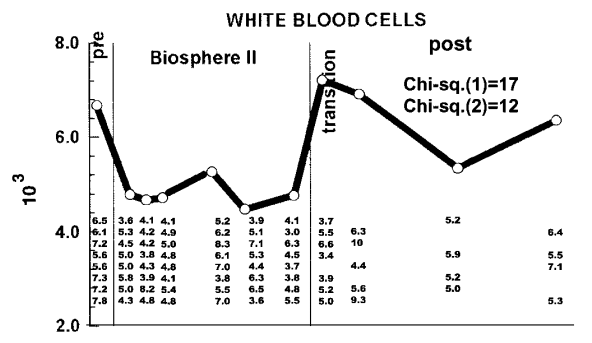
Because calorie restriction reduced WBCs from ~6.8 to 4.6, should 4.6 be considered optimal? In support of this idea, calorie restriction is well documented to increase lifespan in a variety of organisms, including flies, worms, and rodents. Although there isn’t any evidence (yet) on the long-term effects of calorie restriction (CR) on lifespan in people, it has been shown to be protective against age-related diseases, including abdominal obesity, diabetes, hypertension, and cardiovascular disease (Omodei and Fontana 2011). Therefore, a reduced WBC level may be related to the positive health-related effects of CR.
As an argument against using the CR-mediated reduction in WBC as a guide for what the optimal range should be, calorically-restricted mice have a decreased survival in response to infection (Goldberg et al. 2015):

However, it’s important to note that infection-related survival was decreased in CR mice that were 40% restricted in terms of daily calories. Based on the Biosphere 2 data above, BMI was reduced from ~23 to 19, which translates into a 17% reduction. However, whether 17% CR is better for improving infection-related survival compared with 40% CR is currently unknown.
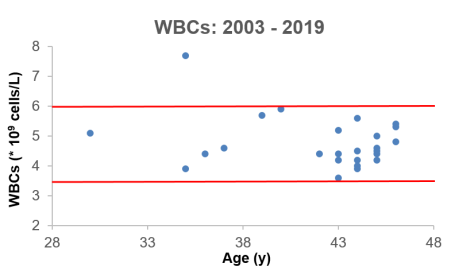
What’s my WBC level? Shown below is my WBC data for the past 16 years, including 25 measurements (average WBCs, 4.78 * 10^9 cells/L). The 2 red lines delineate the 3.5 – 6 range that was associated with an increased lifespan in the BLSA study (Ruggiero et al. 2007), and based on that, I’ve only had 1 measurement that was higher than that range.
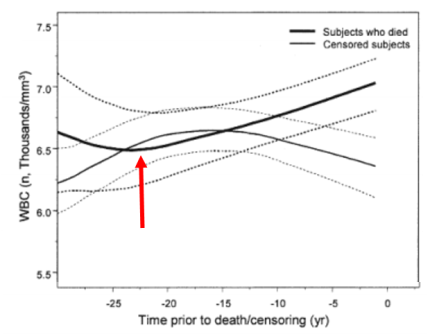
Starting from the red arrow below, WBCs increase during the 22-year period that precedes death (Ruggiero et al. 2007), so making sure that they don’t go up during aging is important!
If you’re interested, please have a look at my book!
References
Ahmadi-Abhari S, Luben RN, Wareham NJ, Khaw KT. Seventeen year risk of all-cause and cause-specific mortality associated with C-reactive protein, fibrinogen and leukocyte count in men and women: the EPIC-Norfolk study. Eur J Epidemiol. 2013 Jul;28(7):541-50.
Goldberg EL, Romero-Aleshire MJ, Renkema KR, Ventevogel MS, Chew WM, Uhrlaub JL, Smithey MJ, Limesand KH, Sempowski GD, Brooks HL, Nikolich-Žugich J. Lifespan-extending caloric restriction or mTOR inhibition impair adaptive immunity of old mice by distinct mechanisms. Aging Cell. 2015 Feb;14(1):130-8.
Jee SH, Park JY, Kim HS, Lee TY, Samet JM. White blood cell count and risk for all-cause, cardiovascular, and cancer mortality in a cohort of Koreans. Am J Epidemiol. 2005 Dec 1;162(11):1062-9.
Omodei D, Fontana L. Calorie restriction and prevention of age-associated chronic disease. FEBS Lett. 2011 Jun 6;585(11):1537-42.
Ruggiero C, Metter EJ, Cherubini A, Maggio M, Sen R, Najjar SS, Windham GB, Ble A, Senin U, Ferrucci L. White blood cell count and mortality in the Baltimore Longitudinal Study of Aging. J Am Coll Cardiol. 2007 May 8;49(18):1841-50.
Walford RL, Mock D, Verdery R, MacCallum T. Calorie restriction in biosphere 2: alterations in physiologic, hematologic, hormonal, and biochemical parameters in humans restricted for a 2-year period. J Gerontol A Biol Sci Med Sci. 2002 Jun;57(6):B211-24.
Weijenberg MP, Feskens EJ, Kromhout D. White blood cell count and the risk of coronary heart disease and all-cause mortality in elderly men. Arterioscler Thromb Vasc Biol. 1996 Apr;16(4):499-503.

Great post. Any update on your levels recently in response to dietary changes?
LikeLike
Hey JR, I’ve measured my blood biomarkers in August and Dec 2016, and January 2017. I’ll probably measure again sometime in Feb 2017, too. The good news is that since I simultaneously track my nutrition, I finally have enough data where I can see the effect of various nutrients on my circulating biomarkers.
I’m trying to reduce my liver enzymes, and I’ve tried various dietary interventions in those 3 measurements. I don’t have any news for that yet (it’s not from too much fructose, green tea, or Vitamin A), but I’m working on it!
LikeLike
My latest WBC count is 3.9. Lab says this is too low, the BLSA study suggests otherwise. I’m 43.
LikeLike
3.9 is close to ideal (imo, based on the BLSA data), but more important are the differentials-how many neutrophils, lymphocytes, monocytes do you have?
LikeLike
Neutrophils 1.45 Giga/L [37.7%]
Lymphocytes 1.91 [49.6%]
Monocytes 0.37 [9.6%]
Eosinophils 0.10 [2.6%]
Basophils 0.02 [0.5%]
LikeLiked by 1 person
Not bad at all! My reading of the literature is that 1500-2000 for neutrophils is optimal, and >1500 for lympocytes. So you’re right there! Just make sure that your neutrophils don’t decrease further. Note that in the BLSA study, neutrophils increase, whereas lymphocytes decrease during aging. So that’s to watch out for.
LikeLike
A few months ago I rather dramatically cut back on my meat consumption, and my theory is that doing so may have caused my Vitamin B12 levels to tank, which may have caused the decrease in neutrophils. I did not test my B12 levels so I cannot be sure but neutropenia has been linked to Vitamin B12 inadequacy. Then again, I’m still very far from being a vegan (I still eat at least 3 oz of meat/fish on a typical day, although I have regularly had meatless days too), so a frank B12 deficiency isn’t likely.
LikeLiked by 1 person
Hello Michael, I really enjoyed your video and found all of the information very informative. I am planning to buy your book and will share your blog with my friends/family. I have a question for you and am looking for a little bit of guidance. I really liked using testing/biomarkers to track my personal health and as a guide to improve healthy eating. What personal “biomarker” testing service or services do you recommend; not sure what is a affordable/reliable “biomarker” testing service……..would appreciate any guidance you could offer…….good luck to you and your research.
LikeLike
Hey Pedro, thanks! I wouldn’t say I recommend any biomarker testing service, as I’m not being paid for that. However, I can tell you what I use, which is the CBC test from lef.org:
http://www.lifeextension.com/Vitamins-Supplements/itemLC381822/Chemistry-Panel-Complete-Blood-Count-CBC-Blood-Test
LikeLike