
It could go either way for Tesla in Q2 2019 to generate a profit or a loss. Let’s have a look at the data!
By now, almost everyone knows that Tesla had a record quarter for deliveries (95,220), including 17,650 Model S+X, and 77,550 Model 3’s. More importantly, Tesla decreased its inventory during Q2 2019, an important finding because in the last 5 quarters, when Tesla reduces its inventory, net income was positive. Here are the production, deliveries, and inventory data since Q1 2018:

For example, in Q3 and Q4 2018, Tesla reduced its inventory by 3,358 and 4,145 cars, respectively, and reported positive net income for both quarters. In contrast, during Q1 and Q2 2018, and Q1 2019, inventory increased by 4,497, 12,571, and 14,100 cars, and Tesla reported a net loss of more than $700 million in each of those quarters. When inventory increases, the costs for producing these cars accumulate in the absence of any revenue. In contrast, when inventory is reduced, no cost to produce the cars occurs, and additional revenue is generated. The importance of the reduction in inventory will become more apparent a bit later, when I’ll estimate the Q2 2019 gross margin.
In terms of total revenue, the first step is to calculate the automotive sales revenue. First, it’s important to know what the average selling price (ASP) is for Tesla’s cars. For S+X sales, I’ve estimated a $100,000 ASP. In contrast, the ASP for the Model 3 is a bit more complicated. As shown below, the ASP for the Model 3 has fluctuated greatly over the past 5 quarters, from $46,500, to $48,000, to $55,700, to $52,500, and $45,200 in Q1 2019:
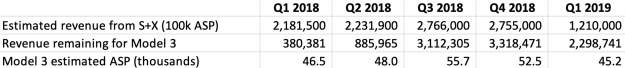
At worst, I’ll assume an ASP for the Model 3 of $45,200 for the current quarter. However, it may be much higher. Conservatively, in a best-case scenario, I’ll assume $48,000. These ASPs yield a total automotive sales revenue of either $5.27 and $5.49 billion: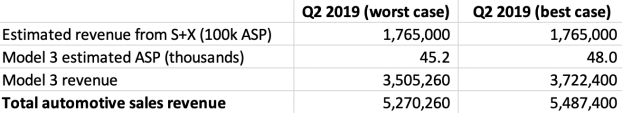
Now onto total revenues, which consists of automotive sales and leasing, energy generation and storage, services and other. These categories have been relatively stable over the past 5 quarters, so I used their respective 5-quarter average values to estimate their Q2 2019 amounts. Based on these data, in worst- and best-case scenarios, Tesla generated $6.24 and $6.47 billion in total revenue:

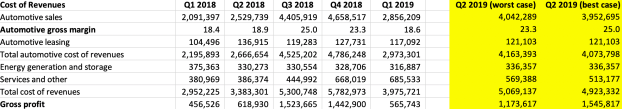
What about the cost of generating these revenues? One of the most important factors is the automotive gross margin. In quarters (Q3, Q4 2018) where Tesla reduced its inventory, automotive gross margins were 23.3% and 25%, whereas in the 3 quarters (Q2 and Q2 2018, Q1 2019) where inventory increased, gross margins were 18.4%, 18.9%, and 18.6%. Because of the inventory-gross margin association, I’ll assume that in Q2 2019, gross margins will be at worst, 23.3%, and at best, 25%. Based on these data, the cost of revenues for automotive sales is $4.042 billion at worst, and $3.953 at best.
Moreover, over the past 5 quarters, the cost of revenues for automotive leasing and energy generation and storage hasn’t fluctuated much, so I used the 5-quarter average for Q2 2019. However, services and other costs have spiked during the past 2 quarters. For a worst-case scenario, I used the difference obtained from subtracting the revenue vs cost of revenue for services and other, $190 million (obtained during Q1 2019), thereby yielding a Q2 2019 value of $569 million. For a best-case scenario, I used the 5-quarter average value, thereby yielding $513 million. I then summed all the costs of these revenues, and obtained the gross profit by subtracting the cost of revenues from total revenues. This yields $1.174 billion at worst, and $1.546 billion at best, for gross profit:
Investigating further, operating expenses (OpEx) are next. OpEx costs have been relatively stable over the past 5 quarters:
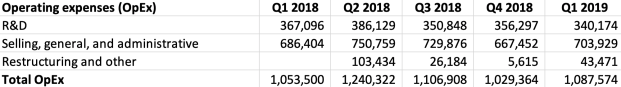
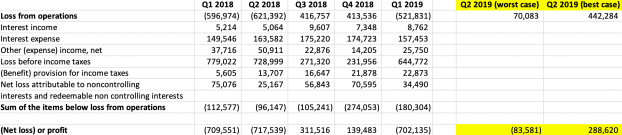
Accordingly, I used the average, 5-quarter OpEx value, $1.104 billion for Q2 2019. Subtracting that from gross profit yields a Q2 2019 loss from operations of $70 million at worst, whereas in the best case, it is $442 million.
Additional costs include interest income or expense, other net income or expense, benefit or provision for income taxes, and net losses attributable to non-controlling interests and redeemable non-controlling interests. I then subtracted the 5-quarter average for the sum of these values (-$153,664 million) from the loss from operations values to obtain the net loss (or gain) attributable to common shareholders, which is the gross profit (or loss). At worst, Tesla may report a -$84 million loss, whereas at best, they may report a $288 million profit:
So which will come true? Key factors are the Model 3 ASP, gross margins, and decreasing the cost of services losses. I’m leaning towards Tesla achieving the best case scenario…We’ll find out tomorrow!
