Category Archives: Nutrient Comparisons

Blood Testing: MCV, RDW. What’s Optimal for Health and Longevity?

Most often overlooked on a standard blood test are the mean corpuscular volume (MCW) and Red Blood Cell Distribution Width (RDW). How do they change during aging, and what’s associated with all-cause mortality risk? Also, with the goal of optimizing MCV and RDW, how does my diet correlate with these biomarkers?

Advertisement

Optimizing Biological Age-Lifespan.io Presentation

In the first 45 minutes, discuss each of the biomarkers contained within Levine’s Biological Age calculator, Phenotypic Age.

After that, I answer questions from the audience and we discuss all things related to aging.

https://www.youtube.com/watch?v=8hs2n7U7J-k&t=30s

12-16 Years Younger Than My Chronological Age: What’s My Diet?

My average biological age in 2019 is 12 years younger than my chronological age (46y) based on the Phenotypic Age calculator (https://michaellustgarten.wordpress.com/2019/11/01/biological-age-31-3y-chronological-age-46y/), and 16y younger based on aging.ai (https://michaellustgarten.wordpress.com/2019/11/04/years-of-biological-aging-in-the-past-4-years/). One factor that likely contributes to my relatively youthful biological age is my diet.

Shown below is my average daily dietary intake from January 1 through November 7th, 2019 (n=306 days). I weigh all of my food with a food scale, so these aren’t estimated amounts:

Screen Shot 2019-11-10 at 10.15.49 AM.png

In terms of weight (or volume), green tea is atop the list, as I drink 20 oz/day. Carrots come in second place (for why, see https://michaellustgarten.wordpress.com/2018/07/06/serum-albumin-and-acm/), followed by strawberries, red bell peppers, bananas, watermelon (for the lycopene), cauliflower, blueberries, blackberries, and raspberries. Note that I mix the bananas and berries in my green smoothies, which I drink 3-4x/week, which includes spinach (#11) and parsley (#23).

What does my average daily macro- and micro-nutrient data look like for 2019?

Screen Shot 2019-11-10 at 10.33.03 AM

Note that I purposefully have higher than the RDA values for several nutrients, including Vitamin C (see https://michaellustgarten.wordpress.com/2019/09/19/vitamin-c-dietary-intake-and-plasma-values-whats-optimal-for-health/), Vitamin K (see https://michaellustgarten.wordpress.com/2015/05/08/eat-more-green-leafy-vegetables-reduce-mortality-risk/), selenium (see https://michaellustgarten.wordpress.com/2015/05/28/selenium-dietary-intake-and-plasma-values-whats-optimal-for-health/), and others (see michaellustgarten.com).

In terms of supplements, I use 1000 IU of vitamin D from November – May, and I take a methylfolate-methylB12-B6 supplement, to help keep my homocysteine levels low.

If you’re interested, please have a look at my book!

100 Days Of Dietary Data

I’ve posted individual dietary days as an example of what and how much I eat (https://michaellustgarten.wordpress.com/2015/12/31/130-grams-of-fiber-2400-calories/). However, a few days of examples may not represent the whole dietary picture. To address this, below is my average nutrient intake for the past 100 days (from October 24, 2018-Feb 5 2019):

100 days of nutrition.png

Notice that my average values for many of these variables (i.e. potassium, selenium, Vitamin C, Vitamin K, etc.) are way above the RDA. For more info on that, I have several blog posts that explain the “why” behind that. Where am I getting those nutrients from? Shown below are 100-day averages for my food intake, ranked in order from most consumed (in grams, or ounces, if it’s a drink) to least:

100 days of foods.png

During the past 100 days, my top 5 foods in terms of daily intake include carrots, strawberries, red peppers, watermelon, and cauliflower. Scroll through the list to see how much I average on a daily basis for each food!

Please have a look at my book, if you’re interested!

130 grams of fiber, 2400 calories

How do I eat ~100 grams of fiber, on average, every day? Here’s my full dietary breakdown from December 30, 2015:

my diet 12-30.png

Green tea is associated with reduced all-cause mortality risk (https://michaellustgarten.wordpress.com/2015/10/20/drink-green-tea-reduce-and-all-cause-mortality-risk/), so I start every day with  green tea + lemon.

Then, I ate a giant salad (https://michaellustgarten.wordpress.com/2015/10/09/what-i-eat-giant-salad/), consisting of pickles, lettuce, tomato, purple cabbage and corn, and topped with a blended dressing of fresh lemon, sesame seeds, cumin, jalapeño, and raw garlic.

Also on the list were sardines, which I eat every day. Snacks in between bigger meals were carrots, 1 whole red pepper, mushrooms, and a Brazil nut.

Then I ate a big bowl of broccoli topped with cherry tomatoes. I added mustard powder after the broccoli and tomatoes were done cooking (~10 minutes), because broccoli’s sulfurophane content decreases with cooking time (https://michaellustgarten.wordpress.com/2014/08/13/restoring-boiling-induced-sulfurophane-depletion-in-broccoli-with-mustard-powder/).

At some point after that I had cod liver oil, to get my daily dose of Vitamin D and the fish oil fatty acids, EPA and DHA. I just (last week) sent my blood for analysis of my circulating Vitamin D, so I may need to increase my vitamin D intake based on what the result shows.

Next I had my beet-berry smoothie (https://atomic-temporary-71218033.wpcomstaging.com/2015/08/09/beet-berry-smoothie/).

For dinner I had my barley-veggie mix (https://michaellustgarten.wordpress.com/2015/10/08/what-i-eat-barley-cauliflower-collard-tomato-celery-onion-corn-mix/), including barley, cauliflower, celery, tomato, corn, collards, onions and olive oil. Also, with an orange for dessert!

In sum, 2400 calories, 130 grams of dietary fiber, and maximal nutrition!

fiber 130

7/2017 Update: When considering the link between linoleic acid and all-cause mortality (https://michaellustgarten.wordpress.com/2015/12/20/the-essential-fatty-acid-linoleic-acid-dietary-intake-and-circulating-values-whats-optimal-for-health/), Ive increased my intake of omega-6 fats, almost exclusively from walnuts, while cutting my carbohydrate intake to try to stay calorie neutral. In doing so, this change increased my HDL from 28 to ~50, while keeping my total cholesterol < 150, and LDL < 70.

If you’re interested, please have a look at my book!

Think Your Diet Is Paleo? Not If Your Potassium Intake Is Less Than…

The stereotype about the Paleo diet is that it is meat heavy. How much meat Paleo era-eaters ate is debatable, but that they consumed large amounts of potassium rich, plant-based foods is not! When examining 159 Stone Age diets, the average daily potassium intake has been reported to be 400 meq/day (Sebastian et al. 2006), as shown below:

potass

How much is 400 meq in milligrams (mg) of potassium? 1 meq = 39.1 mg of potassium, so to figure that out we multiply 400 *39.1, thereby yielding an average daily potassium intake of 15,640 mg/day! It’s important to note that this value is based on a 3000 calorie diet (Eaton et al. 1997). Dividing 15,640/3000 yields 5.21 mg potassium/calorie.

In contrast, as studied in 12,581 US adults, the average dietary potassium intake has been reported to be only ~2600 mg/day (Cogswell et al. 2012). Furthermore, only 1.4% of all subjects had potassium values greater than 4700 mg/day!

What’s my potassium intake? Shown below is my 7-day average intake from 8/29/2015-9/4/2015. The black rectangle in the lower right corner shows my average daily potassium intake to be 10,383 mg/day.

my potass

My average daily calorie intake during that week was 2193. In terms of mg potassium/calorie, my value is 4.73 (10,383/2193), which isn’t far from the reported average Paleo value. What’s yours?

For reference, shown below is a representative day during that week (Wednesday, September 2; 2251 calories) for what I ate.

my intake

If you’re interested, please have a look at my book!

References

Cogswell ME, Zhang Z, Carriquiry AL, Gunn JP, Kuklina EV, Saydah SH, Yang Q, Moshfegh AJ. Sodium and potassium intakes among US adults: NHANES 2003-2008. Am J Clin Nutr. 2012 Sep;96(3):647-57.

Eaton SB, Eaton SB 3rd, Konner MJ. Paleolithic nutrition revisited: A twelve-year retrospective on its nature and implications. Eur J Clin Nutr. 1997 Apr;51(4):207-16.

Sebastian A, Frassetto LA, Sellmeyer DE, Morris RC Jr. The evolution-informed optimal dietary potassium intake of human beings greatly exceeds current and recommended intakesSemin Nephrol. 2006 Nov;26(6):447-53.

If Your Goal Is Optimal Nutrition, Which Is Better, Carrots Or Sweet (Orange) Potatoes?

If your goal is optimal nutrition, which orange root vegetable would you choose, carrots or sweet potatoes? 100 calories from carrots vs. 100 calories from sweet potatoes, let’s have a look!

First, to get 100 calories you can eat almost double the amount of carrots, 245g compared with 111g of a baked sweet potato. Protein and carbohydrate are about the same, whereas there is marginally more fat in carrots. However, for the same amount of calories, carrots have almost double the fiber! Fiber feed gut bacteria, which may be involved in lifespan (https://atomic-temporary-71218033.wpcomstaging.com/2014/07/16/are-the-bacteria-in-our-intestines-involved-in-mechanisms-underlying-health-and-lifespan/), so I’m all for that!

carr pot1

What about vitamin content? For the 17 Vitamins below, carrots have higher values for 10 of them, whereas sweet potatoes have higher values for only 3 vitamins. It’s important to note that for the same amount of calories, carrots have almost double the Vitamin A and beta-carotene,  17+ fold more alpha-carotene, and contain lutein+xeaxanthin (whereas sweet potatoes don’t have any!).

vitam

What about mineral content? For the 10 minerals shown in the below, raw carrots are better than sweet potato for 5 minerals, whereas sweet potato leads for 4 mineral categories. However, sweet potato is barely better for some, like magnesium, iron and copper, by 1 milligram, 0.1 and 0.1 milligrams, respectively.

miner

Carrots also contain flavanoids, including flavones (luteolin) and flavanols (kaempferol, myricetin, quercetin), whereas these metabolites are absent in sweet potatoes. An increased flavanoid intake in older adults is associated with reduced all-cause mortality risk (Ivey et al. 2015):

flav mort

So, based on energy and nutrient density (you can eat more carrots, and carrots have far more nutrition than sweet potatoes, for the same amount of calories), I would choose carrots over sweet potatoes. However, as an argument against this, Okinawans, who have one of the highest life expectancies in the world (shown below) consume more than half of the their calories from sweet potatoes (Wilcox and Wilcox 2014). Maybe carrots being better than sweet potatoes doesn’t matter? Or maybe the Okinawans would have slightly better health if they got a similar amount of calories from carrots instead?

okin

Interestingly, vegetables and fruits comprise the base of the Okinawan food pyramid (shown below; Wilcox et al. 2009), which I’ve suggested is both evolutionary accurate (https://atomic-temporary-71218033.wpcomstaging.com/2015/07/17/on-a-paleo-diet-not-if-you-fiber-intake-is-less-than/) and is optimal for maximizing nutrient density (https://atomic-temporary-71218033.wpcomstaging.com/2015/06/03/in-search-of-optimal-nutrient-density-veggies-or-whole-grains/).

okinawan food pyramid

So the take home here is that while carrots are better, it looks like you can’t go wrong eating either carrots or sweet potatoes!

If you’re interested, please have a look at my book!

References

Nutrition info (including flavanoid content) via ndb.nal.usda.gov

Ivey KL, Hodgson JM, Croft KD, Lewis JR, Prince RL. Flavonoid intake and all-cause mortality. Am J Clin Nutr. 2015 May;101(5):1012-20.

Murphy MM, Douglass JS, Birkett A. Resistant starch intakes in the United States. J Am Diet Assoc. 2008 Jan;108(1):67-78. Erratum in: J Am Diet Assoc. 2008 May;108(5):890.

Willcox DC, Willcox BJ, Todoriki H, Suzuki M. The Okinawan diet: health implications of a low-calorie, nutrient-dense, antioxidant-rich dietary pattern low in glycemic load. J Am Coll Nutr. 2009 Aug;28 Suppl:500S-516S.

Willcox BJ, Willcox DC. Caloric restriction, caloric restriction mimetics, and healthy aging in Okinawa: controversies and clinical implications. Curr Opin Clin Nutr Metab Care. 2014 Jan;17(1):51-8.

On a Paleo Diet? Not if your fiber intake is less than…

Do you think Paleo diets involve eating mostly meat? While how much meat was eaten in that era is debatable, what is known is that they ate a lot of high-fiber fruits and vegetables. Shown below are the estimated daily fiber and energy intake (Eaton et al. 1997). On a 3000 calorie diet it’s estimated that those who lived in the Paleo era consumed 104 g fiber/day. That translates into 3.3 g fiber per 100 calories.

paleo fiber

Do you consider yourself a Paleo eater? If so, do you get that much fiber? For example, I average 2200 calories per day. Based on the estimated Paleo fiber intake of 3.3g fiber/100 calories, I should average 66g or more dietary fiber per day. As shown below, my 7-day average for fiber intake is 94g/day.

myfiber

If you’re interested, please have a look at my book!

Reference:

Eaton SB, Eaton SB 3rd, Konner MJ. Paleolithic nutrition revisited: A twelve-year retrospective on its nature and implications. Eur J Clin Nutr. 1997 Apr;51(4):207-16.

In search of optimal nutrient density: veggies or whole grains?

In previous articles I’ve written about the heath benefits of eating whole grains, which have been shown in large epidemiological studies to be associated with reduced all-cause mortality risk. Based on this data, the USDA’s MyPlate recommends a minimum of 3.5 oz, up to 7 oz. of whole grains on a 2200 calorie diet. 3.5 servings of barley yields 350 calories, whereas 7 oz. yields 700. In terms of percentage of total calories, MyPlate recommends that 16-32% of daily calories should come from whole grains.

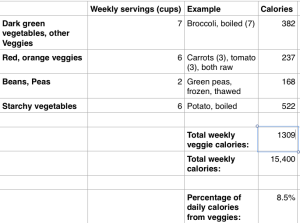
In terms of vegetables, MyPlate’s recommendations are shown below. They recommend 3 servings of vegetables per day, with these amounts varied between green vegetables (and other vegetables), red and orange vegetables, beans and peas, and starchy vegetables. For ease of calculation I grouped ‘other vegetables’ with green vegetables. Based on the recommended weekly servings for each group and representative foods, I calculated weekly calorie amounts for each group. Average veggie calories per day = 187. Divided by 2200 calories, that equals 8.5% of total calories.

myplate

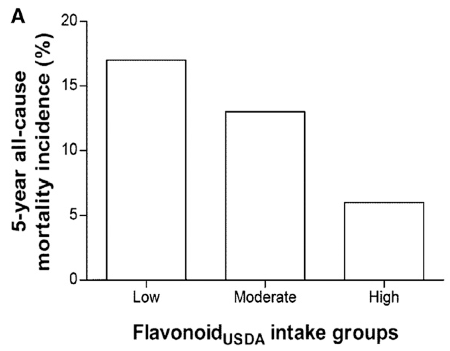
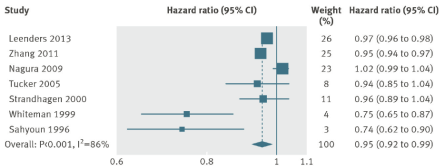
So clearly MyPlate wants us to eat between 2-4 fold more whole grains than veggies, in terms of total daily calories, but why is that? In a meta-analysis of 7 studies including 660,186 subjects, increased vegetable consumption is also associated with reduced mortality risk, as shown below:

veg mortality

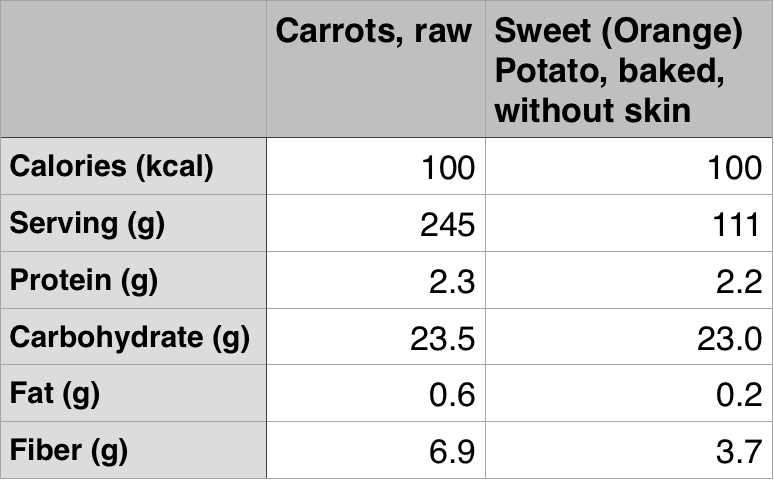
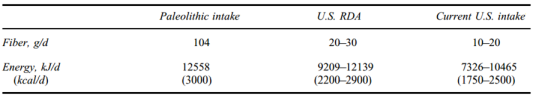
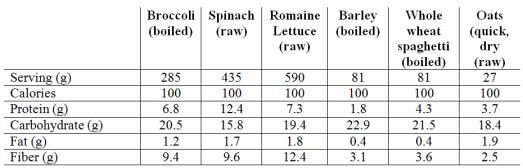
Maybe whole grains are superior to veggies in terms of nutrient density? To see if that’s true, in the Table below I compared the nutrient composition of broccoli, spinach and romaine lettuce against barley (the king of grains for fiber), whole wheat spaghetti and oats. How do they compare in terms of macronutrients, when each has 100 calories? First, it should be obvious that to get 100 calories of veggies (see the serving column), you will eat significantly more food. To most, this will seem like a bad thing. But more chewing for the same amount of calories may end up in eating less, an important fact because of the worldwide explosion in obesity rates. Second, each of these veggies have 2-3 fold more protein and 3-4 fold more fiber than than whole grains. So far, veggies are far superior to whole grains.

vegc1

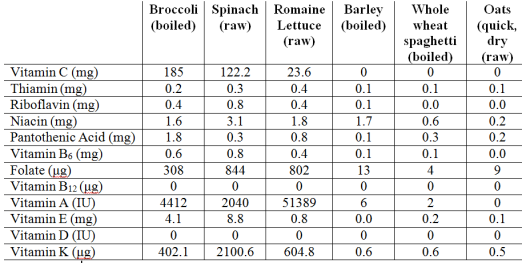
What about vitamin content? As shown below, veggies crush whole grains for vitamin content. Whole grains are not better than veggies in terms of vitamin content for any category.

vegc vitamins

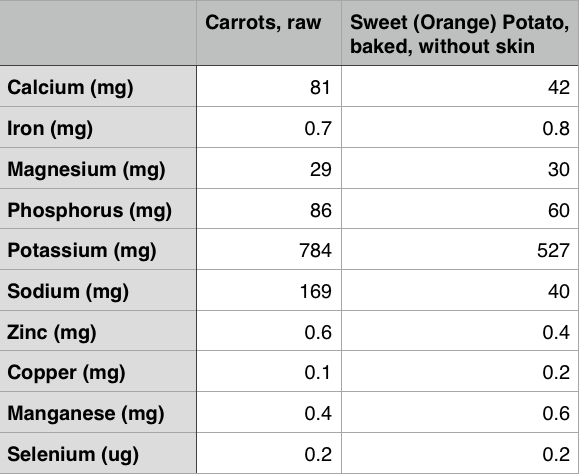
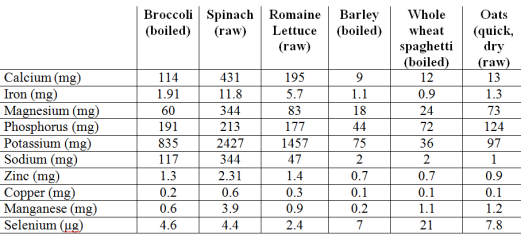
Maybe mineral content is better in whole grains? As shown below, they’re not. Veggies are much better in 9/10 mineral categories, with whole grains having marginally more selenium than veggies.

vegc miner

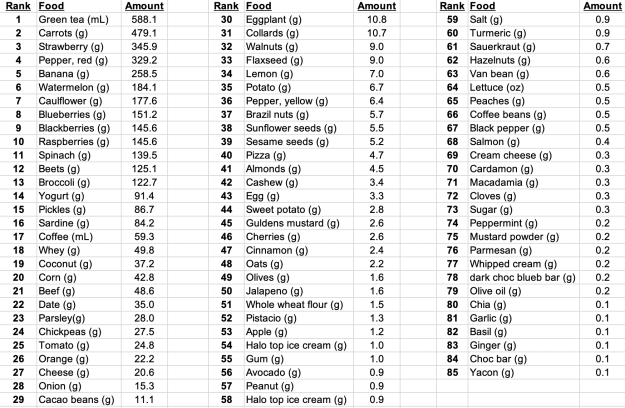
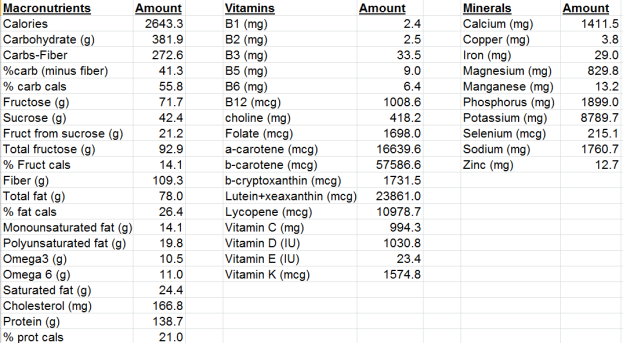
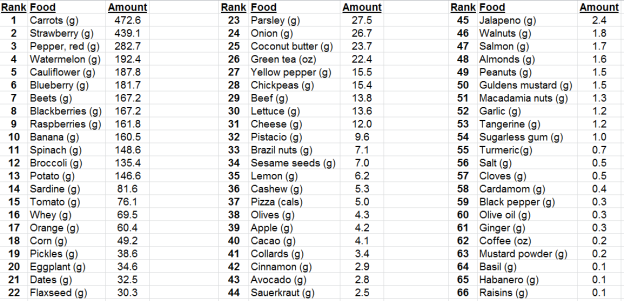
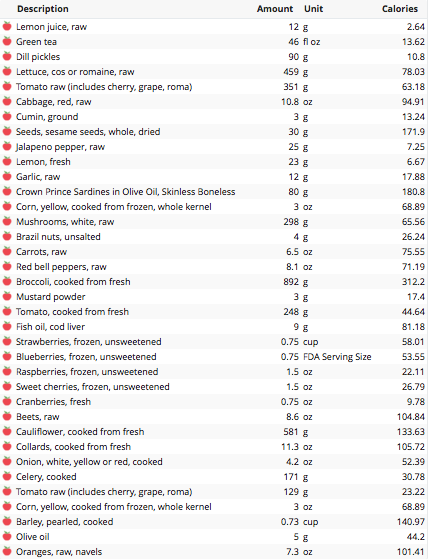
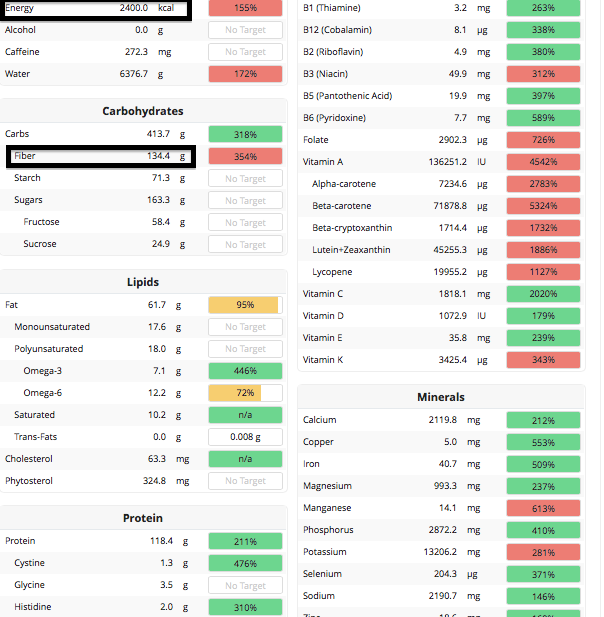
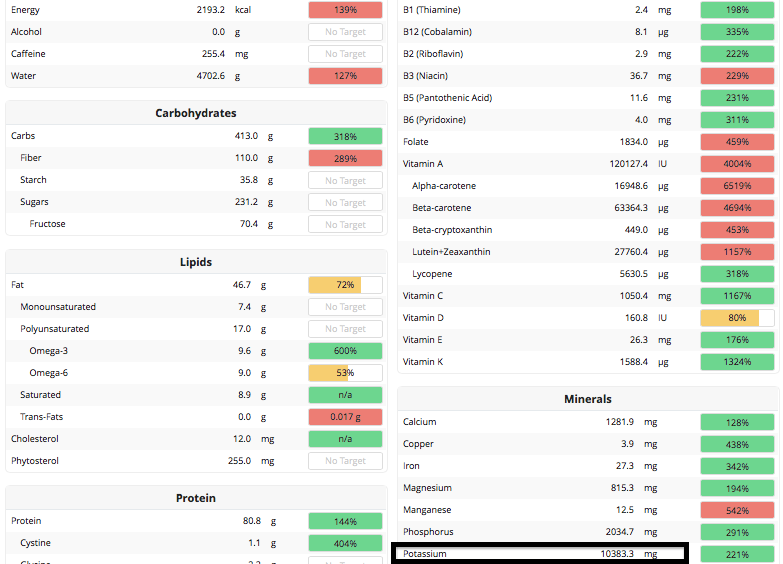
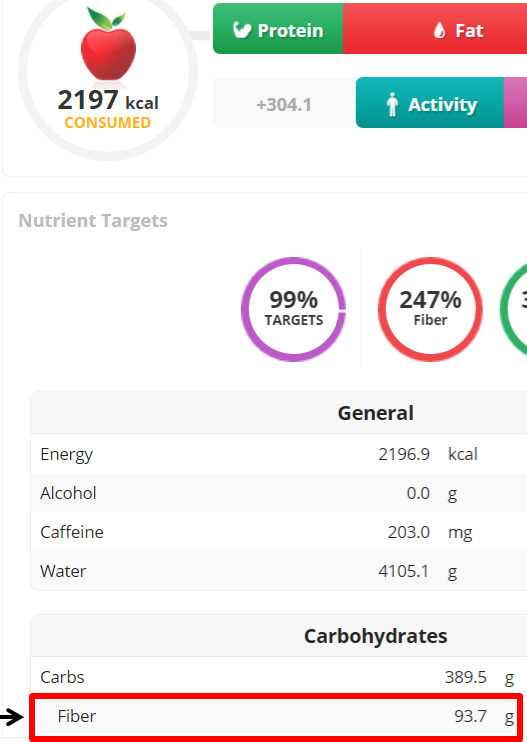
Based on these data, I have now dramatically increased my daily vegetable intake, while reducing my whole grain intake. Shown below is a snapshot of today’s veggie (and some other foods, too) intake, and it’s also important to mention that this amount is now representative of my daily vegetable intake. I haven’t eliminated whole grains, only minimized them.

veggies cal

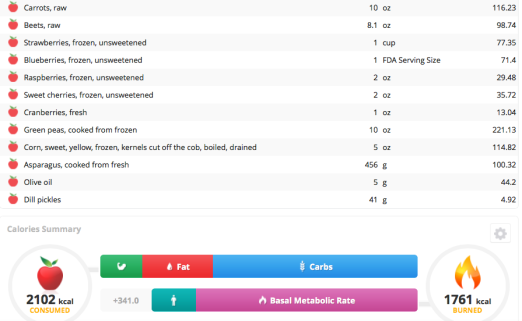
My total veggie intake between carrots, beets, green peas, corn, asparagus and 1 pickle spear is 50.6 oz, or 1416 grams. Considering that 1 serving of vegetables = 80g, I ate 17.7 servings of veggies today. That amount is almost equal to what MyPlate recommends to eat in 1 week!

If you’re interested, please have a look at my book!

References:

Nutrition data from ndb.nal.usda.gov

Wang X, Ouyang Y, Liu J, Zhu M, Zhao G, Bao W, Hu FB. Fruit and vegetable consumption and mortality from all causescardiovascular disease, and cancersystematic review and dose-response meta-analysis of prospective cohort studiesBMJ. 2014 Jul 29;349:g4490.

Leucine inhibits myostatin-which foods are rich in leucine?

In a previous article I wrote about the effect of epicatechin on reducing myostatin, which may increase muscle mass (https://atomic-temporary-71218033.wpcomstaging.com/2015/02/02/inhibit-myostatin-with-chocolate-increase-muscle-mass/). Are there any other ways to inhibit myostatin with the goal of increasing muscle mass?

10 grams of essential amino acids have been shown to reduce myostatin levels in skeletal muscle (Drummond et al. 2009). Because essential amino acids are found in high amounts in animal protein-containing foods, the answer to decrease myostatin would be to eat more protein, right?

Not so fast, because high protein diets (~20% of total calories), especially from animal sources are associated with an increased all-cause mortality risk in people younger than 65 years when compared with those eating a low protein diet (~10% of total calories; Levine et al. 2014). Fortunately, it isn’t just a bolus of essential amino acids that inhibits myostatin. Addition of the essential amino acid leucine to muscle cells inhibits myostatin expression, causing them to grow (Chen et al. 2013). If your goal is to maximize muscle mass but also, optimal health, what daily intake of leucine should you aim for while keeping your total protein intake low?

It has been reported that a leucine intake of 45 mg/kg/day (or more) may be required by athletes to maximize muscle protein synthesis (Mero 1999). For a 70 kg person, this translates into 3.15g of leucine per day (45 mg*70kg=3150mg, = 3.15g). Shown below is my 7-day average (5/21/2015-5/28/2015) protein intake. From the chart, my average daily leucine intake is 3.2 g. However, the nutrient tracking software that I use for some reason includes the total protein amount from my daily can of sardines but not its constituent amino acids. I used ndb.nal.usda.gov to get that info: 1 can of sardines has 1.6 g of leucine. In total, my daily leucine intake is 4.8 g/day. My body weight is currently at 69.1 kgs. These values put me at 70 mg leucine/kg body weight/day (70 * 69.1kg = 4837 mg, = 4.8 g), which is well above the 45 mg/kg/day value above.

leu

So which foods are rich in leucine? Below I’ve ranked foods based on their leucine content (in grams) divided by total calories. Egg whites and cod fish are the all-stars for leucine content per calorie. Chicken and beef are relatively good sources of leucine. Although spinach is better than skim milk when comparing its leucine/calorie content, none of the vegetables or beans come close to the leucine/calorie content found in egg whites or cod fish.

leucine calorie

If you’re interested, please have a look at my book!

References:

Chen X, Huang Z, Chen D, Yang T, Liu G.MicroRNA-27a is induced by leucine and contributes to leucine-induced proliferation promotion in C2C12 cells. Int J Mol Sci. 2013 Jul 8;14(7):14076-84.

Drummond MJ, Glynn EL, Fry CS, Dhanani S, Volpi E, Rasmussen BB. Essential amino acids increase microRNA-499, -208b, and -23a and downregulate myostatin and myocyte enhancer factor 2C mRNA expression in human skeletal muscle. J Nutr. 2009 Dec;139(12):2279-84.

Levine ME, Suarez JA, Brandhorst S, Balasubramanian P, Cheng CW, Madia F, Fontana L, Mirisola MG, Guevara-Aguirre J, Wan J, Passarino G, Kennedy BK, Wei M, Cohen P, Crimmins EM, Longo VD. Low protein intake is associated with a major reduction in IGF-1, cancer, and overall mortality in the 65 and younger but not older population. Cell Metab. 2014 Mar 4;19(3):407-17.

Mero A. Leucine supplementation and intensive training. Sports Med. 1999 Jun;27(6):347-58