One of the goals of my exercise program is to reduce my resting heart rate (RHR). A stronger heart beats less times per minute, but pumps more blood per beat. In contrast, a weaker heart beats more times per minute, but less blood per beat.
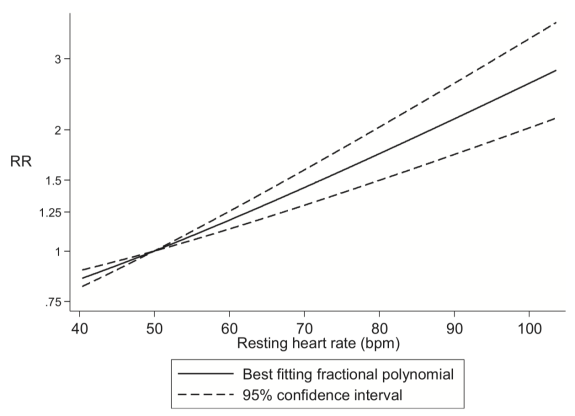
Is there an optimal level for RHR? Based on a meta-analysis of 59 studies that included 1,810,695 subjects, RHR values < 50 beats per minute (bpm) are associated with maximally reduced risk of death from all causes. Conversely, RHR values > 50 bpm are associated with a higher mortality risk (Aune et al. 2017):
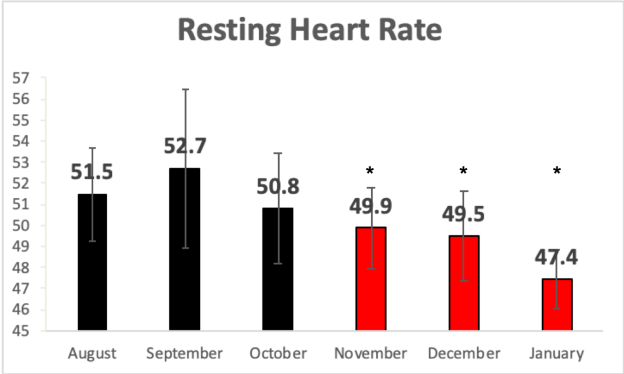
What’s my resting heart rate? Shown below is that data, tracked by WHOOP since August. Note that my RHR wasn’t significantly different from August until October, ranging from 51-53 bpm (average, 51.7). However, because I was tracking my RHR, I noticed that I was overtraining, leading to very high HRs, lower heart rate variability, and less deep sleep (topics for another post!) the day(s) after exercise. So early in November, I changed my exercise routine. As a result, from November until the end of January, my average RHR (49.7 bpm) has been significantly less (p-value =1E-10), and based on January’s average RHR, I’m trending closer to 47 bpm! Also note that * = significantly different when compared with August.
What did I change in my exercise program? Since I’ve been in Boston (~9 years), I’ve walked 15-20 miles per week: it’s 1.1 miles to and from work, plus at least an hour of walking on Saturdays and Sundays. That’s a constant that hasn’t changed. In contrast, I split my 3-day weight training routine, which totaled ~5-6 hours/week into 3-5 days at less than an hour each session, and at a lower intensity with more reps. My strength is still as good as it was before, and as a result, my recovery HRs aren’t as high, thereby leading to a lower average RHR over time,. I’ve been training like that consistently for the past 30 years, but it took wearing a fitness tracker to change it!
Reference
Aune D, Sen A, ó’Hartaigh B, Janszky I, Romundstad PR, Tonstad S, Vatten LJ. Resting heart rate and the risk of cardiovascular disease, total cancer, and all-cause mortality – A systematic review and dose-response meta-analysis of prospective studies. Nutr Metab Cardiovasc Dis. 2017 Jun;27(6):504-517.
If you’re interested in living longer and healthier, please have a look at my book!
 Continue reading