Category Archives: Inflammation

Attempting To Further Reduce Biological Age: hs-CRP

Join us on Patreon! https://www.patreon.com/MichaelLustgartenPhD

Levine’s Biological age calculator is embedded as an Excel file in this link: https://michaellustgarten.wordpress.com/2019/09/09/quantifying-biological-age/

Papers referenced in the video:

The baseline levels and risk factors for high-sensitive C-reactive protein in Chinese healthy population https://immunityageing.biomedcentral.com/articles/10.1186/s12979-018-0126-7

Commonly used clinical chemistry tests as mortality predictors: Results from two large cohort studies https://pubmed.ncbi.nlm.nih.gov/33152050/

Advertisement

HDL Update: Age-Related Changes, All-Cause Mortality Risk, And Progress Towards The Optimal Range

In November 2020, I made a HDL video based on a meta-analysis in ~3.4 million subjects that was published in July 2020. In Dec 2020, a larger study (n=15.8 million subjects) was published-those data are presented in the video, and compared against the meta-analysis.

In addition, I’ve tested my HDL 2 more times since November 2020, so how’s my progress for getting it into the optimal range? Also, I attempt to derive clinical significance by identifying correlations for higher HDL with lower Lp(a) and hs-CRP.

Video link: https://www.youtube.com/watch?v=MUuKlpyvZaU

Biological Age: Optimal On A Carnivore Diet?

After going on Joe Rogan’s podcast, Paul Saladino, MD, posted his show notes, which included his blood test results. Based on that data, is his biological age optimal while on a carnivore diet?

Blood Test Analysis: 100 – 111y (Centenarians, Semi- and Super-Centenarians)

In order to slow aging, it’s important to know how circulating biomarkers change during aging, and how these biomarkers are associated with risk of death for all causes. In this video, I discuss blood test data for the oldest old, including centenarians (100 – 104y), semi-centenarians (105 – 109y), and super-centenarians (110y+).


Quantifying Biological Age: Blood Test Measurement #3 in 2020

In this video, I discuss data for 6 blood test measurements since 2018 that show a Phenotypic (Biological) Age that is ~14 years than my current age (47y).
 

Blood Test Analysis In A 100 Year Old Subject

What are the blood biomarkers of a centenarian, and is there room for improvement? Find out in the video below!

Optimizing Biological Age-Lifespan.io Presentation

In the first 45 minutes, discuss each of the biomarkers contained within Levine’s Biological Age calculator, Phenotypic Age.

After that, I answer questions from the audience and we discuss all things related to aging.

https://www.youtube.com/watch?v=8hs2n7U7J-k&t=30s

Coronavirus: Can Diet Help?

There are a few ways that we can fight the novel coronavirus (SARS-CoV-2). Clinical trials aimed at vaccination have recently begun, and at the earliest, could be available within 6-18 months. Similarly, drugs aimed at inhibiting, blocking, or reducing viral replication, including remdesevir and hydoxychloroquine are entering clinical trials, but large-scale results are also a few months away.

Other alternatives that are rarely discussed are dietary components that can inhibit SARS-CoV-2 replication. Inhibiting replication is important because if the virus continually makes more copies of itself, there will be a systemic viral overload, thereby overwhelming the immune system. Two coronavirus proteins that are important for its replication and binding to cell membranes are its Main protease (Mpro for SARS-CoV-2, 3CLpro for SARS-CoV; X. Liu & Wang, 2020), and its surface Spike glycoprotein (S protein; Song et al. 2018), respectively.

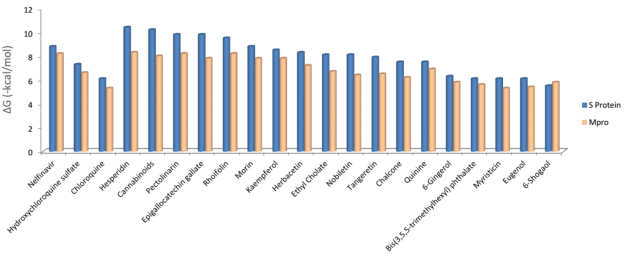
In a recently published (but not peer-reviewed) preprint, Tallei et al. (2020) used a molecular docking approach to predict how SARS-CoV-2’s Mpro and S proteins interact with various drugs and plant-based compounds. A lower molecular docking value is indicative of a potentially better ability to inhibit these proteins. Interestingly, many plant-based metabolites have lower (or equal) molecular docking values when compared with coronavirus-based drugs:

Screen Shot 2020-04-11 at 9.34.42 AM

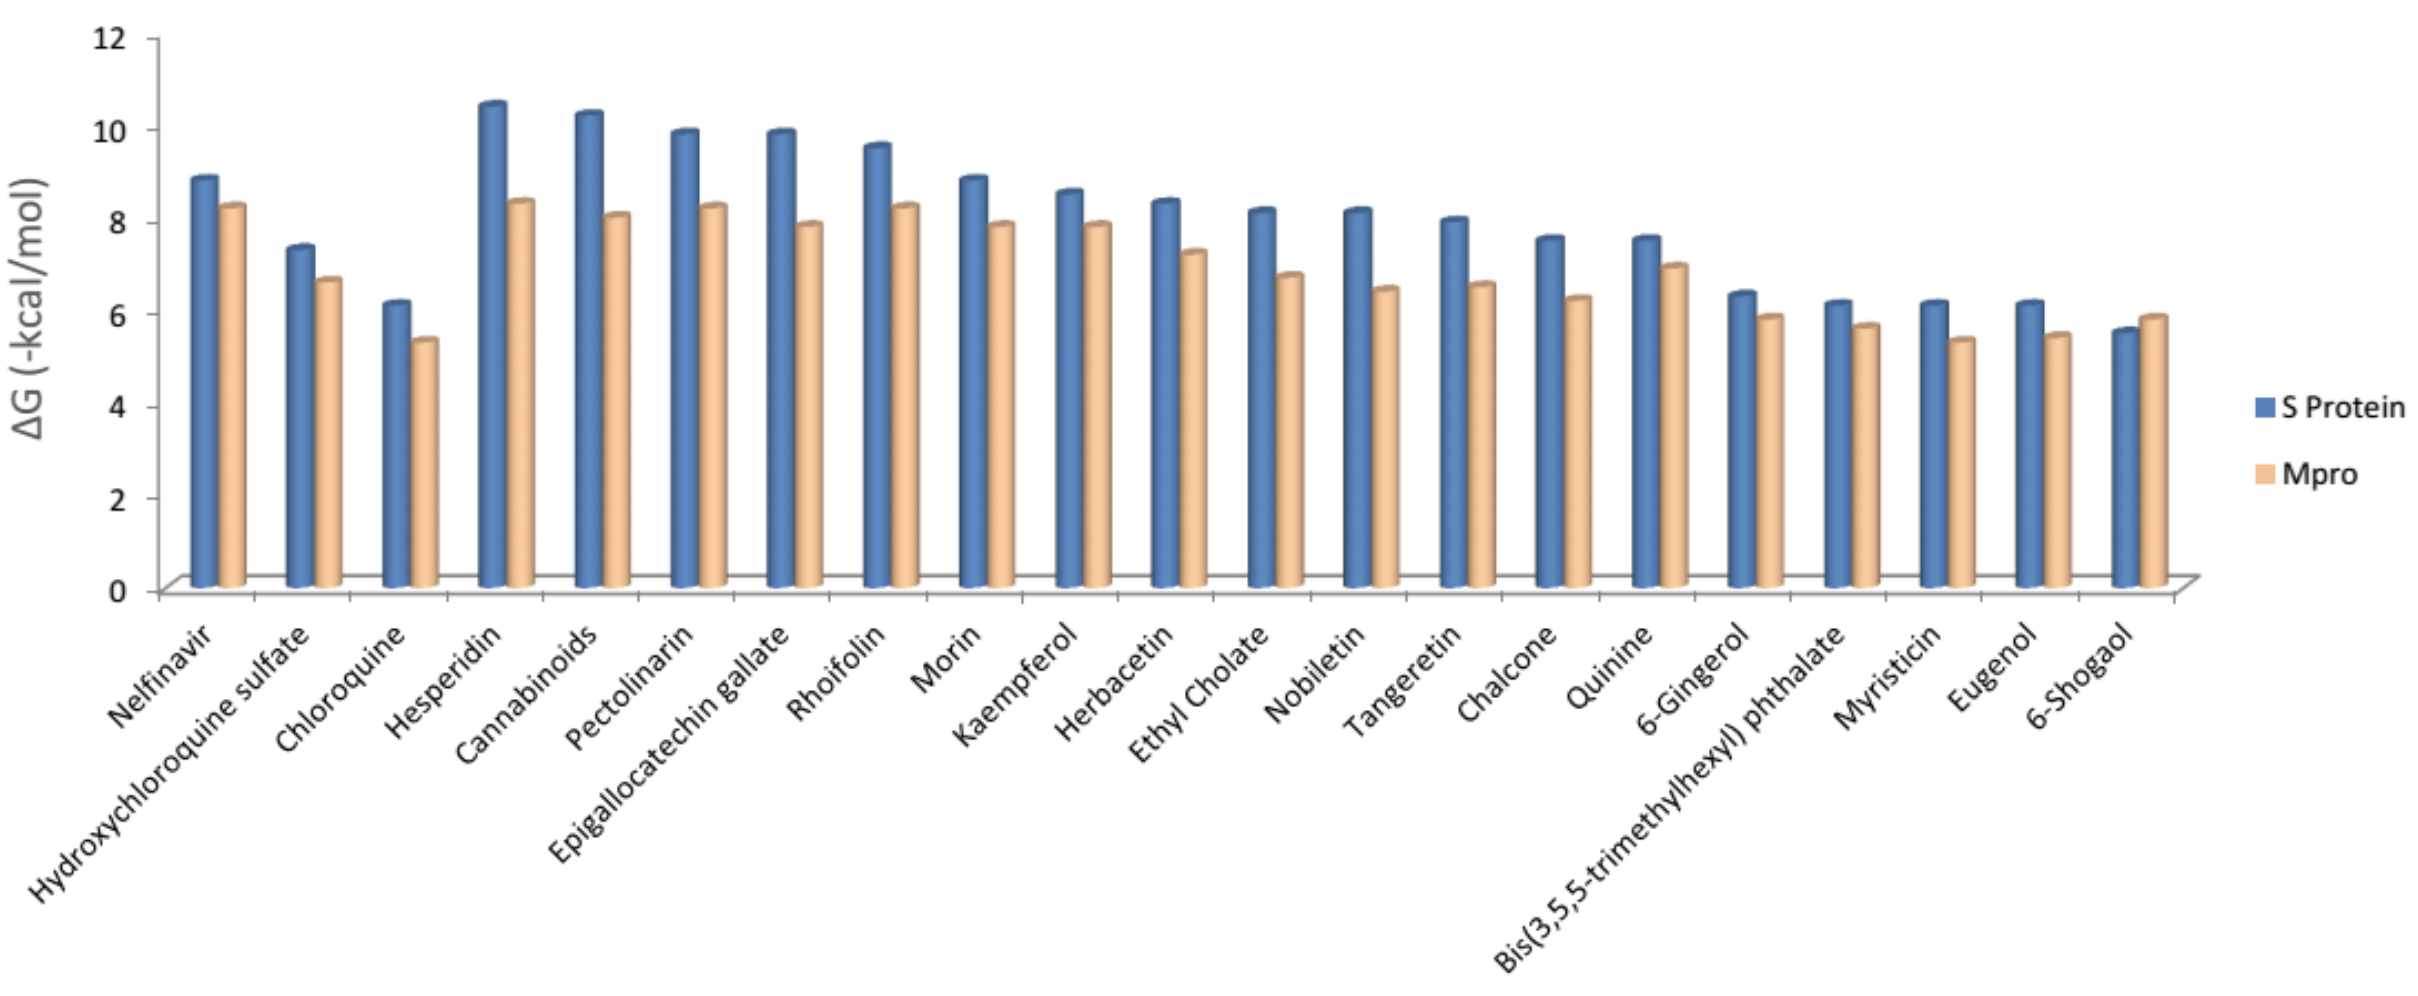
For example, when compared with the drugs nelfinavir, hyrdroxychloroquine sulfate, and chloroquine, hesperidin (found in citrus fruits and peppermint) and epigallocatechin galleate (found in green tea, apple skin, plums, onions, hazelnut) had equivalent or lower molecular docking scores, evidence that suggests a better ability for the plant-based metabolites to inhibit Mpro and the S protein. Based on this data, incorporation of these foods may be an important strategy for boosting endogenous defense against SARS-CoV-2 infection.

Similarly, a molecular docking approach was used to identify potential inhibitors for Mpro in another recent preprint (Khaerunnisa et al. 2020). When compared with the docking energy for Mpro’s native ligand (-8), the coronavirus drugs nelfinavir and lopinavir had lower docking energies, thereby suggesting that they would be good Mpro inhibitors. Interestingly, kaempferol and quercetin had docking energies that were not as low as the drugs, but were as low as or lower than the docking energy for Mpro’s native ligand, thereby suggesting that they might also act as inhibitors of SARS-CoV-2 replication:

Screen Shot 2020-04-11 at 10.26.50 AM

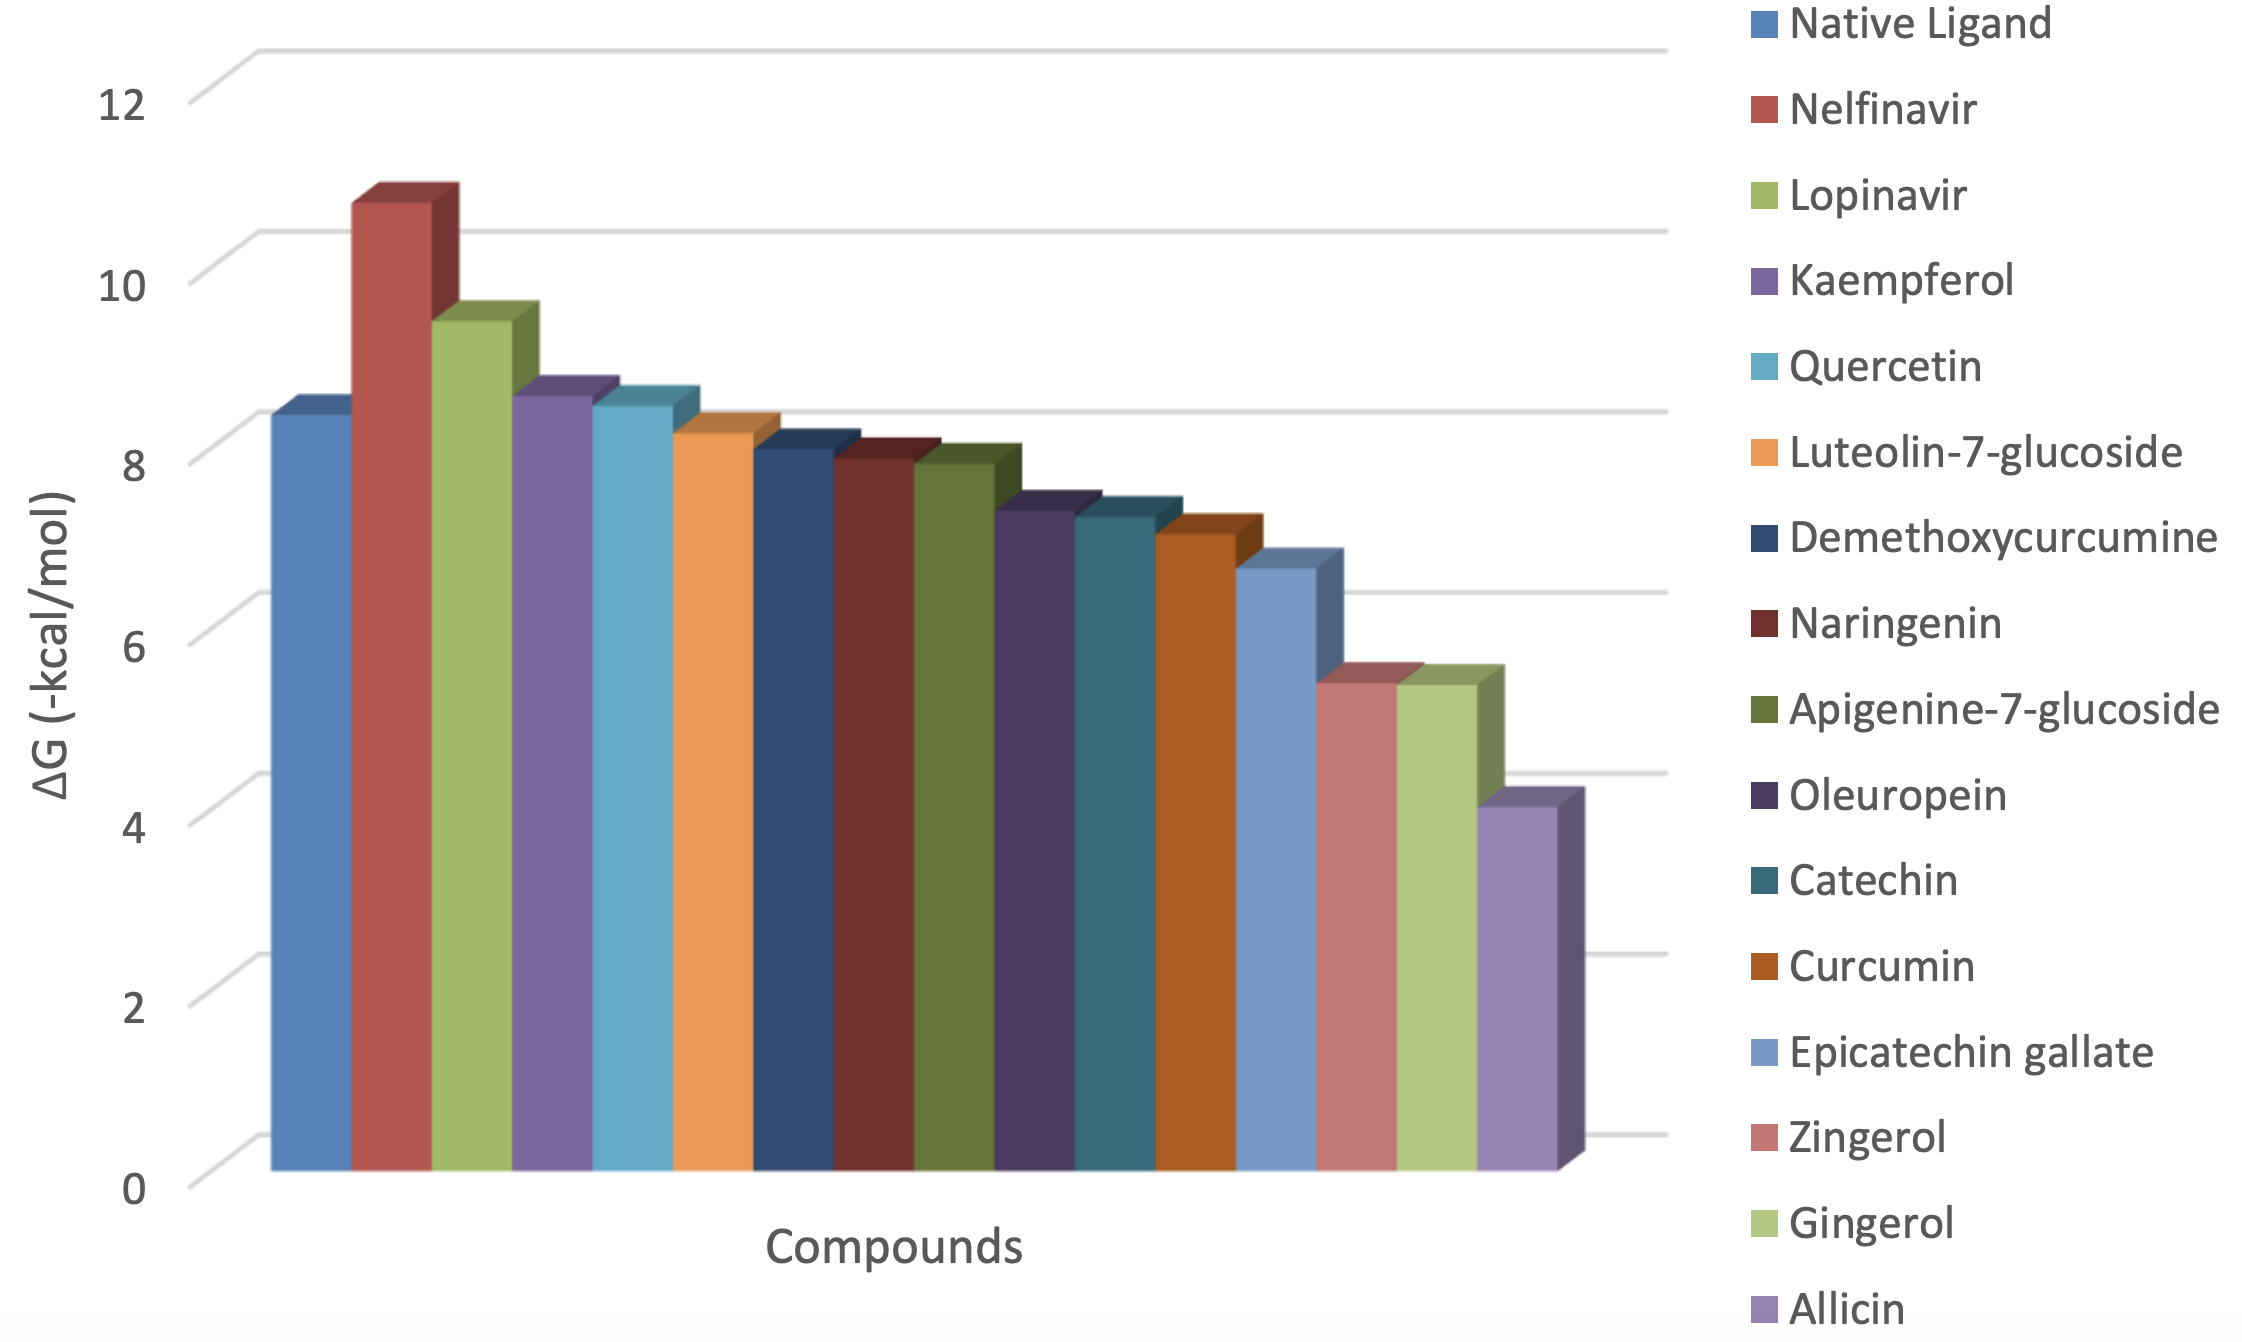
Kaempferol and quercetin are found in relatively high amounts in dill, lettuce, onions, spinach and other vegetables (for the full list see https://www.ars.usda.gov/ARSUserFiles/80400525/Data/Flav/Flav_R03.pdf).

It’s important to note that the amount of these foods needed to ingest enough kaempferol, quercetin, or other metabolites that may inhibit SARS-CoV-2 replication or its fusion to cell membranes proteins in vivo is unknown. In addition, with the goal of further boosting endogenous defense, I’d propose including these foods in addition to, but not for the replacement of  a vaccine or FDA approved medicines. Note that clinical trials aimed at direct testing for the ability of these plant-based components to inhibit SARS-CoV-2 replication has yet to be performed, but when consumed as a part of a whole-food diet, may be a low risk, high reward strategy for battling SARS-CoV-2 infection.

References

Khaerunnisa, S., Kurniawan, H., Awaluddin R., Suhartati S., Soetjipto, S. (2020). Potential Inhibitor of COVID-19 Main Protease (Mpro) from Several Medicinal Plant Compounds by Molecular Docking Study. March 13, Preprint. doi: 10.20944/preprints202003.0226.v1

Liu, X., & Wang, X.-J. (2020). Potential inhibitors for 2019-nCoV coronavirus M protease from clinically approved medicines. BioRxiv, 2020.01.29.924100. https://doi.org/10.1101/2020.01.29.924100.

Song, W., Gui, M., Wang, X., & Xiang, Y. (2018). Cryo-EM structure of the SARS coronavirus spike glycoprotein in complex with its host cell receptor ACE2. PLOS Pathogens, 14(8), e1007236. https://doi.org/10.1371/journal.ppat.1007236.

Tallei, T.E., Tumilaar, S.G., Niode, N.J. , Fatimawali, Kepel4, B.J., Idroes, R., Effendi Y.  (2020). Potential of Plant Bioactive Compounds as SARS-CoV-2 Main Protease (Mpro) and Spike (S) Glycoprotein Inhibitors: A Molecular Docking Study. April 9, Preprint. doi: 10.20944/preprints202004.0102.v2.

Coronavirus isn’t the only virus that negatively affects human health. For more info, 
https://www.amazon.com/dp/B01G48A88A


15+ Years Younger Than My Chronological Age: Blood Test #2 In 2020

Exactly 1 month ago, my first biological age measurement of 2020 was 32.75y (https://michaellustgarten.wordpress.com/2020/02/14/biological-age-32-75y-chronological-age-47y-first-2020-measurement/). When considering that my chronological age is 47y, that’s a 14 year improvement, but I wasn’t (and still aren’t) satisfied. When I sent my blood for analysis, I was battling a mild upper respiratory infection (cough, no fever), which likely raised my WBCs, thereby resulting in a higher biologic age. Also, I was experimenting with a higher intake of meat, eggs, and cheese, to see what affect that it would have on my circulating biomarkers. On that blood test in February, my creatinine levels were higher than my 2015-2020 average value, and if those foods were associated with circulating levels of creatinine, reducing them should also reduce creatinine, and accordingly, further improve my biological age. I also assumed that all other variables on Levine’s Phenotypic Age calculator would be unchanged.

On March 9 2020, I sent my blood for analysis so that I could calculate biological age with Levine’s PhenotypicAge. Almost exactly as expected, my WBCs (4.7 * 10^3 cells/microliter) were closer to my 2015-2020 average value (4.6), rather than the higher value (5.8) in my blood test last month. Similarly, reducing my intake of beef, eggs, and cheese brought creatinine from 1.08 to 0.97 mg/dL, which is closer to its 5-year average (0.94 mg/dL). As a result, I further reduced my biological age by 1.14 years to 31.61y, which is 15+ years younger than my chronological!

pa 3.9.2020

Because I track my diet every day, I can investigate the correlation between my meat, eggs, and cheese intake with creatinine. I now have 8 blood tests that correspond to dietary data, and interestingly, there is a moderately strong correlation between my average daily beef+egg+cheese intake with creatinine (r = 0.55). Based on these data, I’m going to continue to minimize consumption of these foods, with the goal of optimizing creatinine.cr mec intake

On a final note, I also expected to further reduce my CRP from 0.3 to something lower, but it slightly increased to 0.37 mg/L. While that is far from a high value, lower is better, and in future blood tests I’ll try to figure out how to further reduce it.

If you’re interested in calculating your biological age, here’s the Excel link:

DNAmPhenoAge_gen (1)