For more info about the day-to-day approach, join us on Patreon!
https://www.patreon.com/MichaelLustgartenPhD

Quantifying Biological Age: Blood Test #2 in 2022
Leave a reply
For more info about the day-to-day approach, join us on Patreon!
https://www.patreon.com/MichaelLustgartenPhD

My latest blood test results are in-how’s my biological age? In the video I discuss my dietary approach prior to my latest blood test, the blood test results, and my plan to improve them going forward.


Here’s a recent podcast that was recorded with Julian Hayes II at Optimal Health for Busy Entrepreneurs:
https://theartoffitnessandlife.com/episode20/
Enjoy!
Exactly 1 month ago, my first biological age measurement of 2020 was 32.75y (https://michaellustgarten.wordpress.com/2020/02/14/biological-age-32-75y-chronological-age-47y-first-2020-measurement/). When considering that my chronological age is 47y, that’s a 14 year improvement, but I wasn’t (and still aren’t) satisfied. When I sent my blood for analysis, I was battling a mild upper respiratory infection (cough, no fever), which likely raised my WBCs, thereby resulting in a higher biologic age. Also, I was experimenting with a higher intake of meat, eggs, and cheese, to see what affect that it would have on my circulating biomarkers. On that blood test in February, my creatinine levels were higher than my 2015-2020 average value, and if those foods were associated with circulating levels of creatinine, reducing them should also reduce creatinine, and accordingly, further improve my biological age. I also assumed that all other variables on Levine’s Phenotypic Age calculator would be unchanged.
On March 9 2020, I sent my blood for analysis so that I could calculate biological age with Levine’s PhenotypicAge. Almost exactly as expected, my WBCs (4.7 * 10^3 cells/microliter) were closer to my 2015-2020 average value (4.6), rather than the higher value (5.8) in my blood test last month. Similarly, reducing my intake of beef, eggs, and cheese brought creatinine from 1.08 to 0.97 mg/dL, which is closer to its 5-year average (0.94 mg/dL). As a result, I further reduced my biological age by 1.14 years to 31.61y, which is 15+ years younger than my chronological!

Because I track my diet every day, I can investigate the correlation between my meat, eggs, and cheese intake with creatinine. I now have 8 blood tests that correspond to dietary data, and interestingly, there is a moderately strong correlation between my average daily beef+egg+cheese intake with creatinine (r = 0.55). Based on these data, I’m going to continue to minimize consumption of these foods, with the goal of optimizing creatinine.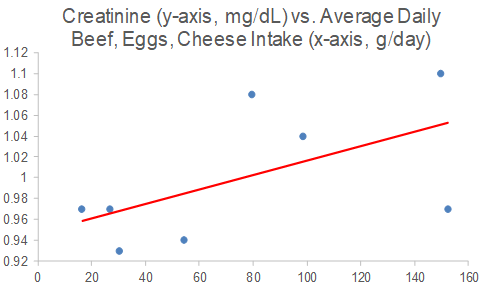
On a final note, I also expected to further reduce my CRP from 0.3 to something lower, but it slightly increased to 0.37 mg/L. While that is far from a high value, lower is better, and in future blood tests I’ll try to figure out how to further reduce it.
If you’re interested in calculating your biological age, here’s the Excel link:

In an earlier post (https://michaellustgarten.wordpress.com/2018/06/26/maximizing-health-and-lifespan-is-calorie-restriction-essential/), I documented my aging.ai biologic age for 13 blood test measurements from 2016 – 2019. If you missed that post, here are those data:
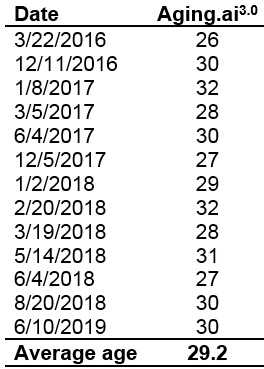 Note that note my average biologic age has slowly increased from 2016 to 2019, from 28y in 2016 (2 measurements), to 29.25y in 2017 (6 measurements), to 29.5y in 2018 (6 measurements), to 30y in my June 2019 measurement.
To gain more insight into my 2019 prediction for biologic age, I kept measuring. On September 17, 2019, I had my worst biological age to date, 33y, based on the blood test data below:

Seeing a biological age that high (for me) was the motivation that I needed to finally stick to a mild caloric restriction, which I hypothesized would positively affect my biological age. I wrote about this in my recent Phenotypic Age post (https://michaellustgarten.wordpress.com/2019/11/01/biological-age-31-3y-chronological-age-46y/). Did it work? Shown below is my blood test data for October 29th.

Based on that data, my biological age was 28y, and when averaging the 3 measurements in 2019 (so far!), my average biological age is 29.67y. When considering that my average biological age in 2016 was 28y, it looks like I’ve only aged ~1.7 years in 3.58 years of elapsed time!
If you’re interested, please have a look at my book!

On June 10, 2019 (for the first time) I measured all of the blood test variables that are included in the biologic age calculator, Phenotypic Age, and ended up with a biological age = 35.39y (https://michaellustgarten.wordpress.com/2019/09/09/quantifying-biological-age/).
While that value is 23% younger than my chronological age (46y), I knew that I could do better! So I tried again on September 17, 2019. Basically, the same biological age, 35.58y:

An 23% younger biological age on 2 separate dates, months apart might be good for most, but not for me. So, I tried again on October 29th, 2019, and voila, a biological age of 31.3y, which is 32% younger than my chronological age! How did I do it?

From my last blood test until my most recent blood test, I attempted a mild caloric restriction. To maintain my body weight, I require about 2800 calories per day, an amount which is based on daily body weight weighing in conjunction with daily dietary tracking. For the period of time that elapsed between my last 2 blood tests, I averaged 2657 calories/day, which is 3.2% less than the 2745 calories/day that I averaged for the dietary period that corresponded to my September blood test. That I was also in a very mild caloric restriction is confirmed by a reduction in my average body weight, which was (purposefully) down 0.7 lbs from September 17 to October 29th, when compared with the dietary period that corresponded to my September blood test (August 20 – September 17).
This is a superficial analysis of how I further reduced my biological age, but in future posts I’ll report the average dietary intake that corresponded to my relatively youthful biologic age!
If you’re interested, please have a look at my book!
