Monthly Archives: September 2015

Boiling drinking water for improved health?

I recently heard centenarian Bernando Lapallo say that he boils his drinking water (http://www.abc15.com/news/local-news/water-cooler/valley-man-celebrates-114th-birthday-shares-his-longevity-secrets). Whether this is a contributor to or is merely associated with his longevity is debatable. What will boiling your water do, prior to drinking it, and is it worth the effort?

The ability of our immune system to combat infectious agents decreases with age (Ginaldi et al. 2001). Can we counteract this? Reducing intake of infectious agents would reduce the burden that our immune systems would have to deal with. Is it possible to reduce intake of infectious agents, including bacteria, viruses, and protozoa?

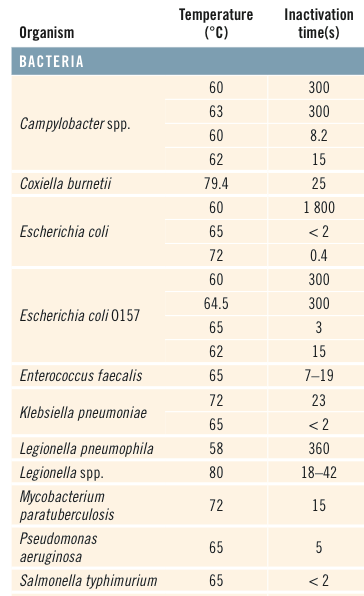
Boiling water can inactivate a variety of bacteria, viruses, and protozoa (WHO, 2015) that are increased in older adults. For example, as shown below, a water temperature greater than 60C (water boils at 100C) for 5 minutes will inactivate Escherichia Coli (E. coli). Why are E. coli important? E. Coli are elevated in older adults (70­-90y), when compared with young (20­-50y; Enck et al. 2009), and are associated with insulin resistance (Vrieze et al. 2012) and frailty (Claesson et al. 2012). Below we see that boiling water for 5 minutes would thermally inactivate E. Coli, potentially resulting in decreased work for our immune system.

water bacteria

Every morning I boil ~40 oz of water for my green tea. Later in the day in drink 10-20 oz of water, but not boiled. So, ~2/3 of my water intake is boiled, potentially reducing the infectious burden that my immune system has to battle. Whether boiling water reduces this burden by 1%, 10%, or more is unknown. However, based on the ability of water boiling to inactivate pathogens that are increased during aging, it may be a low risk (only the time used!), high reward strategy for improving health during aging. I’m actively considering boiling my 10-20 oz. of water at night, too.

7/2017 Update: In addition to boiling my water for green tea, I also use a high-powered water filter, the Big Berkey. I’m not paid to say that, but that’s what I do!

If you’re interested, please have a look at my book!

Reference:

Claesson MJ, Jeffery IB, Conde S, Power SE, O’Connor EM, Cusack S, Harris HM, Coakley M, Lakshminarayanan B, O’Sullivan O, Fitzgerald GF, Deane J, O’Connor M, Harnedy N, O’Connor K, O’Mahony D, van Sinderen D, Wallace M, Brennan L, Stanton C, Marchesi JR, Fitzgerald AP, Shanahan F, Hill C, Ross RP, O’Toole PW. Gut microbiota composition correlates with diet and health in the elderly. Nature, 2012. 488(7410): p. 178‐84.

Ginaldi L, Loreto MF, Corsi MP, Modesti M, De Martinis M. Immunosenescence and infectious diseases. Microbes Infect. 2001 Aug;3(10):851-7.

Enck P, Zimmermann K, Rusch K, Schwiertz A, Klosterhalfen S, Frick JS. The effects of ageing on the colonic bacterial microflora in adults. Z Gastroenterol, 2009. 47(7): p. 653‐8.

Vrieze A, Van Nood E, Holleman F, Salojärvi J, Kootte RS, Bartelsman JF, Dallinga-Thie GM, Ackermans MT, Serlie MJ, Oozeer R, Derrien M, Druesne A, Van Hylckama Vlieg JE, Bloks VW, Groen AK, Heilig HG, Zoetendal EG, Stroes ES, de Vos WM, Hoekstra JB, Nieuwdorp M. Transfer of intestinal microbiota from lean donors increases insulin sensitivity in individuals with metabolic syndrome. Gastroenterology, 2012. 143(4): p. 913‐6 e7.

World Health Organization. Boil Water. January 2015. http://www.who.int/water_sanitation_health/dwq/Boiling_water_01_15.pdf

Advertisement

Blood Testing: What’s An Optimal Value For Triglycerides?

In terms of all-cause mortality risk, is the reference range for circulating triglycerides (TG, <150 mg/dL) optimal?

A meta-analysis of 38 studies in 360,556 subjects with a median age of 48y and a 12-year follow-up reported lowest all-cause mortality risk for subjects with TG values less than 90 mg/dL (equivalent to ~1 mmol; Liu et al. (2013)). As shown below, each successive 90 mg/dL increase was associated with a 12% higher all-cause mortality risk. A person with a value closer to the high end of the reference range, ~150 would have a ~7% increased mortality risk compared someone with a value ~90. In other words, there would be 7 more deaths per 100 total people at a TG value of 150, compared with the death rate for people with values less than 90.

tg mortal

Added importance for the association between TG values less than 90 with all-cause mortality risk come from studies of people who have lived longer than 100 years, centenarians. As shown below, triglyceride values less than 101 mg/dL have been reported in 9 of 11 centenarian studies:

tg mort

What’s my TG value? On my latest blood test (8/2015), it was 42. I’ve measured my TGs 11 times over the past 10 years-my average value for those measurements is 62. Based on the meta-analysis and centenarian data, that would put me in the lowest risk category for all-cause mortality.

tg mort

If you’re interested, please have a look at my book!

References

Arai Y, Hirose N, Yamamura K, Shimizu K, Takayama M, Ebihara Y, Osono Y. Serum insulin-like growth factor-1 in centenarians: implications of IGF-1 as a rapid turnover protein. J Gerontol A Biol Sci Med Sci. 2001 Feb;56(2):M79-82.

Baranowska B, Bik W, Baranowska-Bik A, Wolinska-Witort E, Szybinska A, Martynska L, Chmielowska M. Neuroendocrine control of metabolic homeostasis in Polish centenarians. J Physiol Pharmacol. 2006 Nov;57 Suppl 6:55-61.

Barbagallo CM, Averna MR, Frada G, Noto D, Cavera G, Notarbartolo A. Lipoprotein profile and high-density lipoproteins: subfractions distribution in centenarians. Gerontology 1998;44(2):106–10.

Bik W, Baranowska-Bik A, Wolinska-Witort E, Kalisz M, Broczek K, Mossakowska M, Baranowska B. Assessment of adiponectin and its isoforms in Polish centenarians. Exp Gerontol. 2013 Apr;48(4):401-7.

Chan YC, Suzuki M, Yamamoto S. Dietary, anthropometric, hematological and biochemical assessment of the nutritional status of centenarians and elderly people in Okinawa, Japan. J Am Coll Nutr. 1997 Jun;16(3):229-35.

Chan YC, Suzuki M, Yamamoto S. A comparison of anthropometry, biochemical variables and plasma amino acids among centenarians, elderly and young subjects. J Am Coll Nutr. 1999 Aug;18(4):358-65.

Liu J, Zeng FF, Liu ZM, Zhang CX, Ling WH, Chen YM. Effects of blood triglycerides on cardiovascular and all-cause mortality: a systematic review and meta-analysis of 61 prospective studies. Lipids Health Dis. 2013 Oct 29;12:159.

Magri F, Muzzoni B, Cravello L, Fioravanti M, Busconi L, Camozzi D, Vignati G, Ferrari E. Thyroid function in physiological aging and in centenarians: possible relationships with some nutritional markers. Metabolism. 2002 Jan;51(1):105-9.

Paolisso G, Ammendola S, Del Buono A, Gambardella A, Riondino M, Tagliamonte MR, Rizzo MR, Carella C, Varricchio M. Serum levels of insulin-like growth factor-I (IGF-I) and IGF-binding protein-3 in healthy centenarians: relationship with plasma leptin and lipid concentrations, insulin action, and cognitive function. J Clin Endocrinol Metab. 1997 Jul;82(7):2204-9.

Thillet J, Doucet C, Chapman J, Herbeth B, Cohen D, Faure-Delanef L. Elevated lipoprotein(a) levels and small apo(a) isoforms are compatible with longevity: evidence from a large population of French centenarians. Atherosclerosis 1998;136:389–94.

Vasto S, Scapagnini G, Rizzo C, Monastero R, Marchese A, Caruso C. Mediterranean diet and longevity in Sicily: survey in a Sicani Mountains population. Rejuvenation Res. 2012 Apr;15(2):184-8.

Willcox DC, Willcox BJ, Wang NC, He Q, Rosenbaum M, Suzuki M. Life at the extreme limit: phenotypic characteristics of supercentenarians in Okinawa. J Gerontol A Biol Sci Med Sci. 2008 Nov;63(11):1201-8.

Think Your Diet Is Paleo? Not If Your Potassium Intake Is Less Than…

The stereotype about the Paleo diet is that it is meat heavy. How much meat Paleo era-eaters ate is debatable, but that they consumed large amounts of potassium rich, plant-based foods is not! When examining 159 Stone Age diets, the average daily potassium intake has been reported to be 400 meq/day (Sebastian et al. 2006), as shown below:

potass

How much is 400 meq in milligrams (mg) of potassium? 1 meq = 39.1 mg of potassium, so to figure that out we multiply 400 *39.1, thereby yielding an average daily potassium intake of 15,640 mg/day! It’s important to note that this value is based on a 3000 calorie diet (Eaton et al. 1997). Dividing 15,640/3000 yields 5.21 mg potassium/calorie.

In contrast, as studied in 12,581 US adults, the average dietary potassium intake has been reported to be only ~2600 mg/day (Cogswell et al. 2012). Furthermore, only 1.4% of all subjects had potassium values greater than 4700 mg/day!

What’s my potassium intake? Shown below is my 7-day average intake from 8/29/2015-9/4/2015. The black rectangle in the lower right corner shows my average daily potassium intake to be 10,383 mg/day.

my potass

My average daily calorie intake during that week was 2193. In terms of mg potassium/calorie, my value is 4.73 (10,383/2193), which isn’t far from the reported average Paleo value. What’s yours?

For reference, shown below is a representative day during that week (Wednesday, September 2; 2251 calories) for what I ate.

my intake

If you’re interested, please have a look at my book!

References

Cogswell ME, Zhang Z, Carriquiry AL, Gunn JP, Kuklina EV, Saydah SH, Yang Q, Moshfegh AJ. Sodium and potassium intakes among US adults: NHANES 2003-2008. Am J Clin Nutr. 2012 Sep;96(3):647-57.

Eaton SB, Eaton SB 3rd, Konner MJ. Paleolithic nutrition revisited: A twelve-year retrospective on its nature and implications. Eur J Clin Nutr. 1997 Apr;51(4):207-16.

Sebastian A, Frassetto LA, Sellmeyer DE, Morris RC Jr. The evolution-informed optimal dietary potassium intake of human beings greatly exceeds current and recommended intakesSemin Nephrol. 2006 Nov;26(6):447-53.