Available in all sizes!

If you’re interested, please have a look at my book!
Available in all sizes!
If you’re interested, please have a look at my book!
Available in all sizes!

If you’re interested, please have a look at my book!
Available in all sizes!

If you’re interested, please have a look at my book!
In an earlier post, I wrote about the association between biomarkers of systemic acid-base balance (serum bicarbonate, the anion gap, urinary pH) with all-cause mortality risk (https://atomic-temporary-71218033.wpcomstaging.com/2015/08/28/serum-bicarbonate-and-anion-gap-whats-optimal/). Based on these data, systemic acidity may not be optimal for health and longevity, when compared with more alkaline values. Can circulating acid-base biomarkers be optimized through diet?
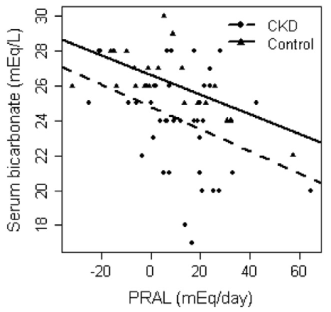
One way to optimize serum bicarbonate is with a low dietary PRAL (potential renal acid load). For a given food, PRAL is a measure of how much acid or base that the kidney will see. In subjects with normal kidney function (or with chronic kidney disease, CKD), a low dietary PRAL (alkaline-forming) is associated with high serum bicarbonate, whereas a high dietary PRAL (acid-forming) is associated with reduced serum bicarbonate (Ikizler et al. 2015):
So how can we achieve a low dietary acid intake (low PRAL), with the goal of increasing serum bicarbonate? The answer is to abundantly consume foods with a low PRAL (vegetables), while minimizing foods with a high PRAL (animal products, grains). Let’s have a look at the PRAL values for several food groups (Remer and Manz, 1995):
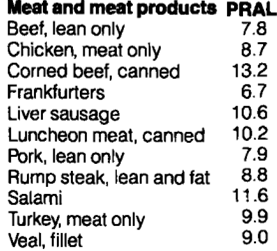
All of the meat and meat products shown below have acid-forming, positive PRAL values:
Similarly, fish have acid-forming, positive PRAL values:

While PRAL values for milk, dairy, and eggs are generally acid-forming, there is a wider range, compared with meat and fish. For example, parmesan and cheddar cheese have high PRAL values (34.2, 26.5, respectively), whereas milk and yogurt have PRAL values ~1:

Grains are similar to animal products in terms of their PRAL values:

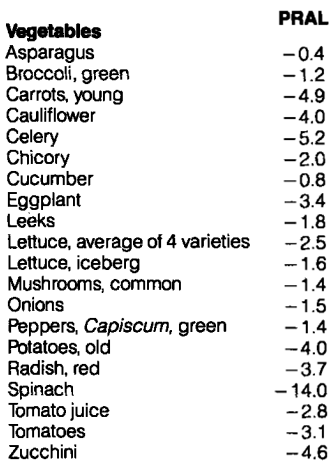
In contrast, all of the vegetables on the list below have very low, alkaline-forming PRAL values. The All-Star for a low PRAL is spinach (-14):
Similarly, most fruits have alkaline forming, low PRAL values. Although raisins seem to be the PRAL All-Star, their data (and all of the other foods on the list) are based on 100g (299 calories for raisins). For an equivalent amount of calories for strawberries, their PRAL equates to -20.6, which is similar to the raisin PRAL. Also included on the list are nuts, which contain a range of PRAL values from negative (hazelnuts) to positive (walnuts, peanuts):

What’s my dietary PRAL? To determine that, it’s first important to define the PRAL equation: PRAL = (0.49 * protein intake in g/day) + (0.037 * phosphorus intake in mg/day) – (0.02 * potassium intake in mg/day) – (0.013 * calcium intake in mg/day) – (0.027 * magnesium intake in mg/day; Remer and Manz, 1994). Using my latest 7-day average dietary data yields a very low, alkaline-forming PRAL, -121.9: (protein, 88g; phosphorus, 2038 mg; potassium, 9868 mg; calcium, 1421 mg; magnesium, 901 mg)! It’s important to note that the major contributor to my very low PRAL value comes from the potassium term. Because of my abundant vegetable intake, my potassium intake is very high, resulting in a highly alkaline PRAL. Considering that PRAL values of -40 were associated with serum bicarbonate values of ~28, my serum bicarbonate value of 31 on my last blood test (8/2015) may in part be explained by my very low dietary PRAL value, -121.9.
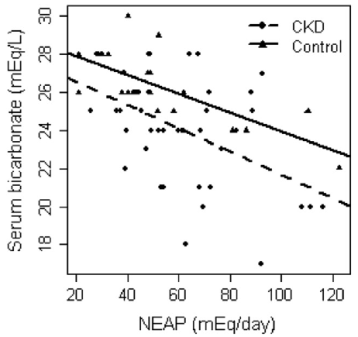
NEAP is more easily calculated than PRAL-all you need to know are your dietary protein and potassium intakes: NEAP = (54.5 * protein intake in grams/day)/(potassium intake in mEq/day) -10.2 (Frassetto et al. 1999). To convert your daily potassium intake from mg to mEq, divide by 39.1. Using my 7-day average protein and potassium intake data yields a NEAP = (54.5 * 88)/(9868/39.1) – 10.2 = 8.8. Based on the plot above for NEAP vs. serum bicarbonate, that again puts me on the far left, which is associated with serum bicarbonate values greater than 28.
Collectively, eating more potassium-rich vegetables will reduce PRAL and NEAP, which is associated with systemic alkalinity, as measured by an elevated serum bicarbonate. Because high serum bicarbonate levels are associated with reduced all-cause mortality risk, this may be an important strategy for improving health and longevity!
If you’re interested, please have a look at my book!
References
Frassetto LA, Todd KM, Morris RJC, Sebastian A. Estimation of net endogenous noncarbonic acid production in humans from diet potassium and protein contents. Am J Clin Nutr. 1998;68:576-583.
Ikizler HO, Zelnick L, Ruzinski J, Curtin L, Utzschneider KM, Kestenbaum B, Himmelfarb J, de Boer IH. Dietary Acid Load Is Associated With Serum Bicarbonate but not Insulin Sensitivity in Chronic Kidney Disease. J Ren Nutr. 2016 Mar;26(2):93-102.
Remer T, Manz F. Estimation of the renal net acid excretion by adults consuming diets containing variable amounts of protein. Am J Clin Nutr. 1994;59:1356-1361.
Remer, T. and Manz, F. Potential renal acid load of foods and its influence on urine pH. Journal of the American Dietetic Association 1995 ;95(7), 791-797.
