Category Archives: calorie restriction

Fasting Without Calorie Restriction Extends Lifespan

Join us on Patreon!
https://www.patreon.com/MichaelLustgartenPhD

Bristle Discount Link (Oral microbiome quantification):
ConquerAging15

https://www.bmq30trk.com/4FL3LK/GTSC3/

Cronometer Discount Link (Daily diet tracking):
https://shareasale.com/r.cfm?b=1390137&u=3266601&m=61121&urllink=&afftrack=

Support the channel with Buy Me A Coffee!
https://www.buymeacoffee.com/mlhnrca


Paper referenced in the video:
Daily Fasting Improves Health and Survival in Male Mice Independent of Diet Composition and Calories
https://pubmed.ncbi.nlm.nih.gov/30197301/

Lifespan Extension With Calorie Restriction, Fasting, And Circadian Alignment

Join us on Patreon!
https://www.patreon.com/MichaelLustgartenPhD

Bristle Discount Link (Oral microbiome quantification):
ConquerAging15

https://www.bmq30trk.com/4FL3LK/GTSC3/

Cronometer Discount Link (Daily diet tracking):
https://shareasale.com/r.cfm?b=1390137&u=3266601&m=61121&urllink=&afftrack=

You can support the channel by buying me a coffee!
https://www.buymeacoffee.com/mlhnrca


Papers referenced in the video:
Fasting drives the metabolic, molecular and geroprotective effects of a calorie-restricted diet in mice
https://www.nature.com/articles/s42255-021-00466-9

Circadian alignment of early onset caloric restriction promotes longevity in male C57BL/6J mice
https://pubmed.ncbi.nlm.nih.gov/35511946/

Fasting Drives The Geroprotective Effects Of A Calorie-Restricted Diet

Join us on Patreon! https://www.patreon.com/MichaelLustgartenPhD

Paper referenced in the video:

Fasting drives the metabolic, molecular and geroprotective effects of a calorie-restricted diet in mice https://www.nature.com/articles/s42255-021-00466-9

Insulin Sensitivity Is A Hallmark Of Longevity

HOMA calculator: https://www.omnicalculator.com/health…

Papers referenced in the video:

Growth hormone-releasing hormone disruption extends lifespan and regulates response to caloric restriction in mice https://pubmed.ncbi.nlm.nih.gov/24175…

Glucose regulation and oxidative stress in healthy centenarians https://pubmed.ncbi.nlm.nih.gov/12543…

Distribution of blood glucose and prevalence of diabetes among centenarians and oldest-old in China: based on the China Hainan Centenarian Cohort Study and China Hainan Oldest-old Cohort Study https://pubmed.ncbi.nlm.nih.gov/32643…

Prevalence and Ethnic Pattern of Diabetes and Prediabetesin China in 2013 https://pubmed.ncbi.nlm.nih.gov/28655…

Families enriched for exceptional longevity also have increased health-span: findings from the long life family study https://pubmed.ncbi.nlm.nih.gov/24350…

High FGF21, Low Insulin And Glucose: A Pro-Longevity Strategy?

Papers referenced in the video:

FGF21 and Chronic Kidney Disease: https://www.sciencedirect.com/science…

The starvation hormone, fibroblast growth factor-21, extends lifespan in mice: https://www.ncbi.nlm.nih.gov/pmc/arti…

Inhibition of growth hormone signaling by the fasting-induced hormone FGF21: https://pubmed.ncbi.nlm.nih.gov/18585…

Alpha-Ketoglutarate, an Endogenous Metabolite, Extends Lifespan and Compresses Morbidity in Aging Mice: https://pubmed.ncbi.nlm.nih.gov/32877…

Berberine ameliorates cellular senescence and extends the lifespan of mice via regulating p16 and cyclin protein expression: https://pubmed.ncbi.nlm.nih.gov/31773…

Effects of Sex, Strain, and Energy Intake on Hallmarks of Aging in Mice: https://www.ncbi.nlm.nih.gov/pmc/arti…

Regulation of longevity by FGF21: Interaction between energy metabolism and stress responses: https://pubmed.ncbi.nlm.nih.gov/28552…

Disease-specific plasma levels of mitokines FGF21, GDF15, and Humanin in type II diabetes and Alzheimer’s disease in comparison with healthy aging: https://pubmed.ncbi.nlm.nih.gov/33131…

Aging is associated with increased FGF21 levels but unaltered FGF21 responsiveness in adipose tissue: https://pubmed.ncbi.nlm.nih.gov/30043…

Circulating levels of fibroblast growth factor-21 increase with age independently of body composition indices among healthy individuals: https://pubmed.ncbi.nlm.nih.gov/26042…

Lower All-Cause, Cardiovascular, and Cancer Mortality in Centenarians’ Offspring: https://pubmed.ncbi.nlm.nih.gov/15571…

Favorable Glucose Tolerance and Lower Prevalence of Metabolic Syndrome in Offspring without Diabetes Mellitus of Nonagenarian Siblings: The Leiden Longevity Study: https://pubmed.ncbi.nlm.nih.gov/20398…

Quantifying Biological Age: Blood Test Measurement #3 in 2020

In this video, I discuss data for 6 blood test measurements since 2018 that show a Phenotypic (Biological) Age that is ~14 years than my current age (47y).
 

Optimizing Biological Age-Lifespan.io Presentation

In the first 45 minutes, discuss each of the biomarkers contained within Levine’s Biological Age calculator, Phenotypic Age.

After that, I answer questions from the audience and we discuss all things related to aging.

https://www.youtube.com/watch?v=8hs2n7U7J-k&t=30s

Biological Age = 31.3y, Chronological Age= 46y

On June 10, 2019 (for the first time) I measured all of the blood test variables that are included in the biologic age calculator, Phenotypic Age, and ended up with a biological age = 35.39y (https://michaellustgarten.wordpress.com/2019/09/09/quantifying-biological-age/).

While that value is 23% younger than my chronological age (46y), I knew that I could do better! So I tried again on September 17, 2019. Basically, the same biological age, 35.58y:

pheno 8_2019.png

An 23% younger biological age on 2 separate dates, months apart might be good for most, but not for me. So, I tried again on October 29th, 2019, and voila, a biological age of 31.3y, which is 32% younger than my chronological age! How did I do it?

oct pheno.png

From my last blood test until my most recent blood test, I attempted a mild caloric restriction. To maintain my body weight, I require about 2800 calories per day, an amount which is based on daily body weight weighing in conjunction with daily dietary tracking. For the period of time that elapsed between my last 2 blood tests, I averaged 2657 calories/day, which is 3.2% less than the 2745 calories/day that I averaged for the dietary period that corresponded to my September blood test. That I was also in a very mild caloric restriction is confirmed by a reduction in my average body weight, which was (purposefully) down 0.7 lbs from September 17 to October 29th, when compared with the dietary period that corresponded to my September blood test (August 20 – September 17).

This is a superficial analysis of how I further reduced my biological age, but in future posts I’ll report the average dietary intake that corresponded to my relatively youthful biologic age!

If you’re interested, please have a look at my book!

Optimizing Biological Age: Is Calorie Restriction Essential?

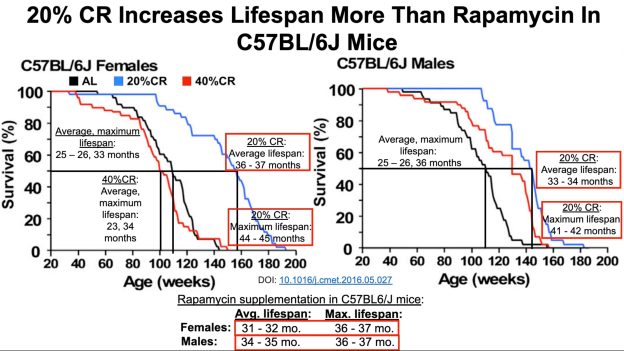
My goal is to break the world record for lifespan, 122 years, which is currently held by Jean Calment. How do I plan to do that? A good start would be calorie restriction (CR), a diet where you eat 10-30%+ less calories than your normal intake. CR is the gold standard for increasing lifespan in a variety of organisms, including yeast, flies, worms, and rodents (McDonald et al. 2010).

With the goal of maximizing my health and lifespan, in April 2015, I started a CR diet. Inherent in that was weighing all my food and recording it on an online website that tracks macro-and micro-nutrients. From then until March 2016, I was pretty good at keeping my calories relatively low, as I averaged 2302 calories. However, since 3/2016, it’s been exceedingly difficult to keep my calories that low, as I’ve averaged 2557 calories/day. So is having a higher calorie intake worse for my lifespan goal than a lower calorie intake?

Maybe not. In addition to tracking my daily nutrition since 2015, I’ve also had regular blood testing performed. I’ve measured the typical things that you get at a yearly checkup, including the lipid profile (triglycerides, total cholesterol, LDL, HDL, VLDL) markers of kidney and liver  function (BUN, creatinine, uric acid, and ALT, AST, respectively), and the complete blood count (red and white blood cells, and their differentials). By tracking my daily nutrition and circulating biomarkers, I’m able to quickly intervene on any potential aging and disease-related mechanisms by using my diet to optimize my circulating biomarkers.

On my quest for optimal health and lifespan, biological age is more important than my chronological age (I’m 46y). So what’s my biological age? Between 2016-2019, the group at Insilico Medicine published 2 papers that included circulating biomarker data from more than 200,000 people (Putin et al. 2015, Mamoshina et al. 2018) to derive a biological age predictor (aging.ai). So what’s my biological age?

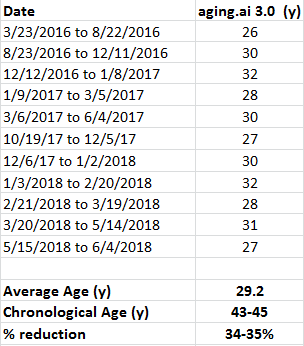
Shown below is my predicted biological age over 13 blood tests from 3/2016 to 6/2019:

agingai2

Although I wasn’t on a CR diet during that time, my average biological age was 29.2 years, which is ~34% younger than my chronological age. Would my biological age be even younger with a lower calorie intake? I’m working on reducing my calorie intake again (it’s not easy for me), so stay tuned for that!

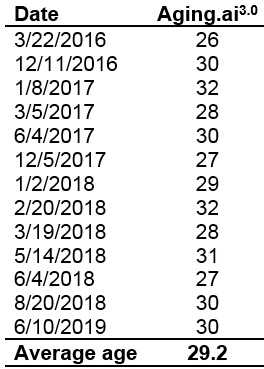
Here are the my biomarker values corresponding to each blood test, for anyone who wants to double check the results:
agingai2 values

References

Mamoshina P, Kochetov K, Putin E, Cortese F, Aliper A, Lee WS, Ahn SM, Uhn L, Skjodt N, Kovalchuk O, Scheibye-Knudsen M, Zhavoronkov A. Population specific biomarkers of human aging: a big data study using South Korean, Canadian and Eastern European patient populations. J Gerontol A Biol Sci Med Sci. 2018 Jan 11.

McDonald RB, Ramsey JJ. Honoring Clive McCay and 75 years of calorie restriction research. J Nutr. 2010 Jul;140(7):1205-10.

Putin E, Mamoshina P, Aliper A, Korzinkin M, Moskalev A, Kolosov A, Ostrovskiy A, Cantor C, Vijg J, Zhavoronkov A. Deep biomarkers of human aging: Application of deep neural networks to biomarker development. Aging (Albany NY). 2016 May;8(5):1021-33.

If you’re interested, please have a look at my book: