My latest blood test results are in-how’s my biological age? In the video I discuss my dietary approach prior to my latest blood test, the blood test results, and my plan to improve them going forward.

My latest blood test results are in-how’s my biological age? In the video I discuss my dietary approach prior to my latest blood test, the blood test results, and my plan to improve them going forward.
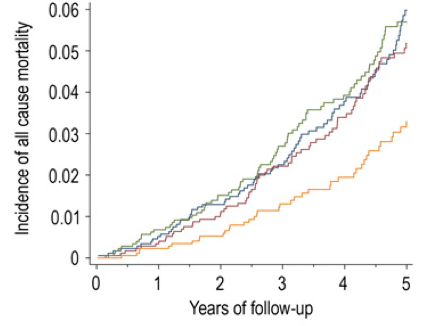
Vitamin K is found in 2 predominant forms, Vitamin K1 (phylloquinone), found almost exclusively in green leafy vegetables, and Vitamin K2 (Menaquinone), found in fermented foods, organ meats, meat, butter and eggs. In the data below (Juanola-Falgarona et al. 2014), we see that Vitamin K1 (phylloquinone) is negatively associated with death from all causes:
Death from all causes was assessed based on the average value for four groups of Vitamin K1 intake: 171 ug/day = blue line, 276 ug/day =red line, 349 ug/day = green line and 626 ug/day = the yellow line. In the data above, Vitamin K1 values less than 349 ug/day are about the same in terms of all-cause mortality risk. However, those who ate 626 ug/day of Vitamin K1 had about half of the mortality risk compared to the lower K1 intake groups! Interestingly, the RDA for Vitamin K, at 90 ug/day seems to be outdated, based on the data above. Also, Vitamin K2 was not associated with all-cause mortality risk, as shown below:

Based on the K1 mortality data, 626 ug/day seems like a good goal. However, osteocalcin is a Vitamin K-dependent protein that has been shown to be maximally active in the presence of 1000 ug of Vitamin K1 (Binkley et al. 2002)! Osteocalcin is involved in pathways that decline with aging: insulin secretion and β-cell proliferation in the pancreas, energy expenditure by muscle, insulin sensitivity in adipose tissue, muscle and liver, and increased testosterone production (Karsenty and Ferron 2012). Therefore, getting 1000 ug+ per day of Vitamin K1 may optimize all of these functions and, decrease mortality risk!
What’s the take home from these data? Eat more leafy greens! How much is needed to get 1000 ug per day? Shown below is a short list of foods rich in Vitamin K and the serving size needed to reach 1000 ug. Approximately 4 ounces of cooked kale or 7 oz. of raw spinach will suffice, and at a low calorie yield. Other foods, like broccoli, brussel sprouts or romaine lettuce would need to be consumed in far greater amounts to reach 1000 ug.

What’s my daily K1 intake? Shown below is my 7-day average (7/16/2015 – 7/22/2015) for K intake, derived almost exclusively from plant sources. 1379 ug/day puts me well above the 626 ug/day that was associated with reduced mortality risk, and above the 1000 ug/day needed for maximal osteocalcin activation.

Here’s this post in video form!
If you’re interested, please have a look at my book!
https://www.amazon.com/dp/B01G48A88A?ref_=k4w_oembed_omIChDjq2EkggX&tag=kpembed-20&linkCode=kpd
References:
Binkley NC, Krueger DC, Kawahara TN, Engelke JA, Chappell RJ, Suttie JW. A high phylloquinone intake is required to achieve maximal osteocalcin gamma-carboxylation. Am J Clin Nutr. 2002 Nov;76(5):1055-60.
Juanola-Falgarona M, Salas-Salvadó J, Martínez-González MÁ, Corella D, Ostrich R, Ros E, Fitó M, Arós F, Gómez-Gracia E, Fiol M, Lapetra J, Basora J, Lamuela-Raventós RM, Serra-Majem L, Pintó X, Muñoz MÁ, Ruiz-Gutiérrez V, Fernández-Ballart J, Bulló M. Dietary intake of vitamin K is inversely associated with mortality risk. J Nutr. 2014 May;144(5):743-50.
Karsenty G, Ferron M. The contribution of bone to whole-organism physiology. Nature. 2012 Jan 18;481(7381):314-20.
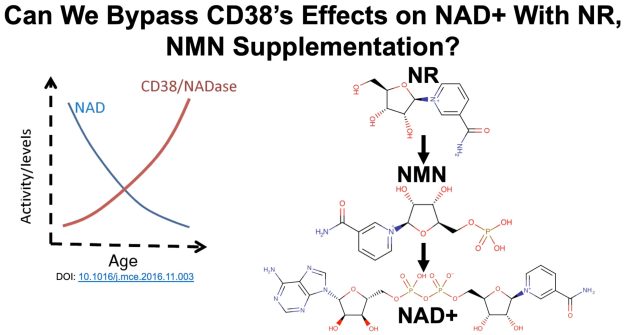
NR and NMN are popular ways to try to boost levels of NAD+, but that approach hasn’t worked every time in human studies. One reason for that may involve CD38, which degrades both NR and NMN. With the goal of boosting NAD+ levels during aging, why does CD38 increase with age, and what can be done about it? All that and more in this video!
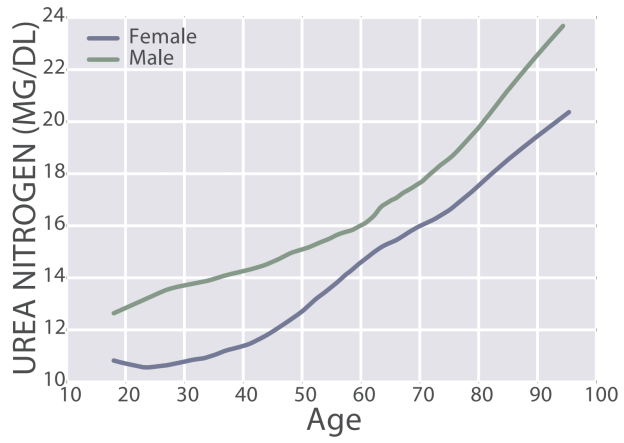
Blood urea nitrogen (BUN) is one of the 19 variables found on the biological age calculator, aging.ai. It measures the amount of nitrogen, as contained in urea (i.e., blood urea nitrogen, BUN) in your blood. The reference range for BUN is 5 – 20 mg/dL, but within that range, what’s optimal?
First, BUN increases during aging, from 11 – 13 mg/dL in 20 yr olds to 20 – 22 mg/dL in 90 yr olds (Wang et al. 2017):

The importance of the age-related increase in BUN is illustrated by the finding that risk of death for all causes increases above 15 mg/dL:

Also note that maximally decreased risk for all cause mortality was associated with BUN values between 5 – 15 mg/dL. In addition, even though a BUN value = 20 mg/dL is technically within the reference range, risk of death for all causes would be 50% higher when compared with someone that had BUN levels between 5 – 15 mg/dL. Collectively, based on the aging and all-cause mortality data, I’d argue that 5 – 13 mg/dL may be the optimal range for BUN.
Assuming normal kidney function (see https://michaellustgarten.wordpress.com/2019/11/18/optimizing-biologic-age-creatinine/), if your BUN is higher than 15 mg/dL, can it be reduced? Note that urea production is almost perfectly correlated (r = 0.98) with dietary protein intake (Young et al. 2000):
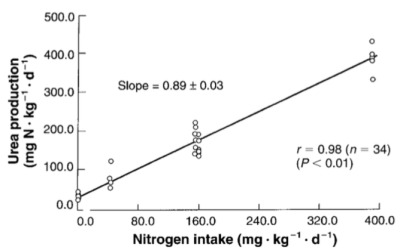
In other words, the main source of dietary nitrogen is protein, so if you eat a lot of protein, you’ll make a lot of urea. Circulating levels of urea can be easily calculated by measuring BUN, via: Urea [mg/dL]= BUN [mg/dL] * 2.14). Therefore, measuring BUN can then be used to determine if your protein intake is too high or too low.
What’s my BUN? As shown below, I’ve measured BUN 22 times since 2015. In line with the Young et al. (2000) data that showed an almost perfectly linear correlation between dietary nitrogen intake with urea production, similarly, as my dietary protein intake has increased, so have my BUN levels. The correlation between my dietary protein intake with BUN is strong (r = 0.76, R^2 = 0.575, p-value = 4.3E-05):

Note that my BUN is (purposefully) below 15 mg/dL, the upper limit for reduced all-cause mortality risk in Solinger and Rothman (2013), and within the 11 – 13 mg/dL range reported for the 20 yr olds of Wang et al. (2017).
For more recent tracked data, see the video!
References
Solinger AB, Rothman SI. Risks of mortality associated with common laboratory tests: a novel, simple and meaningful way to set decision limits from data available in the Electronic Medical Record. Clin Chem Lab Med. 2013 Sep;51(9):1803-13.
Wang Z, Li L, Glicksberg BS, Israel A, Dudley JT, Ma’ayan A. Predicting age by mining electronic medical records with deep learning characterizes differences between chronological and physiological age. J Biomed Inform. 2017 Dec;76:59-68. doi: 10.1016/j.jbi.2017.11.003.
Young VR, El-Khoury AE, Raguso CA, Forslund AH, Hambraeus L. Rates of urea production and hydrolysis and leucine oxidation change linearly over widely varying protein intakes in healthy adults. J Nutr. 2000 Apr;130(4):761-6.
If you’re interested, please have a look at my book!
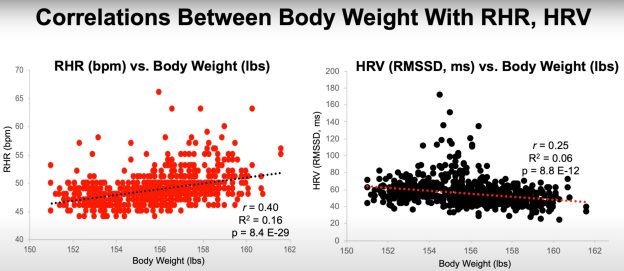
Consistent exercise training would seem like the obvious choice to reduce resting heart rate (RHR) and to increase heart rate variability (HRV). Are there other factors that can impact these variables? Body weight and daily calorie intake may affect RHR and HRV, and in the video I present 700+ days of data for these correlations.
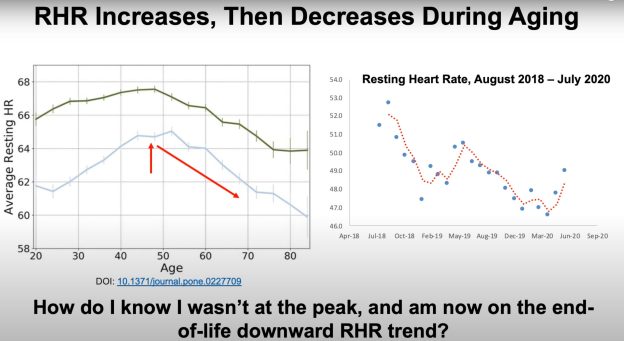
To determine what’s optimal for resting heart rate and heart rate variability, I review the published literature for how they change during aging, and what’s associated with mortality risk. Also included are my data over the past ~2 years, to see how I compare against the literature.
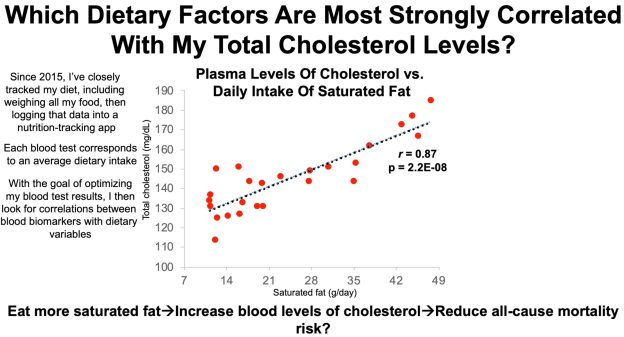
In an earlier video, I presented data for total cholesterol (TC) levels in blood in terms of changes during aging and all-cause mortality risk. I’ve measured TC 25 times in the past 5 years, and in this video, I present that data, and my approach to optimize it.
https://www.youtube.com/watch?v=PBv_hXwUqHM&feature=emb_logo


How much Vitamin C (ascorbic acid) is optimal for health? To answer this question, I’ll examine the association between circulating levels of Vitamin C with all-cause mortality risk. Then, which dietary Vitamin C intake corresponds to optimal plasma levels? Let’s have a look!
A variety of studies have investigated associations between plasma (or serum) Vitamin C with all-cause mortality risk:
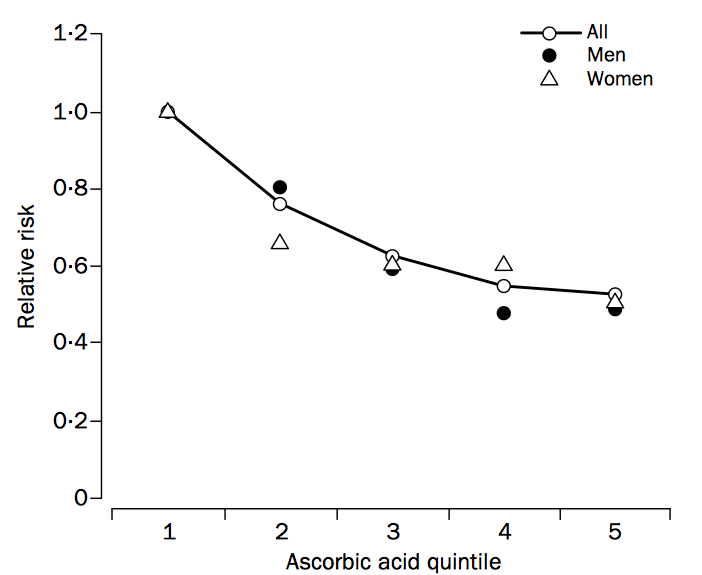
Studies that show weaker or no association between the plasma Vitamin C concentration with all-cause mortality risk include Loria et al. (2000) and Jia et al. (2007). In Loria et al. (2000), 9,450 middle aged adults (~48y) were followed for 12-16 years. Men in the highest Vitamin C quartile (> 74 uM) had significantly reduced all-cause mortality risk, when compared with men in the low plasma Vitamin C group (< 28 uM). Although a similar association was identified for women, significance was lost after multivariable adjustment. In Jia et al. (2007), although plasma Vitamin C values less than 61 uM were associated with increased all-cause mortality risk in older adults (median age, ~80y) that were studied for ~7.5 years, these data were not statistically significant (p-value = 0.18). However, the study sample size (398 subjects) may have been too small to detect significant effects.
Collectively these studies show that low circulating levels of Vitamin C may be related to an increased mortality risk, whereas plasma values greater than ~50 uM are consistently associated with reduced all-cause mortality risk. How much dietary vitamin C is required to attain 50 uM+?
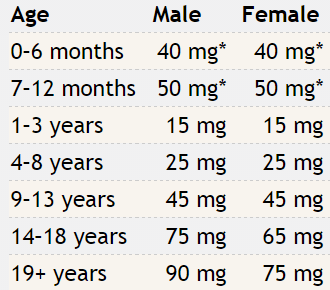
As shown below, the RDA for dietary Vitamin C is 90 mg for males and 75 mg for females older than 19 years (Institute of Medicine 2000).
If you consume the RDA for Vitamin C, what plasma Vitamin C concentration will that yield? Shown below is how the plasma Vitamin C concentration varies according to ingested dose (Levine et al. 1996). Consuming the RDA value for Vitamin C yields a plasma Vitamin C value of 20-30 uM. From the studies listed above, that would put you in the increased all-cause mortality risk group! How much dietary Vitamin C would be needed to achieve plasma values greater than 50 uM? From the plot, we see that a dietary Vitamin C intake at double the RDA would be necessary. Furthermore, because 2 studies have reported decreased all-cause mortality risk at plasma Vitamin C values greater than 66 uM, dietary intakes intake between 500-1000+ mg/day may be necessary:

Which foods are Vitamin C-rich? As shown below, sweet peppers (yellow, red, and green) are the All-Stars for Vitamin C content per 100 calories:

What’s my average daily Vitamin C intake? Shown below is my average daily Vitamin C intake, 971 mg/day (red line) over the past 400+ days:

Note that I don’t supplement with Vitamin C, and that amount is completely from food. Also, I generally split my Vitamin C intake throughout the day, with about 2/3 in the morning and the remaining at night, to try to keep my circulating Vitamin C levels relatively saturated at > 70 uM. I haven’t measured my circulating C levels (yet), but that’s on the to do list!
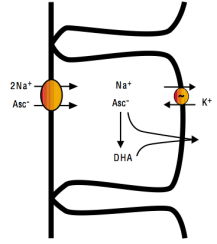
With the goal of optimizing plasma levels of Vitamin C, it is also important to monitor dietary sodium intake. Intestinal absorption of Vitamin C requires dietary sodium (Friedman and Zeidel 1999). As shown below, 1 ascorbate ion (asc-) is absorbed from the intestinal lumen into intestinal epithelial cells in the presence of 2 sodium (Na+) ions. Vitamin C can then diffuse into the blood as Asc- or as dehydroascorbate (DHA):
Accordingly, based on my average dietary Vitamin C intake of 971 mg/day, to maximize absorption, a corresponding dietary sodium intake of 1940 mg would also be necessary.
These data are now in video format!
References
Bates CJ, Hamer M, Mishra GD. Redox-modulatory vitamins and minerals that prospectively predict mortality in older British people:the National Diet and Nutrition Survey of people aged 65 years and over. Br J Nutr. 2011 Jan;105(1):123-32.
Fletcher AE, Breeze E, Shetty PS. Antioxidant vitamins and mortality in older persons: findings from the nutrition add-on study to the Medical Research Council Trial of Assessment and Management of Older People in the Community. Am J Clin Nutr. 2003 Nov;78(5):999-1010.
Friedman PA, Zeidel ML. Victory at C. Nat Med. 1999 Jun;5(6):620-1.
Institute of Medicine. Food and Nutrition Board. Dietary Reference Intakes for Vitamin C, Vitamin E, Selenium, and Carotenoids. Washington, DC: National Academy Press, 2000.
Jia X, Aucott LS, McNeill G. Nutritional status and subsequent all-cause mortality in men and women aged 75 years or over living in the community. Br J Nutr. 2007 Sep;98(3):593-9.
Khaw KT, Bingham S, Welch A, Luben R, Wareham N, Oakes S, Day N. Relation between plasma ascorbic acid and mortality in men and women in EPIC-Norfolk prospective study: a prospective population study. European Prospective Investigation into Cancer and Nutrition. Lancet. 2001 Mar 3;357(9257):657-63.
Levine M, Conry-Cantilena C, Wang Y, Welch RW, Washko PW, Dhariwal KR, Park JB, Lazarev A, Graumlich JF, King J, Cantilena LR. Vitamin C pharmacokinetics in healthy volunteers: evidence for a recommended dietary allowance. Proc Natl Acad Sci U S A. 1996 Apr 16;93(8):3704-9.
Loria CM, Klag MJ, Caulfield LE, Whelton PK. Vitamin C status and mortality in US adults. Am J Clin Nutr. 2000 Jul;72(1):139-45.
Sahyoun NR, Jacques PF, Russell RM. Carotenoids, vitamins C and E, and mortality in an elderly population. Am J Epidemiol. 1996 Sep 1;144(5):501-11.
Simon JA, Hudes ES, Tice JA. Relation of serum ascorbic acid to mortality among US adults. J Am Coll Nutr. 2001 Jun;20(3):255-63.
Wang SM, Fan JH, Taylor PR, Lam TK, Dawsey SM, Qiao YL, Abnet CC. Association of plasma vitamin C concentration to total and cause-specific mortality: a 16-year prospective study in China. J Epidemiol Community Health. 2018 Dec;72(12):1076-1082.

An adequate daily intake of Vitamin K1 is 120 and 90 micrograms/day for males and females, respectively, but are those amounts optimal for health? In this video, I present evidence that consuming more than 1000 micrograms of Vitamin K1/day may be optimal.
