Monthly Archives: February 2020

Blood Testing: What’s Optimal For Triglycerides?

In terms of all-cause mortality risk, is the reference range for circulating triglycerides (TG, <150 mg/dL) optimal?

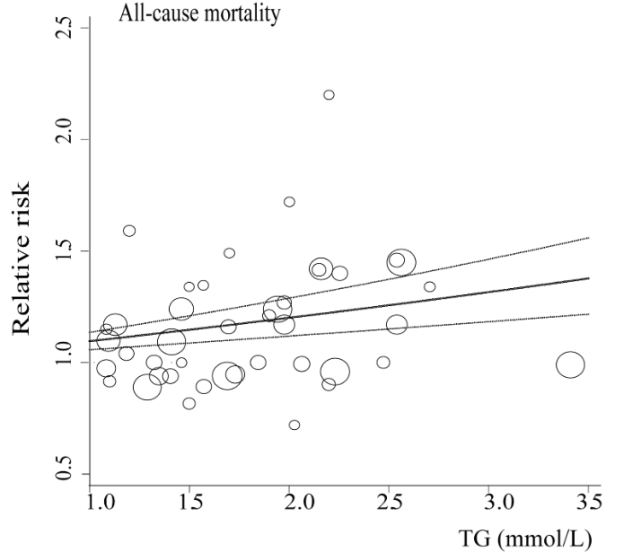
A meta-analysis of 38 studies in 360,556 subjects with a median age of 48y and a 12-year follow-up reported lowest all-cause mortality risk for subjects with TG values less than 90 mg/dL (equivalent to ~1 mmol; Liu et al. 2013). As shown below, each successive 90 mg/dL increase was associated with a 12% higher all-cause mortality risk. A person with a value closer to the high end of the reference range, ~150 would have a ~7% increased mortality risk compared someone with a value ~90. In other words, there would be 7 more deaths per 100 total people at a TG value of 150, compared with the death rate for people with values less than 90.

tg mortal

Added importance for the association between TG values less than 90 with all-cause mortality risk come from studies of people who have lived longer than 100 years, centenarians. As shown below, triglyceride values less than 101 mg/dL have been reported in 9 of 11 centenarian studies:

tg mort

What’s my TG value? As shown below, I’ve measured triglycerides 23 times since 2015, with an average value of 52 mg/dL:tg 2020

With the goal of keeping triglyceride levels low, are there dietary factors that influence it? When compared with my dietary data, the strongest correlation (r = 0.73, R2=0.5339) is present for triglycerides with my calorie intake. In other words, a higher daily calorie intake is associated with higher levels of triglycerides:

tg vs cals 2020

Based on this correlation, should my triglycerides start to rise in the future, a first step would be reducing my average daily calorie intake, which since October 2019 has been ~2550 calories/day.


If you’re interested, please have a look at my book!

References

Liu J, Zeng FF, Liu ZM, Zhang CX, Ling WH, Chen YM. Effects of blood triglycerides on cardiovascular and all-cause mortality: a systematic review and meta-analysis of 61 prospective studies. Lipids Health Dis. 2013 Oct 29;12:159.

Advertisement

Biological Age = 32.75y, Chronological Age = 47y: First 2020 measurement

Measurement of biological age with Levine’s Phenotypic Age calculator is strongly correlated with chronological age (r=0.94; see https://michaellustgarten.wordpress.com/2019/09/09/quantifying-biological-age/). In 2019, I measured all 9 of its analytes 3 times, with biological age readings of 35.39y, 35.58y, and 31.3y, for an average 2019 biological age of 34.09y (see https://michaellustgarten.wordpress.com/2019/11/01/biological-age-31-3y-chronological-age-46y/). That’s 12 years younger than my chronological age in 2019, 46y!

On Feb 12, I had my first blood test measurement of 2020. I expected to see a worse biological age, as over the past week, I’d been hit with the flu, and since my last measurement in 2019, I made a few changes to my diet that I didn’t expect to favorably affect it. In contrast, I’ve been purposefully in a mild caloric restriction in an attempt to reduce my body fat from a relatively lean 10-12% to lower values. Since my last blood test 3+ months ago, my average calorie intake was 2553, which is 5-10% less than my maintenance intake, 2700-2800 calories/day. So how did these variables affect my biologic age? Let’s have a look at the data!

2020 BA

My biological age was 32.75y, which is less than my 2019 average value, and better than I expected considering the factors mentioned above! Note that there is room for improvement, including my creatinine and WBC levels, which both increased when compared with my average 2015-2019 values (which included 23 blood tests). My average daily fiber intake has been ~100g/day for a few years, and over the past 3 months, I purposefully reduced that to ~70g/day. Conversely, I increased my intake of meat, eggs, and cheese intake during that period, to see if eating less fiber and more animal products would negatively impact my blood test results. For me, eating more animal protein and less total fiber may not be optimal, as my creatinine levels also rose in 2019 when I performed a similar dietary experiment. Note that creatinine levels increase with age (see https://michaellustgarten.wordpress.com/2019/11/18/optimizing-biologic-age-creatinine/), so if I can avoid that by altering my diet, I will. For the next blood test, I’ll reduce, but not eliminate my intake of meat, eggs, and cheese, and I expect that my creatinine levels will decrease back towards my average 2015-2019 value of 0.94 mg/dL.

Also note my WBCs-although they’re not higher than the 3.5-6 optimal range (see  https://michaellustgarten.wordpress.com/2019/10/11/blood-testing-whats-optimal-for-wbc-levels/), they’re increased when compared with my average 2015-2019 value of 4.5. This increase is more than likely a result of the flu/infection that I’m battling. Once it passes, I expect it to return to close to my average WBC value, ~4.5.

Going forward, I expect my creatinine and WBCs to come down to their average values, which would result in a biological age that is closer to 30y on my next blood test. Stay tuned for that data!

To quantify your biological age using Levine’s Phenotypic Age calculator, here’s the Excel link! DNAmPhenoAge_gen (1)

If you’re interested, please have a look at my book!

Resting Heart Rate, Heart Rate Variability: January 2020 Update

How’s my progress on the road to achieving a resting heart rate (RHR) as close to 40 beats per minute (bpm) as possible? Shown below is my RHR data for August 2018-Jan 2019, which corresponds to the 6-month period after I started tracking RHR. When compared with that period, am I still making year-over-year progress?

jan hr

First, note that my Jan 2019 RHR value of 47.4 bpm seems dramatically reduced when compared with Aug-Dec 2018. My computer crashed in Jan 2019, and I lost 4 days of January 2019 RHR data, with remaining data for 27 days. Accordingly, I didn’t expect to be better than that, year-over-year. Nonetheless,  my average RHR for Jan 2020 is 46.9 bpm, which is superficially better, but it isn’t statistically different from Jan 2019 (p = 0.13). However, my RHR is still going in the right direction!

What about my heart rate variability (HRV)? Relative to Jan 2019 (56.6), my HRV in Jan 2020 was significantly higher (76; p=0.003), but note that I didn’t additionally improve my HRV relative to December 2019 (86.3).

hrvjan2

I’ve been consistent with my exercise program, including weekly workouts (3-4x, ~1 hr each session) and walking (15-20 miles), so are there other variables that may explain the sudden increase in HRV from Nov 2019-Jan 2020? During that time, I’ve been cutting my calorie intake by a small amount (~100-200 cals/day) below my body weight maintenance intake, with the goal of getting leaner. As a result, I’ve slowly decreased my body weight from 157 to 154 during that time. Although there is a weak negative correlation between my body weight with HRV (R2=0.0553), this association is statistically significant (p=0.024). So reducing body weight may have played a role in the sudden HRV increase:

hrv bw

For those who may have missed my other post updates for RHR and/or HRV:
Dec 2019 update: https://michaellustgarten.wordpress.com/2020/01/01/resting-heart-rate-heart-rate-variability-december-2019-update/

Oct, Nov 2019 update: https://michaellustgarten.wordpress.com/2019/12/05/resting-heart-rate-heart-rate-variability-still-making-progress/

Sept 2019 update: https://michaellustgarten.wordpress.com/2019/10/08/resting-heart-rate-year-over-year-update/

Also, why a RHR as close to 40 bpm may be optimal: https://michaellustgarten.wordpress.com/2019/02/02/resting-heart-rate-whats-optimal/


If you’re interested, please have a look at my book!