Category Archives: albumin

Albumin: What’s Optimal For Youth And Health? (2022 Update)

Join us on Patreon! https://www.patreon.com/MichaelLustgartenPhD

Cronometer Discount Link:

https://shareasale.com/r.cfm?b=1390137&u=3266601&m=61121&urllink=&afftrack=

Papers referenced in the video:

Age and sex variation in serum albumin concentration: an observational study https://pubmed.ncbi.nlm.nih.gov/26071488/

Commonly used clinical chemistry tests as mortality predictors: Results from two large cohort studies https://pubmed.ncbi.nlm.nih.gov/33152050/

Calculate your biological age with Levine’s test using the downloadable Excel file in this link: https://michaellustgarten.com/2019/09/09/quantifying-biological-age/

Advertisement

Quantifying Biological Age: Blood Test #5 in 2020

My latest blood test results are in-how’s my biological age?

In the video I discuss my dietary approach prior to my latest blood test, the blood test results, and my plan to improve them with diet going forward.

Biological Age: Optimal On A Carnivore Diet?

After going on Joe Rogan’s podcast, Paul Saladino, MD, posted his show notes, which included his blood test results. Based on that data, is his biological age optimal while on a carnivore diet?

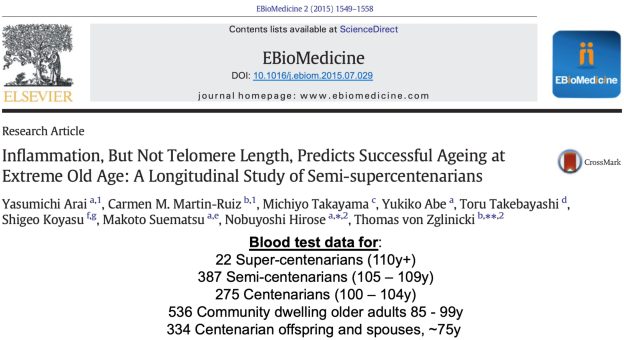
Blood Test Analysis: 100 – 111y (Centenarians, Semi- and Super-Centenarians)

In order to slow aging, it’s important to know how circulating biomarkers change during aging, and how these biomarkers are associated with risk of death for all causes. In this video, I discuss blood test data for the oldest old, including centenarians (100 – 104y), semi-centenarians (105 – 109y), and super-centenarians (110y+).


Biological Age Test #4 in 2020: Getting Better or Getting Worse?

My latest blood test results are in-how’s my biological age? In the video I discuss my dietary approach prior to my latest blood test, the blood test results, and my plan to improve them going forward.

Quantifying Biological Age: Blood Test Measurement #3 in 2020

In this video, I discuss data for 6 blood test measurements since 2018 that show a Phenotypic (Biological) Age that is ~14 years than my current age (47y).
 

Quantifying Biological Age: Checklist

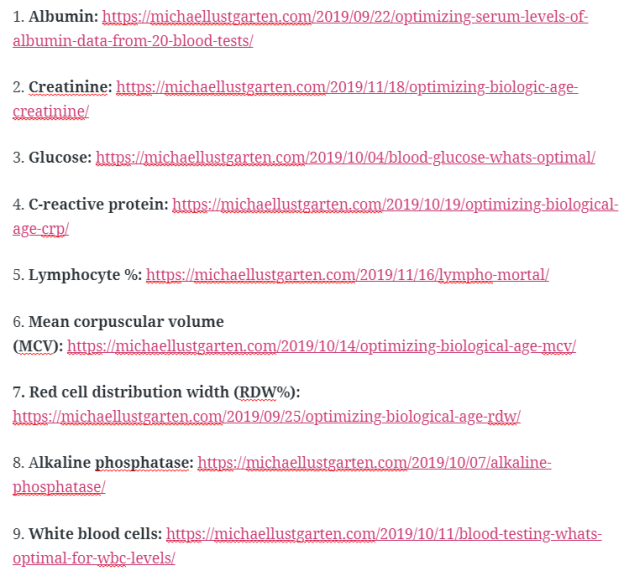
To make it easier to review the aging and all-cause mortality data for the circulating biomarkers that are contained within the biological age calculator, Phenotypic Age (see https://michaellustgarten.wordpress.com/2019/09/09/quantifying-biological-age/), here’s a checklist!

1. Albumin: https://michaellustgarten.wordpress.com/2019/09/22/optimizing-serum-levels-of-albumin-data-from-20-blood-tests/

2. Creatinine: https://michaellustgarten.wordpress.com/2019/11/18/optimizing-biologic-age-creatinine/

3. Glucose: https://michaellustgarten.wordpress.com/2019/10/04/blood-glucose-whats-optimal/

4. C-reactive protein: https://michaellustgarten.wordpress.com/2019/10/19/optimizing-biological-age-crp/

5. Lymphocyte %: https://michaellustgarten.wordpress.com/2019/11/16/lympho-mortal/

6. Mean corpuscular volume (MCV):  https://michaellustgarten.wordpress.com/2019/10/14/optimizing-biological-age-mcv/

7. Red cell distribution width (RDW%): https://michaellustgarten.wordpress.com/2019/09/25/optimizing-biological-age-rdw/

8. Alkaline phosphatase: https://michaellustgarten.wordpress.com/2019/10/07/alkaline-phosphatase/

9. White blood cells: https://michaellustgarten.wordpress.com/2019/10/11/blood-testing-whats-optimal-for-wbc-levels/


1.7 Years of Biological Aging In The Past 3.6 Years

In an earlier post (https://michaellustgarten.wordpress.com/2018/06/26/maximizing-health-and-lifespan-is-calorie-restriction-essential/), I documented my aging.ai biologic age for 13 blood test measurements from 2016 – 2019. If you missed that post, here are those data:
agingai2Note that note my average biologic age has slowly increased from 2016 to 2019, from 28y in 2016 (2 measurements), to 29.25y in 2017 (6 measurements), to 29.5y in 2018 (6 measurements), to 30y in my June 2019 measurement.

To gain more insight into my 2019 prediction for biologic age, I kept measuring. On September 17, 2019, I had my worst biological age to date, 33y, based on the blood test data below:
Screen Shot 2019-11-03 at 3.51.05 PM.png

Seeing a biological age that high (for me) was the motivation that I needed to finally stick to a mild caloric restriction, which I hypothesized would positively affect my biological age. I wrote about this in my recent Phenotypic Age post (https://michaellustgarten.wordpress.com/2019/11/01/biological-age-31-3y-chronological-age-46y/). Did it work? Shown below is my blood test data for October 29th.

Screen Shot 2019-11-03 at 4.07.28 PM

Based on that data, my biological age was 28y, and when averaging the 3 measurements in 2019 (so far!), my average biological age is 29.67y. When considering that my average biological age in 2016 was 28y, it looks like I’ve only aged ~1.7 years in 3.58 years of elapsed time!


If you’re interested, please have a look at my book!