
In an earlier post, I wrote about quantifying my biological age with aging.ai (https://michaellustgarten.wordpress.com/2018/06/26/maximizing-health-and-lifespan-is-calorie-restriction-essential/). The importance of that post is illustrated by the finding that based on data from 13 blood tests between 2016 – 2019, my average biological age is 29.2y, which is ~33% younger than my chronological age.
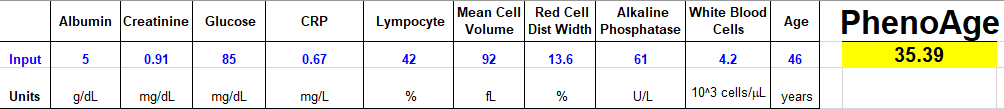
On my quest for optimal health, I’m striving to get as accurate as possible when it comes to quantifying biological age. While the aging.ai biomarker set is strongly correlated with biologic age (r = 0.80), in 2018 two papers were published (Liu et al., Levine et al.) that introduced “Phenotypic Age”, which includes a combination of 9 circulating biomarkers + chronological age that is better at predicting biological age (r = 0.94) than aging.ai. It includes analytes that are found on the standard blood chemistry screen, including albumin, creatinine, glucose, lymphocyte %, mean corpuscular volume (MCV), red blood cell distribution width (RDW), alkaline phosphatase, white blood cells, and an analyte that is not found on that panel, C-reactive protein (CRP). In addition, chronological age is included as a covariate.
So what’s my biological age based on the Phenotypic Age calculator? When I input my data from my latest blood test measurement on 6/4/2019, I get a biological age of 35.39y, which is 23% lower than my chronological age of 46. Not bad!
To quantify your biological age with the Phenotypic Age calculator, input your data in the Excel file that is embedded within the first paragraph of the following link:
3.27.25 Edit: In the link above, note that the denominator in D17 should be 0.090165, not 0.09165. Additionally, the units for albumin should be g/dL (not mg/dL), and lymphocyte isn’t spelled correctly. I can’t upload a new link-I’d have to upgrade my WordPress account to be able to upload files (which is ridiculous!).
If you’re interested, please have a look at my book!
References
Liu Z, Kuo PL, Horvath S, Crimmins E, Ferrucci L, Levine M. A new aging measure captures morbidity and mortality riskacross diverse subpopulations from NHANES IV: A cohort study. PLoS Med. 2018 Dec 31;15(12):e1002718. doi: 10.1371/journal.pmed.1002718.
Levine ME, Lu AT, Quach A, Chen BH, Assimes TL, Bandinelli S, Hou L, Baccarelli AA, Stewart JD, Li Y, Whitsel EA, Wilson JG, Reiner AP, Aviv A, Lohman K, Liu Y, Ferrucci L, Horvath S. An epigenetic biomarker of aging for lifespan and healthspan. Aging (Albany NY). 2018 Apr 18;10(4):573-591. doi: 10.18632/aging.101414.

Isn’t this simply a limited view of your “blood age” compared to people eating the Standard American Diet?
Which doesn’t factor in things like creatine supplementation, whether you worked out the same day as your blood test (potentially increasing CRP) or other confounders.
Is it saying much beyond than high glucose correlated = bad? Higher albumin = good etc? Where’s LDL particle count for instance, the marker we AFAIK belive is the leading one for development of atherosclerosis?
Seems like many variables independent of these measurements could point to different biological ages – different tissues could have different biological age profiles. It doesn’t seem useful to generate an overall biological age score just from this, it feels dishonest to me.
Good to see more research done on blood biomarkers which could help us optimize them, but I do feel the results are being oversold. I remember changing one factor in the aging.ai calc 50% resulting in a ~20 year biological age difference. Not an expert on this topic, so consider these lay observations.
LikeLike
I see what you are saying, but its paving the way forward.
LikeLike
You’re ignoring the diligence used to derive PhenoAge. Here’s the paper:
https://journals.plos.org/plosmedicine/article/file?id=10.1371/journal.pmed.1002718&type=printable
LikeLike
Was hoping you had read it so you could tell me where I’m going wrong, instead of waving me over to the paper 😉 See if I can get around to it this weekend!
LikeLike
Pingback: Optimizing Biological Age: RDW% – Michael Lustgarten
Pingback: Quantifying Biological Age: Alkaline Phosphatase – Michael Lustgarten
I want to point out that the spreadsheet you’re linking to does not calculate your PhenoAge but your Phenotypic Age.
Both are defined in the article by Morgan Levine, and while Phenotypic Age is a combination of 9 blood biomarkers + chronological age, PhenoAge (or more correctly DNAm PhenoAge) is a combination of the DNA methylation value of 513 specific CpG sites. They both try to estimate your “biological age”, and will yield similar results but are not the same.
If you want to calculate your DNAm PhenoAge you need to measure the DNA methylation levels of your white blood cells and run it through the DNAm PhenoAge algorithm.
LikeLike
Thanks for that, Espen, I corrected it in my post!
LikeLike
Also, I corrected my post!
LikeLike
Thanks for sharing these resources Michael!
LikeLike
Pingback: Life Expectancy Increase (12-14 Years) With 5 Factors – Michael Lustgarten
Which are the reference values to calculate the biological age of someone? Where are them coming from? How healthy are the people for such values?
LikeLike
The published manuscript references are at the bottom of every post.
LikeLike
Thanks for the helpful information. Can the spreadsheet you posted be used for women as well given that the reference ranges are different?
LikeLike
Hi Natasha, yes, it can be used from women-the data was derived from NHANES III, which included data for men and women.
LikeLike
Very interesting, thanks Michael. Do you know if I can use this biological age calculator on my blog/social media for my followers? I was thinking it’s Dr. Levine’s and other people’s work and they would be the only ones allowed to distribute the equation.
LikeLike
Levine’s group published their algorithm for measuring biological age-it’s not proprietary info. So thankfully, we can all use it! Feel free to post it wherever you like…
LikeLike
Pingback: 20 Best Aging Biomarkers to Track for Longevity - Longevity Advice
Pingback: 6 Best Biological Age Tests for 2021 - Longevity Advice
Pingback: Quantifying Biological Age: Blood Test #1 in 2021 – Michael Lustgarten
Pingback: Quantifying Biological Age: Blood Test #1 in 2021
Hi Michael, I was doind some tests with the spreadsheet. Using your blood test values shown in this post and inserting them to the linked excel spreadheet gives me a different Phenotypic Age score (37.11) than the one you show us here (35.39). Could you please check this out and let me know? Thank you!
LikeLike
Hey Nikos, the Excel spreadsheet that is on this page uses the corrected formula. The denominator for column D17 should be 0.09165, which was published here:
https://journals.plos.org/plosmedicine/article?id=10.1371/journal.pmed.1002760
LikeLiked by 1 person
Pingback: Quantifying Biological Age: Blood Test #4 in 2021 – Michael Lustgarten
Pingback: Quantifying Biological Age: Blood Test #4 in 2021
For anyone who either prefers Google sheets or doesn’t have Excel, I wrote a custom function for Google sheets that calculates biological age at https://script.google.com/u/0/home/projects/1K6O05-Vdr68hN6IQU3rROw08Pyi4mCv8Wc0NSVu-XXIgxC-mvb6RDP9g/edit, used in the spreadsheet at https://docs.google.com/spreadsheets/d/1ZhbaKATK2hERSFHq21pJ1fqn-EVKtMqIU1iv2Z01_EY/edit?usp=sharing. This has the added plus of taking up less spreadsheet space, which makes it easier to track results across multiple tests.
One peculiarity is that I’m getting a very low biological age for my own data (in the sheet). This matches the result I get from the original sheet linked in this post (converted to google sheets): https://docs.google.com/spreadsheets/d/1rzcPDl0aprLzBQNJf8B7vH6MpiQ4A3_qC3wEgQER2dY/edit?usp=sharing. I’m curious if anyone with the excel sheet can plug in my numbers and see if they also get this strange result.
LikeLike
Hi Kovas, sorry about the delay-I respond to all messages on Patreon, if that interests you.
Your data looks ok in the spreadsheet, the key is to not focus not just on the absolute age, but the age reduction, too, which is about 10y for this test.
LikeLiked by 1 person
Dear Michael, have you thought about why the model includes glucose but not insulin? Wouldn’t you agree that there can be two individuals with the same blood glucose level but the one that achieves it at the expense of a higher insulin level is in worse health. I think that HOMA-1 and HOMA-2 models should be standard tools for gauging glucose metabolism and yet we know many doctors do not request insulin tests, delaying the diagnosis of insulin resistance/T2D. A bit disappointed that the biological age model you shared in the spreadsheet also overlooks insulin and therefore, in my opinion, falls short of acknowledging that the relative (rather than absolute) glucose level is probably more insightful as a marker of health/age. Any thoughts on this from your perspective?
LikeLike
Hey Vladimir, I definitely agree with everything that you said about measuring insulin. Unfortunately, insulin is not commonly performed on standard blood tests in the US, so there was likely limited data for it.
LikeLiked by 1 person
Pingback: Albumin: What's Optimal For Youth And Health? (2022 Update) - Green Side
Your spreadsheet asks for Albumin in Units mg/dL, but I believe the test is typically g/dL. The spreadsheet works if you input a g/dL number, but fails if you use a g/dL number. Can you double-check that cell B6 has the correct units?
LikeLiked by 1 person
It should be g/dL in the spreadsheet-mg/dL is an error
LikeLike
Pingback: Exploring Biological Age Optimization with On Deck Longevity Biotech Presentation – Die Trying Die Young
Pingback: 解锁您的生理年龄:2022 年及以后的血液测试 #4 – 羔羊组
Pingback: 揭开生物衰老的秘密:探索 2021 年血液测试 #5 – 羔羊组
Pingback: 解锁您的生理年龄:2022 年第 2 次血液测试以监测补充剂和心血管健康 – 羔羊组
Pingback: 揭开您健康的秘密:2022 年第 4 次血液测试,用于补充剂和饮食追踪 – 羔羊组
Pingback: 揭示您的真实年龄:2021 年通过测试 #6 量化生理年龄 – 羔羊组
Pingback: 解锁您的生理年龄:在 2022 年尝试 Levine 的血液测试 #2! – 羔羊组
Pingback: 探索降低高敏 C 反应蛋白 (hs-CRP) 和降低生理年龄的策略 – 羔羊组
Pingback: Unlocking the Secrets of Biological Age: Blood Test #3 in 2022 – Join us on Patreon! – Die Trying Die Young
Pingback: Unlocking the Secrets of Aging with Blood Test #4: Exploring Levine’s Biological Age Calculator and Senotherapeutics – Die Trying Die Young
Pingback: Exploring the Possibility of Lowering Glucose Levels to Combat Aging without Compromising Other Biomarkers – Die Trying Die Young
Pingback: Unlock Your Biological Age: Blood Test #4 in 2022 and Beyond – We Gene
Pingback: Uncovering the Secrets of Biological Aging: Exploring Blood Test #5 in 2021 – We Gene
Pingback: Unlock the Secrets of Quantifying Biological Age with Test #35 in 2022! – We Gene
Pingback: Unlocking the Secrets of Aging with Blood Test #4: Exploring Levine’s Biological Age Calculator and Senotherapeutics – We Gene
Pingback: The 35th blood test since 2015 to quantify biological age – Change Our Gene
Pingback: 2015年以来第35次验血量化生理年龄 – 羔羊组
Pingback: Levine’s Calculator and Blood Test # 2 in 2022: Measuring Biological Age – Change Our Gene
Pingback: Blood Test #2: Unlocking Your Diet Secrets in 2022 – Die Trying Die Young
Pingback: 验血 #2:在 2022 年解开你的饮食秘密 – 大洋大川生命
Pingback: Explore the 5th Blood Test in 2021 to Unlock the Secrets of Aging – Die Trying Die Young
Pingback: 探索2021年第5次验血揭开衰老的秘密 – 大洋大川生命
Pingback: How to calculate my biological age in 2021: Analyzing my blood test results – Die Trying Die Young
Pingback: Quantifying Biological Age – Unlocking the potential of blood test #4 in 2022 – Die Trying Die Young
Pingback: How Fast Are You Aging? Your Fingernails May Reveal the Answer - New Life Longevity
Pingback: My Latest Blood Test Results: April 2024 - New Life Longevity
Pingback: Lowering Blood Glucose to Significantly Lower Your Mortality Score - New Life Longevity
Pingback: My Current Anti-Aging Protocol (January 2025) - New Life Longevity