
Platelets are one of the 19 variables that are included in the biological age calculator, aging.ai. The reference range is 150-400 platelets per nanoliter (*10^9/L), but within that range, what’s optimal?
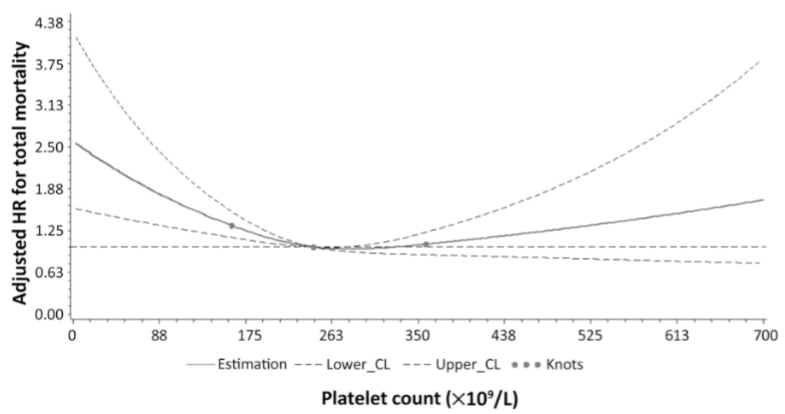
In a study of 21,635 adults older than 35y (average age wasn’t reported), platelets between 230-270 were associated with a maximally reduced risk of death from all causes (Bonaccio et al. 2016):
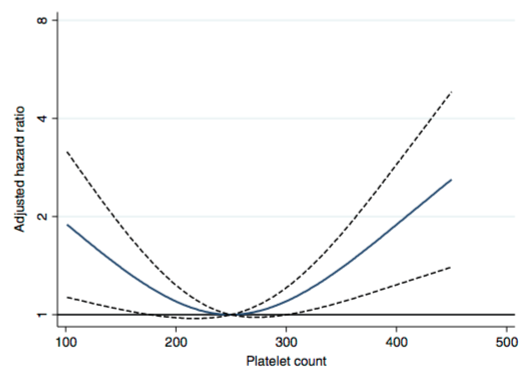
Similarly, in a study of 21,252 adults (average age 53y), values ~250 were associated with maximally reduced risk of death from all causes Vinholt et al. (2017) :
What about in older adults? In a study of 159,746 postmenopausal women (average age, 63y), maximally reduced risk of death from all causes was associated with platelet values between 200-256 (Kabat et al. 2017).
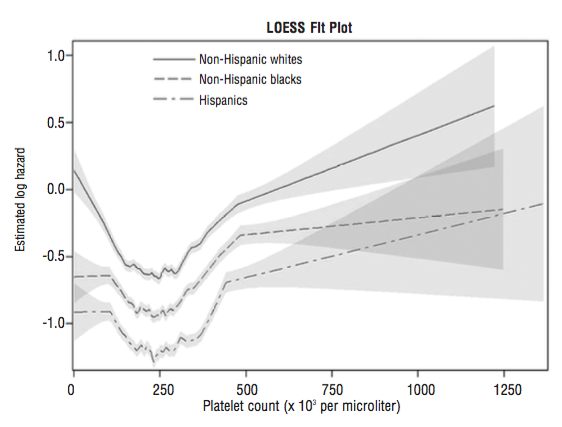
In a smaller study (36,262 older adults, average age, 71y), platelet values ~250 were associated with maximally reduced risk for all-cause mortality. Interestingly, even at platelet values ~250, mortality risk was highest for non-Hispanic whites, when compared with lower mortality risk for non-Hispanic blacks and Hispanics (Msaouel et al. 2014):
In 5,766 older adults (average age, 73y), platelets higher than 200-300 was associated with an increased risk of death from all causes (van der Bom et al 2009). Risk for values between 100-199 was not different when compared against 200-299, but there was a non-significant trend towards increased risk (1.05, 95% CI: 0.97, 1.14).
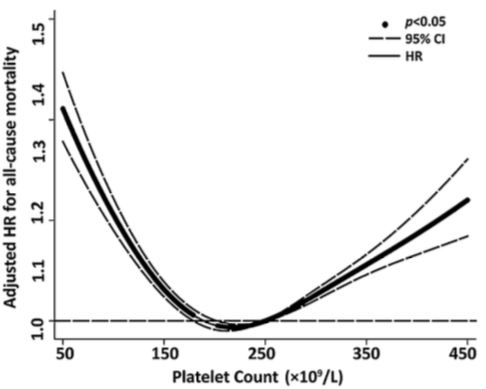
In 131,308 older adults (~73y), maximally reduced risk of death from all causes was associated with platelet values between 200-300, whereas risk significantly increased below and above that range, respectively Tsai et al. (2015):
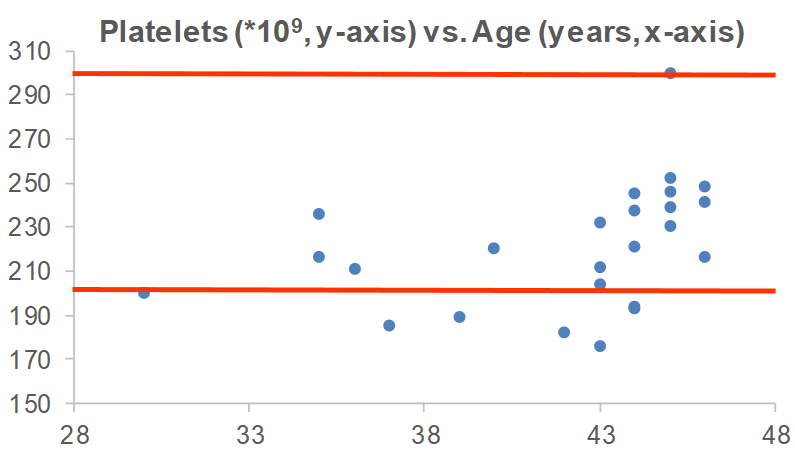
In sum, the data suggests that platelet values ~250 may be optimal for heath, with 200-300 as the “optimal range” within the 150-400 reference range. What are my values? Over the past 16 years, I’ve measured my platelets 25 times, and 6x, my platelets were below this 200-300 range. I’m not too worried about it, though, as most of my measurements are within that range!
Are there any variables that are correlated with platelets? For me, the strongest correlation over 18 tracked blood tests from 2015 – 2019 is my body weight. As my weight increases, my platelets are higher (r = 0.64, p-value = 0.006). Platelets have been reported to increase in association with elevated inflammation (CRP; Izzi et al. 2018), but I only have 3 co-measurements for CRP with platelets. I have a blood test scheduled for next week, more data coming soon!
If you’re interested, please have a look at my book!
References
Bonaccio M, Di Castelnuovo A, Costanzo S, De Curtis A, Donati MB, Cerletti C, de Gaetano G, Iacoviello L; MOLI-SANI Investigators. Age-sex-specific ranges of platelet count and all-cause mortality: prospective findings from the MOLI-SANI study. Blood. 2016 Mar 24;127(12):1614-6.
Izzi B, Bonaccio M, de Gaetano G, Cerletti C. Learning by counting blood platelets in population studies: survey and perspective a long way after Bizzozero. J Thromb Haemost. 2018 Sep;16(9):1711-1721. doi: 10.1111/jth.14202.
Kabat GC, Kim MY, Verma AK, Manson JE, Lin J, Lessin L, Wassertheil-Smoller S, Rohan TE. Platelet count and total and cause-specific mortality in the Women’s Health Initiative. Ann Epidemiol. 2017 Apr;27(4):274-280.
Msaouel P, Lam AP, Gundabolu K, Chrysofakis G, Yu Y, Mantzaris I, Friedman E, Verma A. Abnormal platelet count is an independent predictor of mortality in the elderly and is influenced by ethnicity. Haematologica. 2014 May;99(5):930-6.
Tsai MT, Chen YT, Lin CH, Huang TP, Tarng DC; Taiwan Geriatric Kidney Disease Research Group. U-shaped mortality curve associated with platelet count among older people: a community-based cohort study. Blood. 2015 Sep 24;126(13):1633-5.
Vinholt PJ, Hvas AM, Frederiksen H, Bathum L, Jørgensen MK, Nybo M. Thromb Res.Platelet count is associated with cardiovascular disease, cancer and mortality: A population-based cohort study. 2016 Dec;148:136-142.

Mike, my platelets have been low-ish. Here are my last several platelet measurements from oldest to most recent: 222, 183, 189, 197, 183, 172. I’m now researching how to raise them.
LikeLike
Have your WBCs and differentials trended down, too? Also it would be good to have some inflammatory marker data to correlate with platelets, to see if the down trend is consequential or not.
LikeLike
WBCs and differentials (Im assuming that means subtypes of WBCs?) have been pretty stable.
I think it may be related to folate, because that’s something I’ve had issues with before, and I took a methylfolate supplement (400mcg) everyday for the last month and retested, and the newest results as of yesterday show the platelets bumped up.
I read that folate status affects platelets. So it could be that for me.
LikeLike
Specifically, latest results show platelets at 207, higher than the last 5 measurements.
LikeLike
Hello Dr. Lustgarten.
This question is off topic, but I didn’t see any other way to send you a question.
Do you know of an all-cause-mortality curve for riboflavin intake? I’ve seen such curves for other nutrients (some of which you have posted on your blog) but none for vitamin B2.
Thanks!
LikeLike
Hey Greg, I don’t. But here’s the Pubmed page to search that!
https://www.ncbi.nlm.nih.gov/pubmed/?term=%22riboflavin%22+%22all+cause+mortality%22
LikeLike