VIDEO
Join us on Patreon! https://www.patreon.com/MichaelLustgartenPhD
Discount Links/Affiliates: At-Home Metabolomics:https://iollo.com?ref=michael-lustgarten Use Code: CONQUERAGING At Checkout Blood testing (where I get my labs): https://www.ultalabtests.com/partners/michaellustgarten NAD+ Quantification: https://www.jinfiniti.com/intracellular-nad-test/ Use Code: ConquerAging At Checkout Telomere and Epigenetic Testing: Trudiagnostic.pxf.io/R55XDv Use Code: CONQUERAGING At-Home Metabolomics: https://iollo.com?ref=michael-lustgarten Use Code: CONQUERAGING At Checkout Oral Microbiome: https://www.bristlehealth.com/?ref=michaellustgarten Enter Code: ConquerAging
Green Tea: https://www.ochaandco.com/?ref=fqbtflod Use Discount Code: MLOFF10
At-Home Blood Testing (SiPhox Health): https://getquantify.io/mlustgarten
Diet Tracking (Cronometer): https://shareasale.com/r.cfm?b=1390137&u=3266601&m=61121&urllink=&afftrack=
If you’d like to support the channel, you can do that with the website, Buy Me A Coffee: https://www.buymeacoffee.com/mlhnrca
Conquer Aging Or Die Trying Merch! https://my-store-d4e7df.creator-spring.com/ Papers referenced in the video: https://pubmed.ncbi.nlm.nih.gov/38095562/
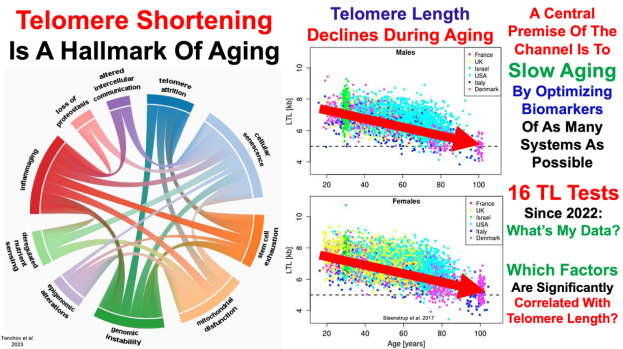
Telomeres and the natural lifespan limit in humans https://pubmed.ncbi.nlm.nih.gov/28394764/
DNA methylation-based estimator of telomere length https://www.ncbi.nlm.nih.gov/pmc/articles/PMC6738410/