Here’s my latest video!
Join us on Patreon! https://www.patreon.com/MichaelLustgartenPhD

Papers referenced in the video:
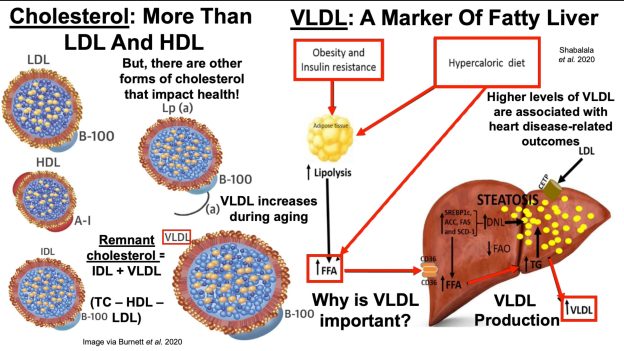
Remnant Cholesterol and Atherosclerotic Cardiovascular Disease Risk: https://www.jacc.org/doi/10.1016/j.ja…
The effect of adiponectin in the pathogenesis of non-alcoholic fatty liver disease (NAFLD) and the potential role of polyphenols in the modulation of adiponectin signaling: https://www.sciencedirect.com/science…
Joint distribution of lipoprotein cholesterol classes. The Framingham study: https://pubmed.ncbi.nlm.nih.gov/6573877/
Long-term coronary heart disease risk associated with very-low-density lipoprotein cholesterol in Chinese: the results of a 15-Year Chinese Multi-Provincial Cohort Study (CMCS): https://pubmed.ncbi.nlm.nih.gov/20223…
Remnant Cholesterol, Not LDL Cholesterol, Is Associated With Incident Cardiovascular Disease: https://pubmed.ncbi.nlm.nih.gov/33272…
Remnant cholesterol and coronary atherosclerotic plaque burden assessed by computed tomography coronary angiography: https://pubmed.ncbi.nlm.nih.gov/30870…
Premature myocardial infarction is strongly associated with increased levels of remnant cholesterol: https://pubmed.ncbi.nlm.nih.gov/26687…
Papers referenced in the video:
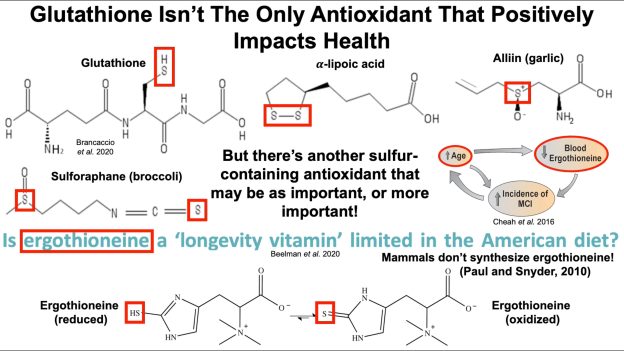
Dietary Thiols: A Potential Supporting Strategy against Oxidative Stress in Heart Failure and Muscular Damage during Sports Activity: https://www.ncbi.nlm.nih.gov/pmc/arti…
Ergothioneine levels in an elderly population decrease with age and incidence of cognitive decline; a risk factor for neurodegeneration? https://pubmed.ncbi.nlm.nih.gov/27444…
Is ergothioneine a ‘longevity vitamin’ limited in the American diet? https://www.ncbi.nlm.nih.gov/pmc/arti…
Frailty markers comprise blood metabolites involved in antioxidation, cognition, and mobility: https://pubmed.ncbi.nlm.nih.gov/32295…
Ergothioneine is associated with reduced mortality and decreased risk of cardiovascular disease: https://pubmed.ncbi.nlm.nih.gov/31672…
Ergothioneine – a diet‐derived antioxidant with therapeutic potential: https://febs.onlinelibrary.wiley.com/…
Ergothioneine, a metabolite of the gut bacterium Lactobacillus reuteri, protects against stress-induced sleep disturbances: https://www.nature.com/articles/s4139…

Platelets are one of the 19 variables that are included in the biological age calculator, aging.ai. The reference range is 150-400 platelets per nanoliter (*10^9/L), but within that range, what’s optimal?
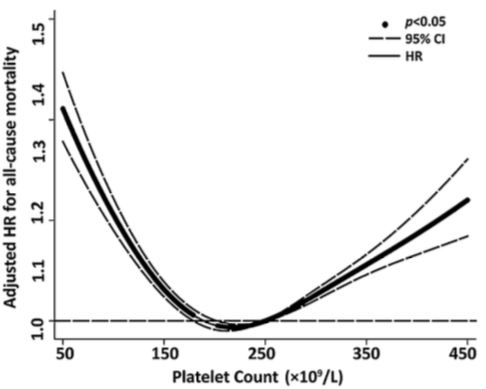
In a study of 21,635 adults older than 35y (average age wasn’t reported), platelets between 230-270 were associated with a maximally reduced risk of death from all causes (Bonaccio et al. 2016):
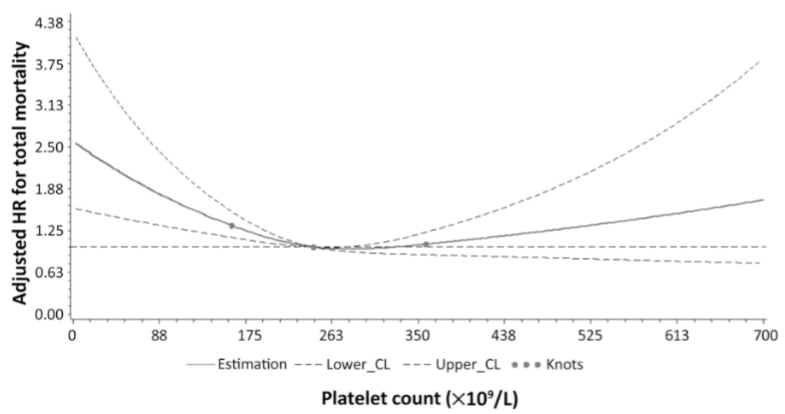
Similarly, in a study of 21,252 adults (average age 53y), values ~250 were associated with maximally reduced risk of death from all causes Vinholt et al. (2017) :
What about in older adults? In a study of 159,746 postmenopausal women (average age, 63y), maximally reduced risk of death from all causes was associated with platelet values between 200-256 (Kabat et al. 2017).
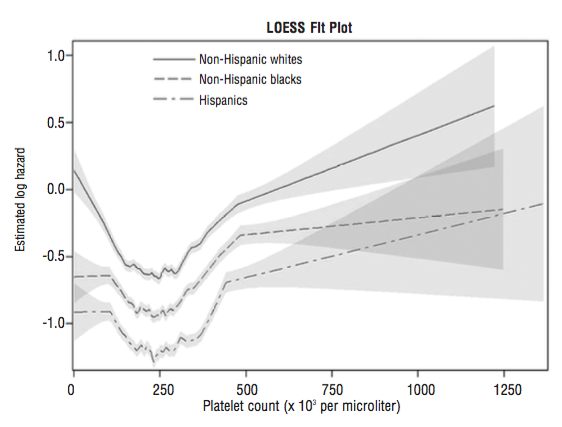
In a smaller study (36,262 older adults, average age, 71y), platelet values ~250 were associated with maximally reduced risk for all-cause mortality. Interestingly, even at platelet values ~250, mortality risk was highest for non-Hispanic whites, when compared with lower mortality risk for non-Hispanic blacks and Hispanics (Msaouel et al. 2014):
In 5,766 older adults (average age, 73y), platelets higher than 200-300 was associated with an increased risk of death from all causes (van der Bom et al 2009). Risk for values between 100-199 was not different when compared against 200-299, but there was a non-significant trend towards increased risk (1.05, 95% CI: 0.97, 1.14).
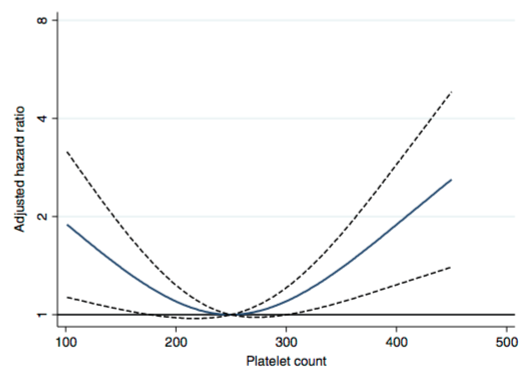
In 131,308 older adults (~73y), maximally reduced risk of death from all causes was associated with platelet values between 200-300, whereas risk significantly increased below and above that range, respectively Tsai et al. (2015):
In sum, the data suggests that platelet values ~250 may be optimal for heath, with 200-300 as the “optimal range” within the 150-400 reference range. What are my values? Over the past 16 years, I’ve measured my platelets 25 times, and 6x, my platelets were below this 200-300 range. I’m not too worried about it, though, as most of my measurements are within that range!
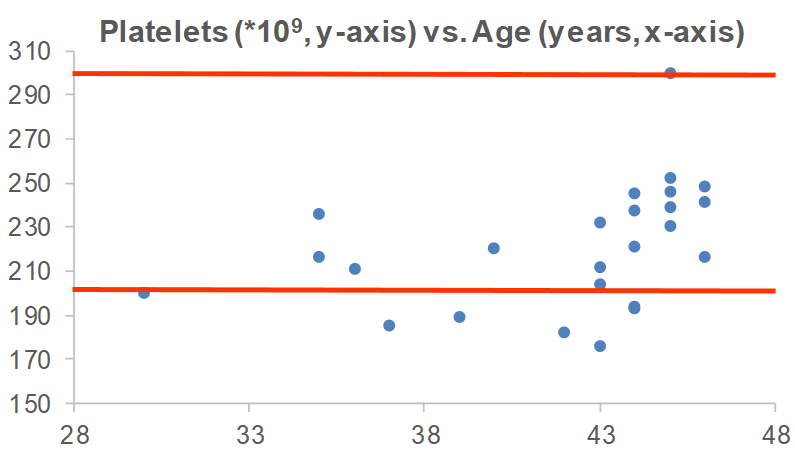
Are there any variables that are correlated with platelets? For me, the strongest correlation over 18 tracked blood tests from 2015 – 2019 is my body weight. As my weight increases, my platelets are higher (r = 0.64, p-value = 0.006). Platelets have been reported to increase in association with elevated inflammation (CRP; Izzi et al. 2018), but I only have 3 co-measurements for CRP with platelets. I have a blood test scheduled for next week, more data coming soon!
If you’re interested, please have a look at my book!
References
Bonaccio M, Di Castelnuovo A, Costanzo S, De Curtis A, Donati MB, Cerletti C, de Gaetano G, Iacoviello L; MOLI-SANI Investigators. Age-sex-specific ranges of platelet count and all-cause mortality: prospective findings from the MOLI-SANI study. Blood. 2016 Mar 24;127(12):1614-6.
Izzi B, Bonaccio M, de Gaetano G, Cerletti C. Learning by counting blood platelets in population studies: survey and perspective a long way after Bizzozero. J Thromb Haemost. 2018 Sep;16(9):1711-1721. doi: 10.1111/jth.14202.
Kabat GC, Kim MY, Verma AK, Manson JE, Lin J, Lessin L, Wassertheil-Smoller S, Rohan TE. Platelet count and total and cause-specific mortality in the Women’s Health Initiative. Ann Epidemiol. 2017 Apr;27(4):274-280.
Msaouel P, Lam AP, Gundabolu K, Chrysofakis G, Yu Y, Mantzaris I, Friedman E, Verma A. Abnormal platelet count is an independent predictor of mortality in the elderly and is influenced by ethnicity. Haematologica. 2014 May;99(5):930-6.
Tsai MT, Chen YT, Lin CH, Huang TP, Tarng DC; Taiwan Geriatric Kidney Disease Research Group. U-shaped mortality curve associated with platelet count among older people: a community-based cohort study. Blood. 2015 Sep 24;126(13):1633-5.
Vinholt PJ, Hvas AM, Frederiksen H, Bathum L, Jørgensen MK, Nybo M. Thromb Res.Platelet count is associated with cardiovascular disease, cancer and mortality: A population-based cohort study. 2016 Dec;148:136-142.
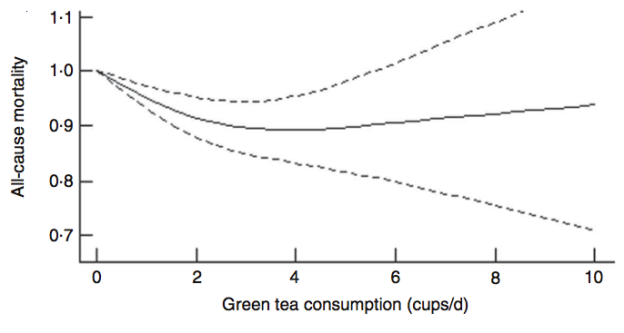
Is green tea consumption associated with reduced risk of death risk from all causes? To investigate this question, Tang et al. (2015) performed a meta-analysis of 5 studies, including 200,884 subjects. As shown below, drinking 2-3 cups (16-24 oz.) of green tea per day was associated with maximally decreased all-cause mortality risk, ~10%.

Post update (9/15/2019): Is there new data since this post was first published (2015) for the association between green tea with all-cause mortality risk? Two relatively large studies have been published since then. First, in a study of 164,681 men (average age, ~53y), consuming green tea (~15g/day) was associated with a maximally reduced risk of death from all causes (black lines; Liu et al. 2016). However, note that this data included both smokers and non-smokers. For non-smokers (green lines), all-cause mortality risk was maximally reduced even further at smaller doses, including ~ 6-10g of green tea/day:
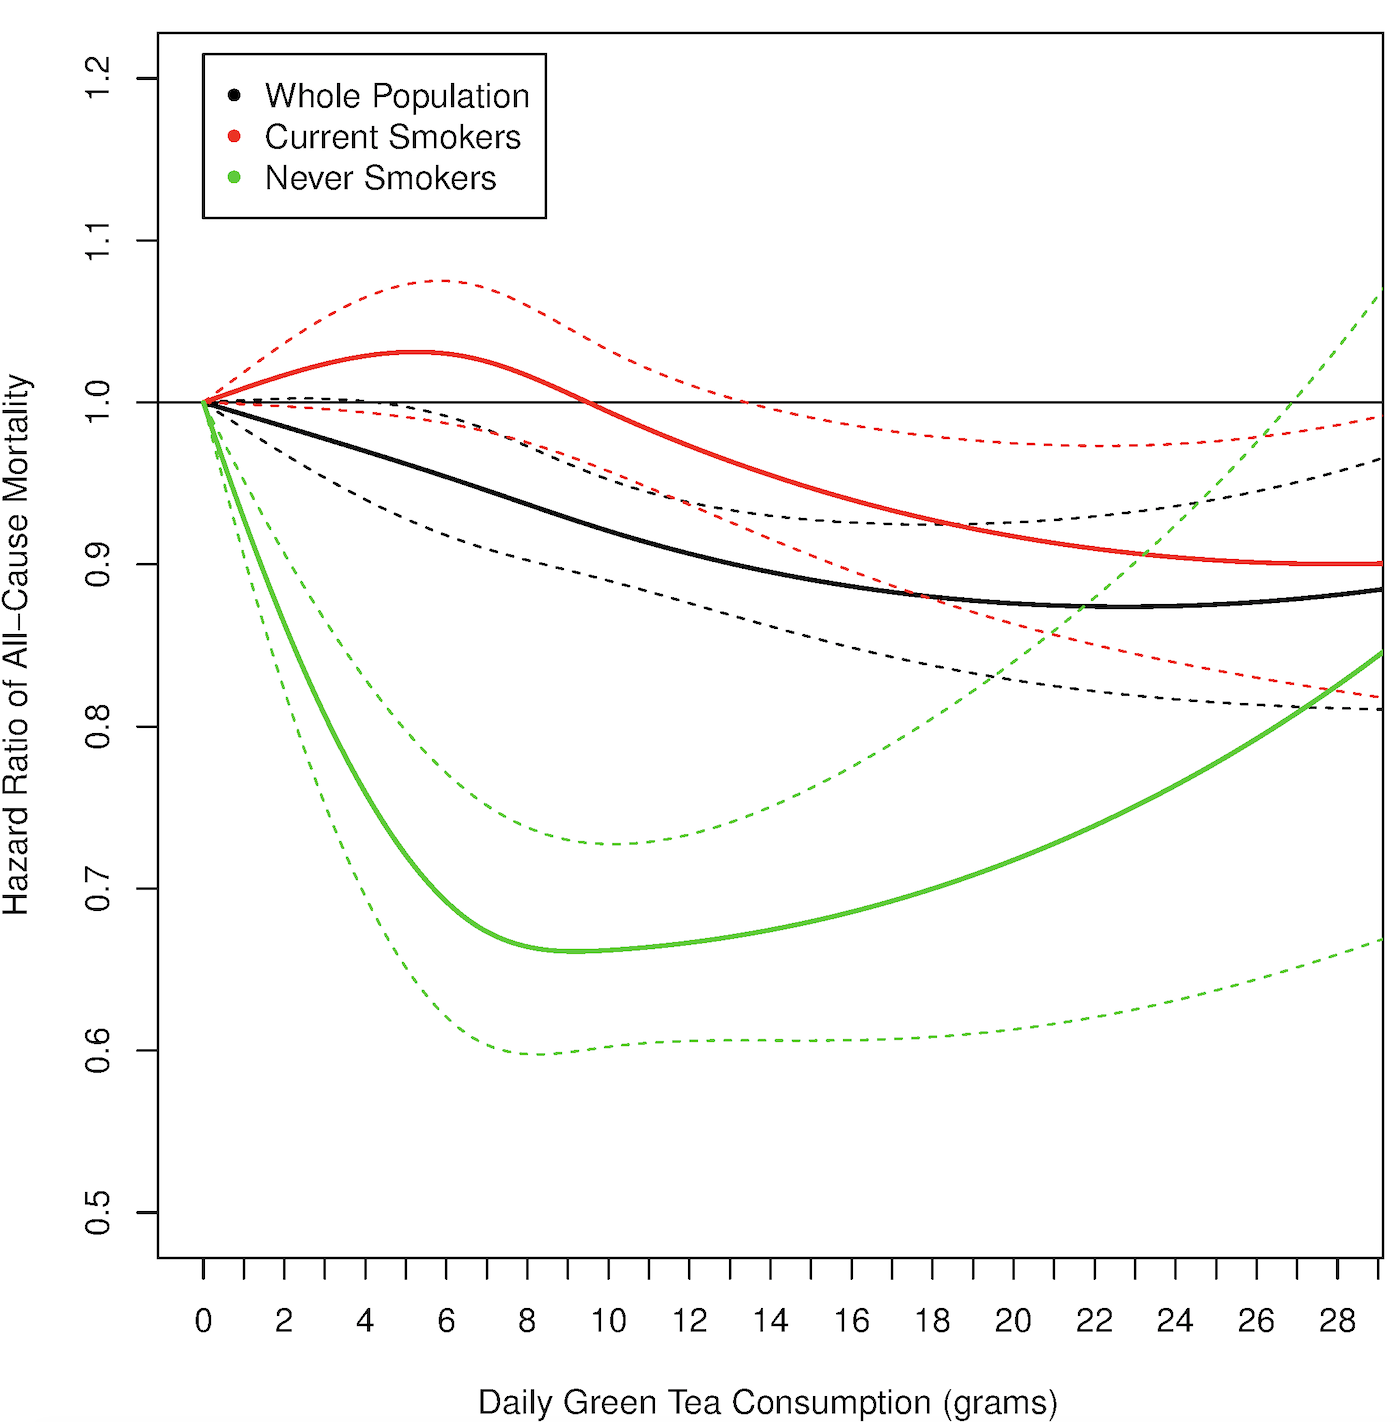
In support of these data, never-smoking men and women (average age, ~52y) that drank more than 8.2g, and 3.3g, respectively, of green tea had an 11% reduced risk of all-cause mortality in Zhao et al. (2017).
The data is clear, drink green tea!
If you’re interested, please have a look at my book!
Reference
Liu J, Liu S, Zhou H, Hanson T, Yang L, Chen Z, Zhou M. Association of green tea consumption with mortality from all-cause, cardiovascular disease and cancer in a Chinese cohort of 165,000 adult men. Eur J Epidemiol. 2016 Sep;31(9):853-65.
Tang J, Zheng JS, Fang L, Jin Y, Cai W, Li D. Tea consumption and mortality of all cancers, CVD and all causes: a meta-analysis of eighteen prospective cohort studies. Br J Nutr. 2015 Jul 23:1-11.
Zhao LG, Li HL, Sun JW, Yang Y, Ma X, Shu XO, Zheng W, Xiang YB. Green tea consumption and cause-specific mortality: Results from two prospective cohort studies in China. J Epidemiol. 2017 Jan;27(1):36-41.
Have you had a blood test and aren’t sure what values for platelets may be optimal for health? The reference range is 150-400 platelets per nanoliter (*10^9/L). Within that range, what’s optimal?
In a study of 21,635 adults older than 35y (average age wasn’t reported) with a 7.6-year follow-up, platelets between 230-270 was associated with maximally reduced risk of death from all causes (Bonaccio et al. 2016):
In a study of 21, 252 adults (average age 53y) with an average follow-up of 3.5y, values ~250 were associated with maximally reduced risk of death from all causes Vinholt et al. (2017) :
What about in older adults? In a study of 159, 746 postmenopausal women (average age, 63y) with a 16-year follow up, maximally reduced risk of death from all causes was associated with platelet values between 200-256 (Kabat et al. 2017).
In a study of 36, 262 older adults (average age, 71y) with an 11-year follow-up, platelet values ~250 were associated with maximally reduced risk for all-cause mortality. Interestingly, even at platelet values ~250, mortality risk was highest for non-Hispanic whites, when compared with non-Hispanic blacks and Hispanics (Msaouel et al. 2014):
In 5,766 older adults (average age, 73y) that were followed for 12-15 years, values higher than 200-300 had an increased risk of death from all causes (van der Bom et al 2009). Risk for values between 100-199 was not different when compared against 200-299, but there was a non-significant trend towards increased risk (1.05, 95% CI: 0.97, 1.14).
In 131,308 older adults (~73y) with a 6-yr follow-up, maximally reduced risk of death from all causes was associated with values between 200-300, whereas risk significantly increased below and above that range, respectively Tsai et al. (2015):
In sum, the data suggests that platelet values ~250 may be optimal for heath, with 200-300 as the “optimal range” within the 150-400 reference range. What are your values?
If you’re interested, please have a look at my book!
References
Bonaccio M, Di Castelnuovo A, Costanzo S, De Curtis A, Donati MB, Cerletti C, de Gaetano G, Iacoviello L; MOLI-SANI Investigators. Age-sex-specific ranges of platelet count and all-cause mortality: prospective findings from the MOLI-SANI study. Blood. 2016 Mar 24;127(12):1614-6.
Kabat GC, Kim MY, Verma AK, Manson JE, Lin J, Lessin L, Wassertheil-Smoller S, Rohan TE. Platelet count and total and cause-specific mortality in the Women’sHealth Initiative. Ann Epidemiol. 2017 Apr;27(4):274-280.
Msaouel P, Lam AP, Gundabolu K, Chrysofakis G, Yu Y, Mantzaris I, Friedman E, Verma A. Abnormal platelet count is an independent predictor of mortality in the elderly and is influenced by ethnicity. Haematologica. 2014 May;99(5):930-6.
Tsai MT, Chen YT, Lin CH, Huang TP, Tarng DC; Taiwan Geriatric Kidney Disease Research Group. U-shaped mortality curve associated with platelet count among older people: a community-based cohort study. Blood. 2015 Sep 24;126(13):1633-5.
van der Bom JG, Heckbert SR, Lumley T, Holmes CE, Cushman M, Folsom AR, Rosendaal FR, Psaty BM. Platelet count and the risk for thrombosis and death in the elderly. J Thromb Haemost. 2009 Mar;7(3):399-405.
Vinholt PJ, Hvas AM, Frederiksen H, Bathum L, Jørgensen MK, Nybo M. Thromb Res.Platelet count is associated with cardiovascular disease, cancer and mortality: A population-based cohort study. 2016 Dec;148:136-142.
Is green tea consumption associated with reduced risk of death risk from all causes? To investigate this question, Tang et al. (2015) performed a meta-analysis of 5 studies, including 200,884 subjects. As shown below, drinking 5 cups (40 oz.) or less per day is associated with reduced all-cause mortality risk. Drinking 2-3 cups (16-24 oz.) of green tea per day was associated with maximally decreased all-cause mortality risk, ~10%.
If you’re interested, please have a look at my book!
Reference
Tang J, Zheng JS, Fang L, Jin Y, Cai W, Li D. Tea consumption and mortality of all cancers, CVD and all causes: a meta-analysis of eighteen prospective cohort studies. Br J Nutr. 2015 Jul 23:1-11.

How much Vitamin D is optimal for health? To answer this question, today I’ll examine the association between a circulating marker of Vitamin D, 25-hydroxyvitamin D, with all-cause mortality risk. Then, I’ll examine the literature to estimate a dietary intake that can achieve an optimal circulating 25-hydroxyvitamin D concentration.
Circulating 25-hydroxyvitamin D is the most commonly measured vitamin D metabolite because of its greater half life (~3 weeks) and up to 1000-fold higher serum levels compared with the physiologically active metabolite of vitamin D, 1,25-dihydroxyvitamin D (Zerwekh 2008). So what’s the evidence for the association between circulating 25-hydroxyvitamin D with all-cause mortality risk?
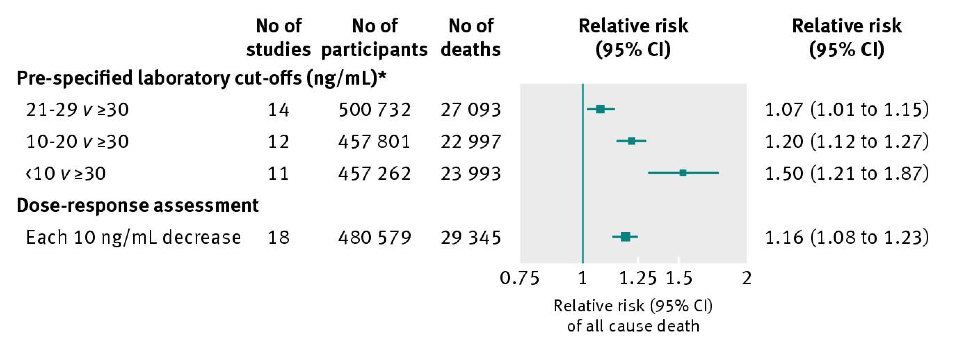
In a meta-analysis of 95 studies including 880,201 subjects, circulating 25-hydroxyvitamin D levels greater than 30 ng/mL (75 nmol/L) are associated with significantly reduced risk of death from all causes when compared with values less than 30 (<10, 20-29; Chowdhury et al. 2014):
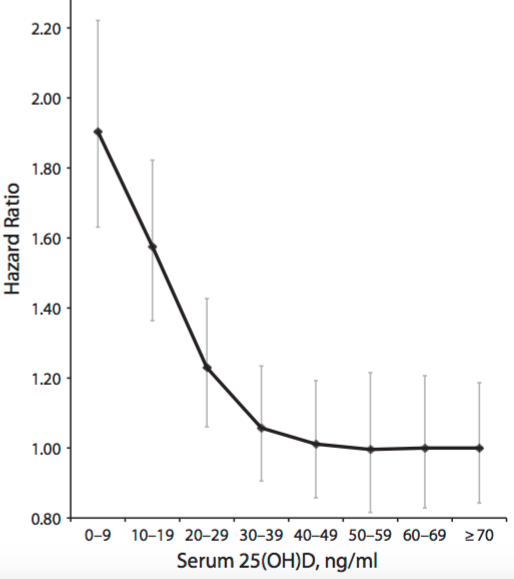
Does the meta-analysis data for 25-hydroxyvitamin D mean that any values higher than 30 ng/mL are optimal for health? Maybe not. As shown below, although data from 11,315 subjects in the NHANES III study suggests that values between 30-40 ng/mL (75-99 nmol/L) may be optimal for decreased all-cause mortality risk (Sempos et al. 2013), 25-hydroxyvitamin D values greater than 48 ng/mL (120+ nmol/L) were associated with an increased all-cause mortality risk. Interestingly, in agreement with the Chowdhury meta-analysis data, this graph shows also increased mortality risk at values less than 30-40 ng/mL (75-99 nmol/L):

However, whether increased circulating 25-hydroxyvitamin D is associated with increased all-cause mortality risk is debatable. In another meta-analysis (Garland et al. 2014), although circulating 25-hydroxyvitamin D values less than 30 ng/mL were again associated with increased risk, in contrast, values greater than 48 ng/mL were not. Interestingly, values as high as 70 ng/mL (175 nmoL) were not associated with increased risk, either:
Aside from our skin making Vitamin D from sunlight during the summer months, what dietary intake can achieve the seemingly optimal 30-40 ng/mL (75-99 nmol/L) concentration for 25-hydroxyvitamin D in the winter? The RDA for Vitamin D is 600 IU for everyone older than 1 but younger than 70 (Institute of Medicine, 2010). If you’re over 70, the RDA is 800 IU. My average dietary intake is only ~170 IU-how can I increase this to at least the RDA, to achieve circulating values between 75-99 nmol/L?
Decent dietary sources of vitamin D include fish: salmon, sardines, mackerel, and tuna. Based on the table below (Holick 2007), eating ~3.5 ounces of wild salmon every day would achieve the RDA for vitamin D intake. In contrast, my daily tin of sardines puts me ~300 IU away from the RDA value! I could double my fish intake to ~8 oz./day, but I’d like to limit my animal protein intake, and, the extra ~200 calories would limit other nutrients that I’d like to enrich in my diet, like fiber.

Are there other, less calorie dense dietary sources of vitamin D? It’s important to note that dietary vitamin D can be found in 2 forms, D3, which is shown above, and D2. Which foods are rich in vitamin D2? Shown below is a picture of the best plant-based source of vitamin D2, maitake mushrooms:
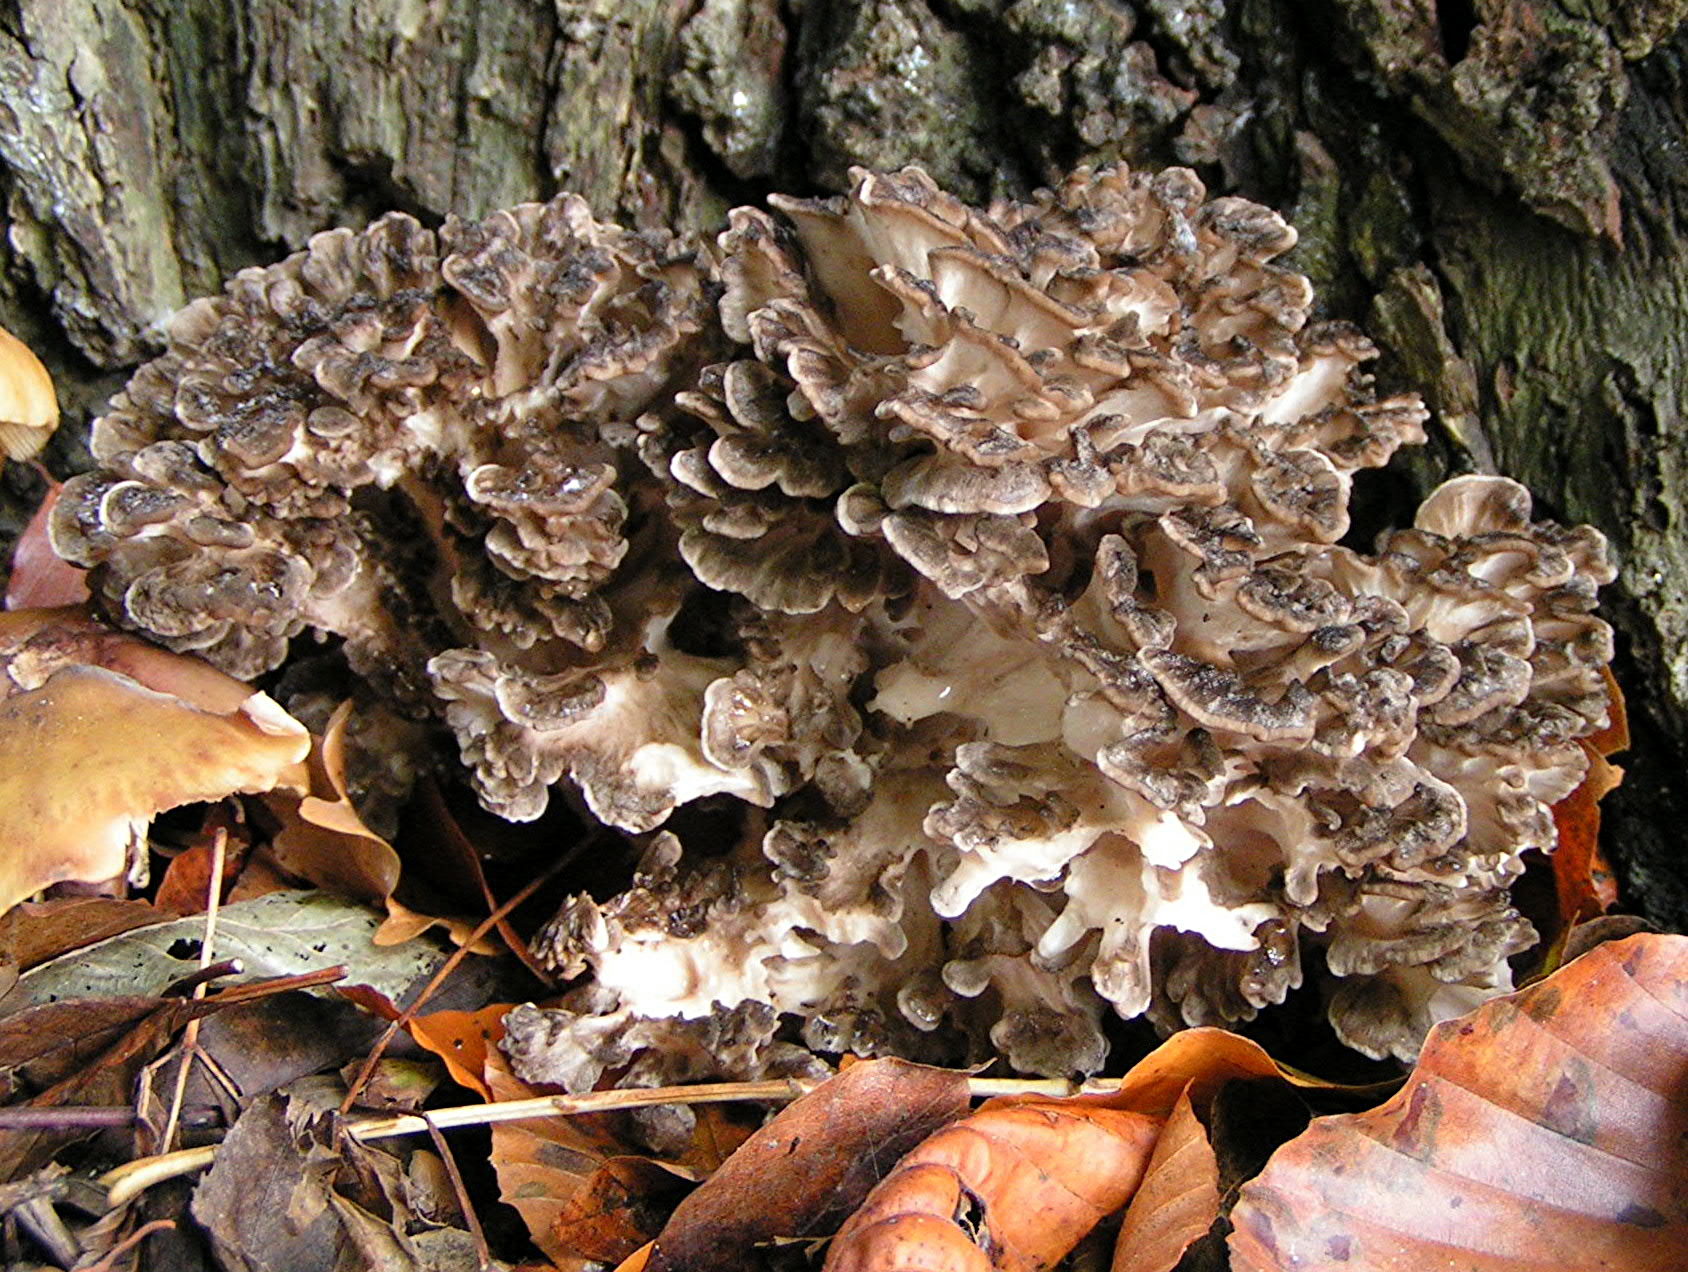
The Vitamin D2 content of maitake mushrooms is 36 IU/calorie, whereas wild salmon only has 3.2 IU of vitamin D per calorie! Other “exotic” mushrooms (anything other than white button mushrooms is exotic to me!) like Chanterelle and Morel contain decent amounts of vitamin D2:

Before adding maitake and other “exotic” mushrooms into my nutritional plan for their vitamin D content, it’s important to ask, “does D2 increase circulating 25-hydroxyvitamin D to an equal extent as D3”? Unfortunately, the answer is no: although D2 and D3 both increase circulating 25-hydroxyvitamin D levels, D2-based sources increase 25-hydroxyvitamin D level about half as effectively as D3 (Trang et al. 1998). So, instead of consuming ~35g of maitake mushrooms to add 400 IU of vitamin D into my diet (to achieve the RDA of 600 IU), I’ve added ~70g/day.
12/29/2015 Update: Because of Maitake’s relatively high cost, $5 for only 100g, and the burden of having to eat it every day, for the past ~3 months I switched to Vitamin D supplements to achieve a D intake of ~1100 IU/day. Blood testing showed that this intake yielded a circulating 25-hydroxyvitamin D winter concentration of 31 ng/mL, putting me at low risk for all cause mortality, based on the meta-analysis D data.
8/23/2016 Update: I stopped supplementing with 1000 IU of Vitamin D in June 2016, to explore the effect of 3-4 hours of weekly sun exposure on my circulating Vitamin D levels. My unsupplemented, circulating 25-hydroxyvitamin D level was 41 ng/mL in my 8/2016 blood test. Accordingly, I intend on increasing my Vitamin D intake to 1600 IU (1400 supplemental, ~200 dietary)/day to achieve a circulating winter 25-hydroxyvitamin D level that is similar my the summer value.
11/12/2017 Update: I’ve been supplementing with 2000 IU of D3/day, bringing my average daily total to ~2200 IU/day. Based on that, my latest circulating 25-hydroxyvitamin D level (tested in October, 2017) was 39 ng/mL .
If you’re interested, please have a look at my book!
References
Chowdhury R, Kunutsor S, Vitezova A, Oliver-Williams C, Chowdhury S, Kiefte-de-Jong JC, Khan H, Baena CP, Prabhakaran D, Hoshen MB, Feldman BS, Pan A, Johnson L, Crowe F, Hu FB, Franco OH. Vitamin D and risk of cause specific death: systematic review and meta-analysis of observational cohort and randomised intervention studies. BMJ. 2014 Apr 1;348:g1903.
Garland CF, Kim JJ, Mohr SB, Gorham ED, Grant WB, Giovannucci EL, Baggerly L, Hofflich H, Ramsdell JW, Zeng K, Heaney RP. Meta-analysis of all-cause mortality according to serum 25-hydroxyvitamin D. Am J Public Health. 2014 Aug;104(8):e43-50.
Holick MF. Vitamin D deficiency. N Engl J Med. 2007 Jul 19;357(3):266-81.
Institute of Medicine, Food and Nutrition Board. Dietary Reference Intakes for Calcium and Vitamin D. Washington, DC: National Academy Press, 2010.
Sempos CT, Durazo-Arvizu RA, Dawson-Hughes B, Yetley EA, Looker AC, Schleicher RL, Cao G, Burt V, Kramer H, Bailey RL, Dwyer JT, Zhang X, Gahche J, Coates PM, Picciano MF. Is there a reverse J-shaped association between 25-hydroxyvitamin D and all-cause mortality? Results from the U.S. nationally representative NHANES. J Clin Endocrinol Metab. 2013 Jul;98(7):3001-9.
Trang HM, Cole DE, Rubin LA, Pierratos A, Siu S, Vieth R. Evidence that vitamin D3 increases serum 25-hydroxyvitamin D more efficiently than does vitamin D2. Am J Clin Nutr. 1998 Oct;68(4):854-8.
Zerwekh JE. Blood biomarkers of vitamin D status. Am J Clin Nutr 2008;87:1087S-91S.
