
I’ve posted individual dietary days as an example of what and how much I eat (https://michaellustgarten.wordpress.com/2015/12/31/130-grams-of-fiber-2400-calories/). However, a few days of examples may not represent the whole dietary picture. To address this, below is my average nutrient intake for the past 100 days (from October 24, 2018-Feb 5 2019):
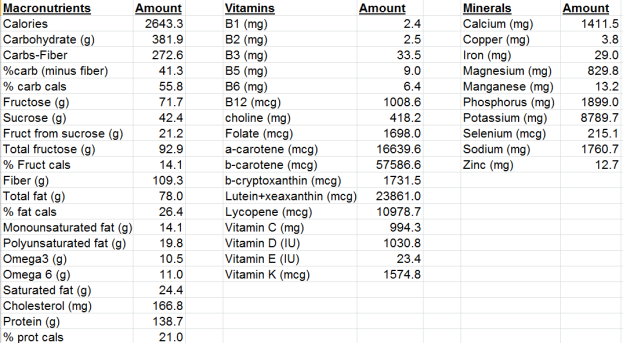
Notice that my average values for many of these variables (i.e. potassium, selenium, Vitamin C, Vitamin K, etc.) are way above the RDA. For more info on that, I have several blog posts that explain the “why” behind that. Where am I getting those nutrients from? Shown below are 100-day averages for my food intake, ranked in order from most consumed (in grams, or ounces, if it’s a drink) to least:
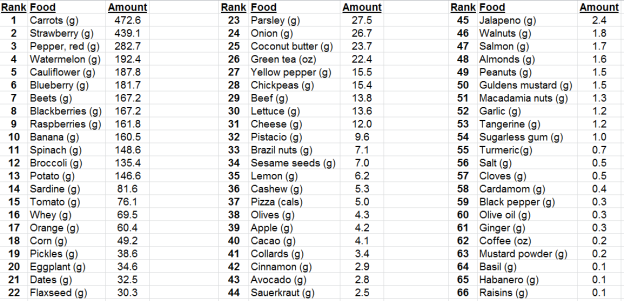
During the past 100 days, my top 5 foods in terms of daily intake include carrots, strawberries, red peppers, watermelon, and cauliflower. Scroll through the list to see how much I average on a daily basis for each food!
Please have a look at my book, if you’re interested!
