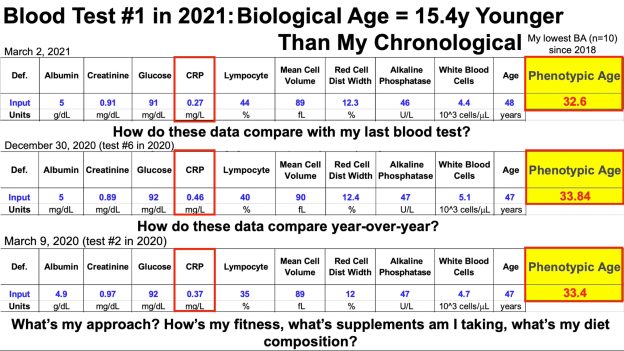
Results for my first blood test in 2021 are in-what’s my biological age, and how am I optimizing it?
If you’re interested in calculating your biological age, the spreadsheet is included as an Excel file in this link:
Results for my first blood test in 2021 are in-what’s my biological age, and how am I optimizing it?
If you’re interested in calculating your biological age, the spreadsheet is included as an Excel file in this link:
Here’s a podcast that was recorded with WildHealth, enjoy!

My latest blood test results are in-how’s my biological age? In the video I discuss my dietary approach prior to my latest blood test, the blood test results, and my plan to improve them going forward.
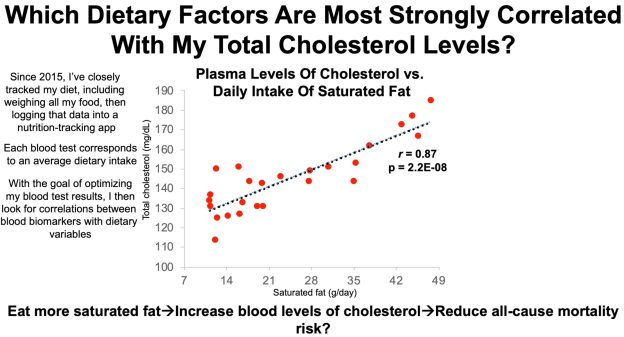
In an earlier video, I presented data for total cholesterol (TC) levels in blood in terms of changes during aging and all-cause mortality risk. I’ve measured TC 25 times in the past 5 years, and in this video, I present that data, and my approach to optimize it.
https://www.youtube.com/watch?v=PBv_hXwUqHM&feature=emb_logo

An adequate daily intake of Vitamin K1 is 120 and 90 micrograms/day for males and females, respectively, but are those amounts optimal for health? In this video, I present evidence that consuming more than 1000 micrograms of Vitamin K1/day may be optimal.

Here’s a video clip about my latest Biological Age measurement!

Most often overlooked on a standard blood test are the mean corpuscular volume (MCW) and Red Blood Cell Distribution Width (RDW). How do they change during aging, and what’s associated with all-cause mortality risk? Also, with the goal of optimizing MCV and RDW, how does my diet correlate with these biomarkers?


My average biological age in 2019 is 12 years younger than my chronological age (46y) based on the Phenotypic Age calculator (https://michaellustgarten.wordpress.com/2019/11/01/biological-age-31-3y-chronological-age-46y/), and 16y younger based on aging.ai (https://michaellustgarten.wordpress.com/2019/11/04/years-of-biological-aging-in-the-past-4-years/). One factor that likely contributes to my relatively youthful biological age is my diet.
Shown below is my average daily dietary intake from January 1 through November 7th, 2019 (n=306 days). I weigh all of my food with a food scale, so these aren’t estimated amounts:
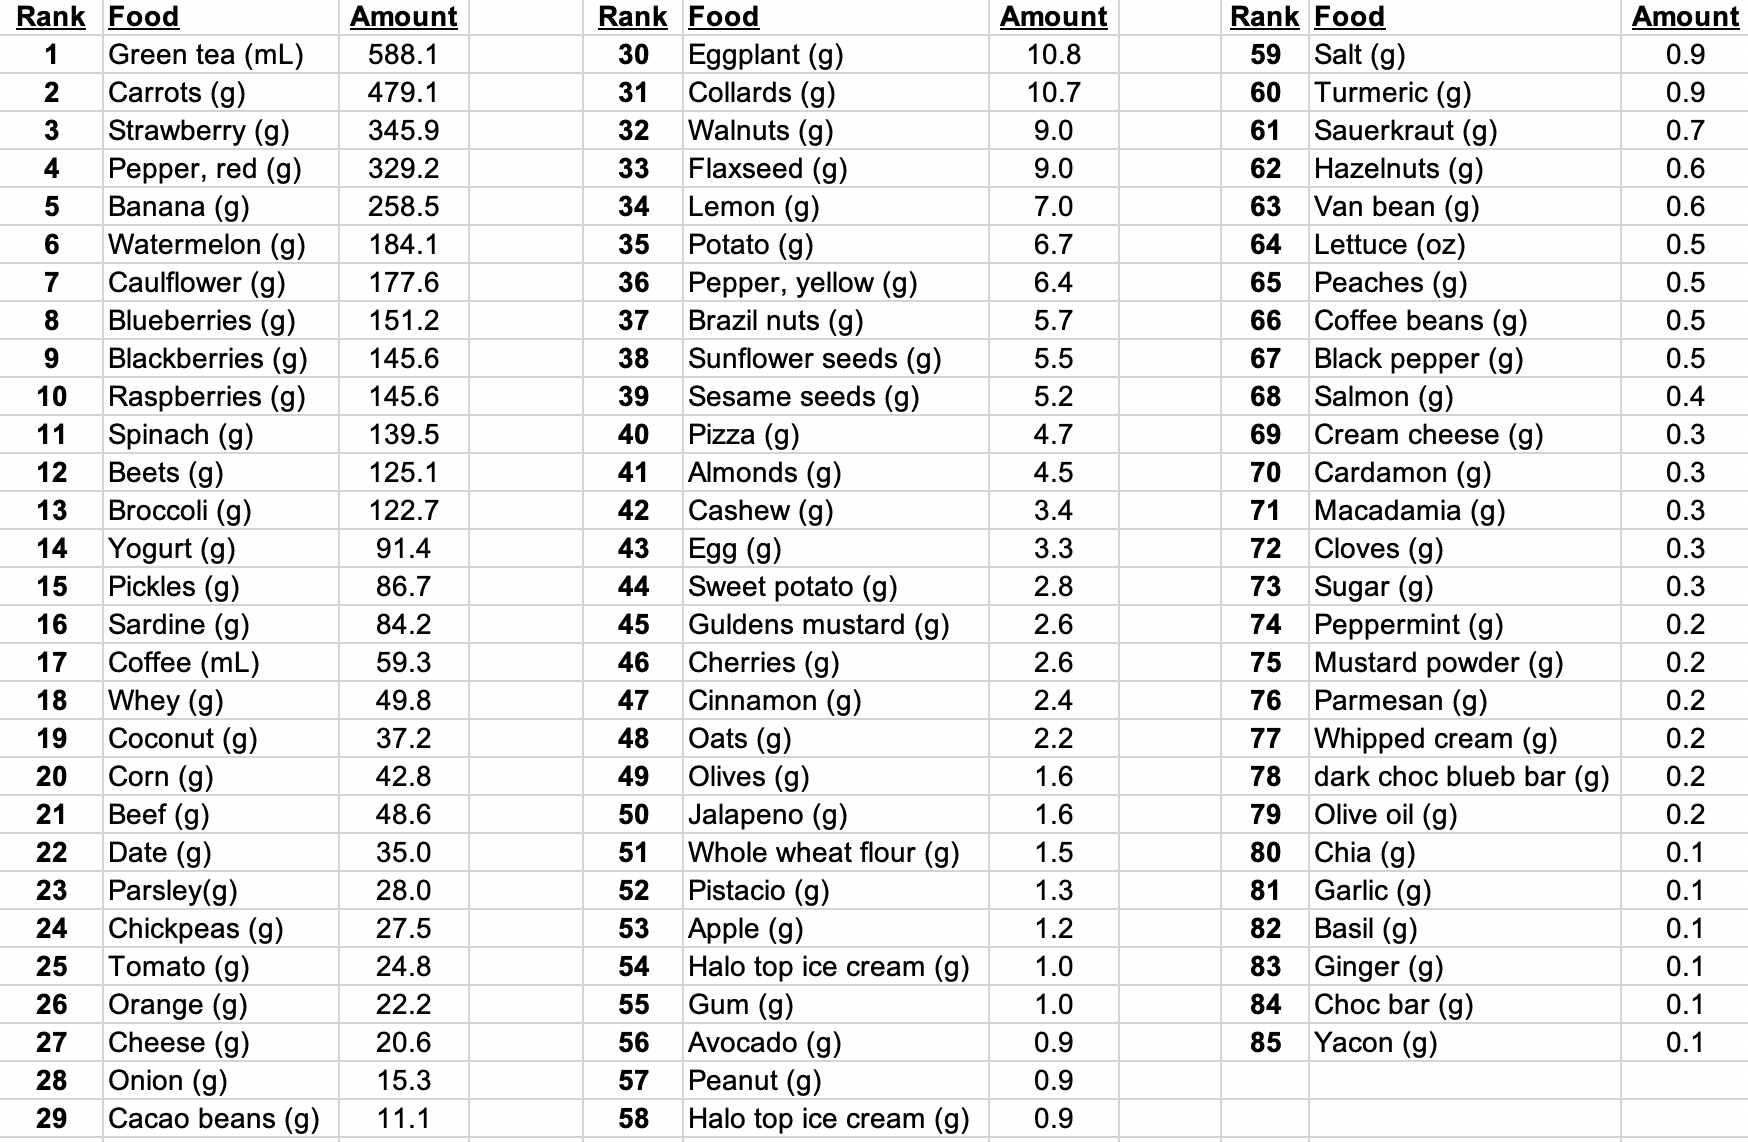
In terms of weight (or volume), green tea is atop the list, as I drink 20 oz/day. Carrots come in second place (for why, see https://michaellustgarten.wordpress.com/2018/07/06/serum-albumin-and-acm/), followed by strawberries, red bell peppers, bananas, watermelon (for the lycopene), cauliflower, blueberries, blackberries, and raspberries. Note that I mix the bananas and berries in my green smoothies, which I drink 3-4x/week, which includes spinach (#11) and parsley (#23).
What does my average daily macro- and micro-nutrient data look like for 2019?

Note that I purposefully have higher than the RDA values for several nutrients, including Vitamin C (see https://michaellustgarten.wordpress.com/2019/09/19/vitamin-c-dietary-intake-and-plasma-values-whats-optimal-for-health/), Vitamin K (see https://michaellustgarten.wordpress.com/2015/05/08/eat-more-green-leafy-vegetables-reduce-mortality-risk/), selenium (see https://michaellustgarten.wordpress.com/2015/05/28/selenium-dietary-intake-and-plasma-values-whats-optimal-for-health/), and others (see michaellustgarten.com).
In terms of supplements, I use 1000 IU of vitamin D from November – May, and I take a methylfolate-methylB12-B6 supplement, to help keep my homocysteine levels low.
If you’re interested, please have a look at my book!

In the first half of this presentation, I talk about my contribution to the gut-muscle axis in older adults, and in the second half, my personalized approach to optimal health!
Also, here’s the article that corresponds to the presentation:
https://www.leafscience.org/the-gut-microbiome-affects-muscle-strength-in-older-adults/
If you’re interested, please have a look at my book!
