Is there a BMI that is associated with maximally reduced risk of death from all causes? Let’s have a look at the data!
In a meta-analysis of 19 studies that included 1,460,000 adults (median age, 58 years) a BMI between 20-25 kg/m2 was associated with maximally reduced all-cause mortality risk (Berrington de Gonzalez et al. 2010):

However, in a meta-analysis of 32 studies that included 197,140 older adults (65 years+), a BMI between 24 and 31 kg/m2 was associated with maximally reduced all-cause mortality risk (Winter et al. 2014). More specifically, a BMI between 26-26.9 kg/m2 was associated with maximally reduced all-cause mortality risk for never-smokers (Winter et al. 2014):

So what’s optimal for longevity in terms of BMI, is it 20-25 kg/m2, or potentially higher, as reported in older adults? For additional insight about the association between BMI with all-cause mortality, I looked up the published BMI data for centenarians:
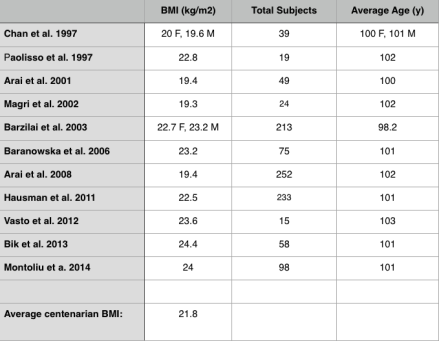
In these 11 studies that included 1075 centenarians, the BMI range was between 19.3-24.4 kg/m2, with an average BMI of 21.8. Shouldn’t that be the BMI reference range for those interested in living past 100?
If you’re interested, please have a look at my book!
References
Arai Y, Hirose N, Yamamura K, Shimizu K, Takayama M, Ebihara Y, Osono Y. Serum insulin-like growth factor-1 in centenarians: implications of IGF-1 as a rapid turnover protein. J Gerontol A Biol Sci Med Sci. 2001 Feb;56(2):M79-82.
Arai Y, Takayama M, Gondo Y, Inagaki H, Yamamura K, Nakazawa S, Kojima T, Ebihara Y, Shimizu K, Masui Y, Kitagawa K, Takebayashi T, Hirose N. Adipose endocrine function, insulin-like growth factor-1 axis, and exceptional survival beyond 100 years of age. J Gerontol A Biol Sci Med Sci. 2008 Nov;63(11):1209-18.
Baranowska B, Bik W, Baranowska-Bik A, Wolinska-Witort E, Szybinska A, Martynska L, Chmielowska M. Neuroendocrine control of metabolic homeostasis in Polish centenarians. J Physiol Pharmacol. 2006 Nov;57 Suppl 6:55-61.
Barzilai N, Atzmon G, Schechter C, Schaefer EJ, Cupples AL, Lipton R, Cheng S, Shuldiner AR. Unique lipoprotein phenotype and genotype associated with exceptional longevity. JAMA 2003;290:2030–40.
Berrington de Gonzalez A, Hartge P, Cerhan JR, Flint AJ, Hannan L, MacInnis RJ, Moore SC, Tobias GS, Anton-Culver H, Freeman LB, Beeson WL, Clipp SL, English DR, Folsom AR, Freedman DM, Giles G, Hakansson N, Henderson KD, Hoffman-Bolton J, Hoppin JA, Koenig KL, Lee IM, Linet MS, Park Y, Pocobelli G, Schatzkin A, Sesso HD, Weiderpass E, Willcox BJ, Wolk A, Zeleniuch-Jacquotte A, Willett WC, Thun MJ. Body-mass index and mortality among 1.46 million white adults. N Engl J Med. 2010 Dec 2;363(23):2211-9. doi: 10.1056/NEJMoa1000367. Erratum in: N Engl J Med. 2011 Sep 1;365(9):869.
Bik W, Baranowska-Bik A, Wolinska-Witort E, Kalisz M, Broczek K, Mossakowska M, Baranowska B. Assessment of adiponectin and its isoforms in Polish centenarians. Exp Gerontol. 2013 Apr;48(4):401-7.
Chan YC, Suzuki M, Yamamoto S. Dietary, anthropometric, hematological and biochemical assessment of the nutritional status of centenarians and elderly people in Okinawa, Japan. J Am Coll Nutr. 1997 Jun;16(3):229-35.
Hausman DB, Johnson MA, Davey A, Poon LW. Body mass index is associated with dietary patterns and health conditions in georgia centenarians. J Aging Res. 2011;2011:138015.
Magri F, Muzzoni B, Cravello L, Fioravanti M, Busconi L, Camozzi D, Vignati G, Ferrari E. Thyroid function in physiological aging and in centenarians: possible relationships with some nutritional markers. Metabolism. 2002 Jan;51(1):105-9.
Montoliu I, Scherer M, Beguelin F, DaSilva L, Mari D, Salvioli S, Martin FP, Capri M, Bucci L, Ostan R, Garagnani P, Monti D, Biagi E, Brigidi P, Kussmann M, Rezzi S, Franceschi C, Collino S. Serum profiling of healthy aging identifies phospho- and sphingolipid species as markers of human longevity. Aging (Albany NY). 2014 Jan;6(1):9-25.
Paolisso G, Ammendola S, Del Buono A, Gambardella A, Riondino M, Tagliamonte MR, Rizzo MR, Carella C, Varricchio M. Serum levels of insulin-like growth factor-I (IGF-I) and IGF-binding protein-3 in healthy centenarians: relationship with plasma leptin and lipid concentrations, insulin action, and cognitive function. J Clin Endocrinol Metab. 1997 Jul;82(7):2204-9.
Vasto S, Scapagnini G, Rizzo C, Monastero R, Marchese A, Caruso C. Mediterranean diet and longevity in Sicily: survey in a Sicani Mountains population. Rejuvenation Res. 2012 Apr;15(2):184-8.
Winter JE, MacInnis RJ, Wattanapenpaiboon N, Nowson CA. BMI and all-cause mortality in older adults: a meta-analysis. Am J Clin Nutr. 2014 Apr;99(4):875-90.

Hello Michael,
First of all, your research is absolutely spectacular. When I came upon your blog, I realized i’d hit a gold mine. Thank you for all the work you do here.
I myself am a physicist by training, but am also very interested in longevity research and optimal health. Being trained in the scientific method, I’ve been following a similar plan to yours: tracking nutrient intake while attempting to shoot for levels of nutrients that optimize health— while keeping an eye on genomic testing.
I’ve read thousands of papers on nutrition and health. A lot of what I’ve found correlates well with many of your conclusions, although there are a few things I’ve come across that differ from some of your conclusions. I look forward to reading through more of your website. It is really is one the best resources I’ve come across.
I did have a comment with regard to this post in particular:
It is regards to the final question you pose, “Shouldn’t that be the BMI reference range (19.3-24.4) for those interested in living past 100?”
The answer I give is: “No. Not necessarily!”
Here is why: The researchers have not taken the change in BMI over time into account.
What I mean is this: It is entirely possible that the optimal BMI for lowest mortality rates may be different at different ages. Optimal BMI may be 22 for a 40 year old, 26 for a 65 year old and 21 for a 100 year old.
In fact, the data of the second study seem to indicate that the optimal BMI for +65 is 26-26.9.
I don’t know if the data is out there, but what would be most helpful would be all cause mortality rates by BMI for each AGE.
If you want to lower your all-cause mortality over a LIFETIME, you should shoot for optimal BMI at each AGE.
Anecdotally, my experience (and that of friends in the healthcare industry) is that mid-elderly (65+) who are a little bit heavier do better if they come down with a disease or the flu than those who have a lower BMI or are thin. They somehow have more reserves to deal with the illness. I’m not talking about morbidly obese, but probably in the 26 BMI range.
Anyway, wonderful website!
Thanks again!
LikeLike
Hey Greg, I don’t necessarily disagree with much of what you’ve said. Can you still be at low risk for ACM with a BMI higher than 20-23? Yes. For me, it all comes down to circulating biomarkers. if they’re optimal at a higher BMI, then that’s ok, too. But on a population based scale, that’s usually not the case.
LikeLike
Oh, one more thought.
When looking at those over 100, yes, their average BMI is 21.8 at age 100. But this doesn’t tell you how they GOT to being 100 with an average BMI of 21.8.
That is, they may have had an average BMI of 24 in the 30s, 27 in their 60s and 21.8 in their 90s.
What I would like to know is how their BMIs changed over their lifetimes. This would be a very useful, but very long term study.
Perhaps BMI drops for everyone in their 90s?
Just thinking out loud here…
LikeLike
I agree about the centenarian data. It could go either way-increased or decreased BMI during aging for them, that isn’t known.
LikeLike
Hi again Michael–
I had a question about something else— then one last comment about BMI.
I’ve noticed that you’ve posted good research on how levels of several nutrients are related to reduced all-cause mortality risk (selenium, for example.) Reduced all-cause mortality, of course, is really what matters most, and you’re right to focus on this.
I was wondering if you were able to find data on serum retinol and all-cause mortality? I haven’t found this data in any of my research. Retinoids are my latest research project.
Finally, on the BMI issue:
The average BMI for centenarians is 21.8. However, is that the BMI associated with maximally reduced all-cause mortality? That would be the more relevant thing to know. Is there a curve like the first curve you posted, but for those above 100? Just because those over 100 have an average BMI of 21.8 doesn’t mean much— surely not as much as finding the BMI associated with reduced all-cause mortality.
Also, looking at the graph you posted from the Witner paper, it appears to me that the minimum of the curve is around 27.5 or 28, not 26-26.9. How do you arrive at those numbers?
Finally, my conclusions from the data you posted are different than yours. From the first curve you posted (Berrington de Gonzalez) it appears that the all-cause mortality for BMI 20 to BMI 25 are the same. The odds ratio only rises when you are below 20 or above 25– and even 19 and 26 are very small rises. Combine this with the the Winter paper, which shows to my eye a minimum at around 27.5, with the minimum well from about 25.5-29. The only real overlap between these two large studies is around a BMI of 25.
More concerning to me is that the Witner paper shows a VERY steep rise in hazard ratio as you drop the BMI below 25. A BMI of 20 from that paper appears to show a 20% increase in all cause mortality, and even a BMI of 22 shows a 10% or so increase.
How did you come to a decision that optimal BMI should be around 22?
Seems to me optimal might be closer to BMI 25 or 26.
LikeLike
What is lacking in these studies is the stress level environment of the individuals. Most live a higher stress life, where a moderately elevated inflammation level and hence somewhat elevated BMI is probably optimal on shorter time scales. However, for longer time scales the low inflammation levels of BMI’s below the lower 20’s are optimal so long as the individual can maintain a lower stress environment. Centenarians have likely had low BMI’s throughout their lives in a lower stress environment. They are so small in numbers that at earlier ages they are buried in the large numbers of more typical lifestyle people.
This is even more impactful for males who have higher native inflammation rates than females and hence have reduced life expectations.
The challenge then is to maintain a lifelong BMI at the lower end of the accepted healthy range while living a lower stress lifestyle.
LikeLike
Hi Michal,
I think this article need an update.
There a lot of issues when when trying to estimate the optimal BMI like reverse causation due to existing chronic disease, and nonspecific loss of lean mass and function in the frail elderly
According to this study:
https://onlinelibrary.wiley.com/doi/full/10.1111/acel.12207
Epidemiological studies have found strong direct associations between increasing body mass index (BMI) and risks of developing type 2 diabetes, cardiovascular disease, and several types of cancer, beginning from BMI of 20–21 kg m−2.
In addition, observational data from healthy individuals practicing long-term DR with adequate nutrition (at least 100% of the RDI for each nutrient) show that even in these lean participants (mean BMI 19.6 kg m−2; ~12% body fat), DR induces beneficial changes against aging-related pathologies.
So I would guess based on this that the optimal BMI is 19-20 kg/m2.
LikeLike