Join us on Patreon! https://www.patreon.com/MichaelLustgartenPhD
Discount Links:
At-Home Metabolomics: https://iollo.com?ref=michael-lustgarten Use Code: CONQUERAGING At Checkout
NAD+ Quantification: https://www.jinfiniti.com/intracellular-nad-test/
Use Code: ConquerAging At Checkout
Epigenetic Testing: Trudiagnostic.pxf.io/R55XDv
Use Code: CONQUERAGING
Oral Microbiome (Enter Code: ConquerAging): https://www.bristlehealth.com/?ref=michaellustgarten
Green Tea: https://www.ochaandco.com/?ref=conqueraging
At-Home Blood Testing: https://getquantify.io/mlustgarten
Diet Tracking: https://shareasale.com/r.cfm?b=1390137&u=3266601&m=61121&urllink=&afftrack=
If you’d like to support the channel, you can do that with the website, Buy Me A Coffee: https://www.buymeacoffee.com/mlhnrca
Conquer Aging Or Die Trying Merch! https://my-store-d4e7df.creator-spring.com/
——————————————————————————————————————————-
Papers referenced in the video:
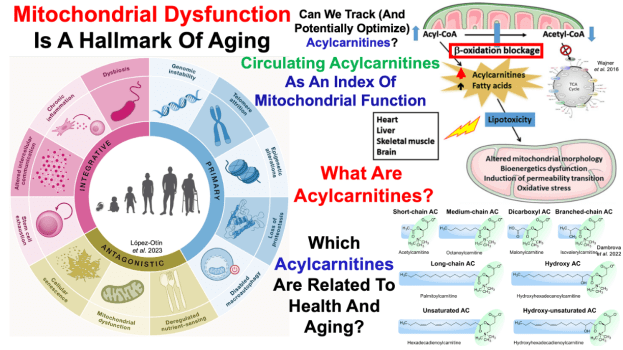
Hallmarks of aging: An expanding universe
https://pubmed.ncbi.nlm.nih.gov/36599349/
Mitochondrial dysfunction in fatty acid oxidation disorders: insights from human and animal studies
https://www.ncbi.nlm.nih.gov/pmc/articles/PMC4718505/
Acylcarnitines: Nomenclature, Biomarkers, Therapeutic Potential, Drug Targets, and Clinical Trials https://pubmed.ncbi.nlm.nih.gov/35710135/
Metabolomics signature improves the prediction of cardiovascular events in elderly subjects https://pubmed.ncbi.nlm.nih.gov/24468136/
Systemic and central nervous system metabolic alterations in Alzheimer’s disease https://pubmed.ncbi.nlm.nih.gov/31779690/
The association between plasma metabolites and future risk of all-cause mortality https://pubmed.ncbi.nlm.nih.gov/35796403/
Metagenomic and metabolomic remodeling in nonagenarians and centenarians and its association with genetic and socioeconomic factors
https://pubmed.ncbi.nlm.nih.gov/37118062/