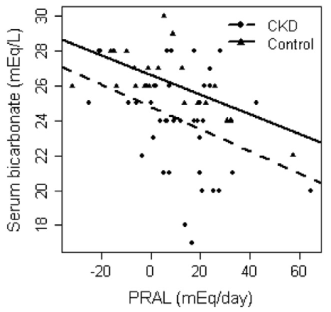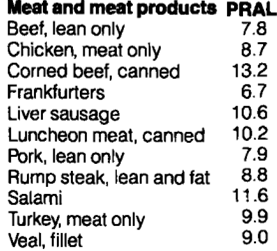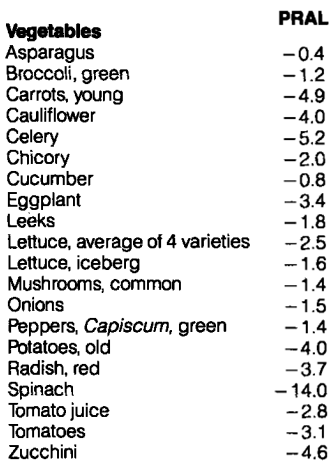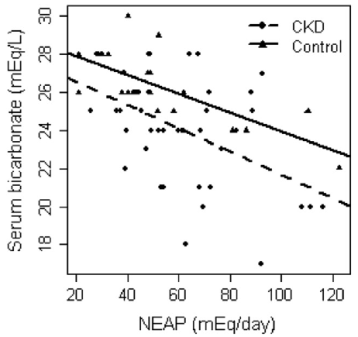
Within the body, meat, grains, and nuts are generally acid-forming, whereas vegetables and fruits are alkaline-forming. Is the distinction between whether your diet is acid- or alkaline-forming important for optimal health and lifespan? In an earlier post, I discussed the importance of PRAL (potential renal acid load) by correlating it with serum bicarbonate and mortality risk (https://michaellustgarten.wordpress.com/2016/02/07/using-diet-to-optimize-circulating-biomarkers-serum-bicarbonate/).
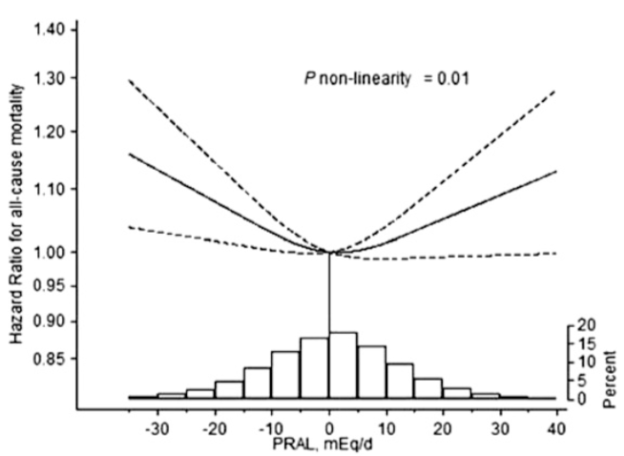
More recent data (a 15-year study of 81, 697 older adults; average age ~61y; Xu et al. 2016) has examined the association between PRAL with risk of death from all causes. In women, acidic PRAL values ( > 0) were associated with a significantly increased risk of death from all causes, as were alkaline PRAL values (< -5.6). In addition, very acidic (~40) and very alkaline (-30) PRAL values were associated with the highest risk for all-cause mortality:

Similarly, in men, when compared with a PRAL = 0, both alkaline (PRAl < -5.6) and acidic (> 29.8) values were associated with increased all-cause mortality risk.

While this data suggests that eating too much meat, grains, and/or nuts may not be optimal for health, it also suggests that eating too much alkaline-forming food, including veggies and fruits, may also not be optimal! My high veggie-based diet yields a very negative PRAL, ~-120 (~ -0.05 PRAL units/calorie), which would seem to put me at increased all-cause mortality risk. To further investigate, I decided to look at the PRAL values of long-lived societies.
The PRAL formula, as reported by Remer and Manz (1994) is:
PRAL = (0.49 * protein intake in g/day) + (0.037 * phosphorus intake in mg/day) – (0.02 * potassium intake in mg/day) – (0.013 * calcium intake in mg/day) – (0.027 * magnesium intake in mg/day).
Life expectancy for Seventh-Day Adventist women is 85 years, a value that is the highest in the world (Fraser and Shavlik 2001). What’s the average daily PRAL value for that population?
- Average daily dietary data in both vegetarian and non-vegetarian Seventh-Day Adventist women (average age, ~72y) has been reported (Nieman et al. 1989). For vegetarians, total calories = 1452; protein = 47g; phosphosphorus = 889 mg; potassium = 2628 mg; calcium = 628 mg; magnesium = 283 mg. These values yield an alkaline PRAL = -33.2. Because higher amounts of these nutrients can result from an increased calorie intake, it’s important to divide PRAL by the average daily calorie value, thereby yielding PRAL/calorie. For vegetarian Adventists, this value = -0.02.
- In non-vegetarian Adventists, total calories = 1363; protein = 55g; phosphosphorus = 892 mg; potassium = 2342 mg; calcium = 633 mg; magnesium = 228 mg. These values also yield an alkaline PRAL = -25.5, and PRAL/calorie = -0.019.
Life expectancy for those who live on the island of Okinawa is among the longest in the world (Miyagi et al. 2003). What’s the average daily PRAL value for Okinawan older adults?
- The average daily dietary data for 75-year old Okinawans has been reported (Willcok et al. 2007): total calories, 1785; protein, 39g; phosphosphorus, 864 mg; potassium, 5200 mg; calcium, 505 mg; magnesium, 396 mg. These values also yield an yield a very alkaline PRAL value = -87.4, and PRAL/calorie = -0.049. Interestingly, these values are very close to my very alkaline PRAL values of -121, and PRAL/calorie = ~-0.05!
My goal is not just to get to 75 in great health, but to live past 100 (and far beyond). What’s the data in centenarians? Unfortunately, I could only find 2 studies that included dietary data for that age group.
- In a study of 30 Chinese centenarians (average age, 103y), daily dietary values of 1220 calories, 39g protein, 603 mg phosphorus, 1433 mg potassium, 482 mg calcium, and 355 mg magnesium were reported (Cai et al. 2016), thereby yielding an average daily PRAL value = -20.3, and PRAL/calorie = -0.017.
- Similarly, in a larger study of 104 Japanese centenarians (average age, 100y), daily dietary values of 1137 calories, 44g protein, 676 mg phosphorus, 1695 mg potassium, 414 mg calcium, and 154 mg magnesium were reported (Shimizu et al. 2003), thereby yielding an average daily PRAL value = -16.3, and PRAL/calorie = -0.014.
In contrast to the data of Xu et al. (2016), these data suggest that an alkaline diet may indeed be optimal for lifespan.
So what’s your dietary PRAL value?
If you’re interested, please have a look at my book!
References
Cai D, Zhao S, Li D, Chang F, Tian X, Huang G, Zhu Z, Liu D, Dou X, Li S, Zhao M, Li Q. Nutrient Intake Is Associated with Longevity Characterization by Metabolites and Element Profiles of Healthy Centenarians. Nutrients. 2016 Sep 19;8(9).
Fraser GE, Shavlik DJ. Ten years of life: Is it a matter of choice? Arch Intern Med. 2001 Jul 9;161(13):1645-52.
Miyagi S, Iwama N, Kawabata T, Hasegawa K. Longevity and diet in Okinawa, Japan: the past, present and future. Asia Pac J Public Health. 2003;15 Suppl:S3-9.
Nieman DC, Underwood BC, Sherman KM, Arabatzis K, Barbosa JC, Johnson M, Shultz TD. Dietary status of Seventh-Day Adventist vegetarian and non-vegetarian elderly women. J Am Diet Assoc. 1989 Dec;89(12):1763-9.
Remer T, Manz F. Estimation of the renal net acid excretion by adults consuming diets containing variable amounts of protein. Am J Clin Nutr. 1994;59:1356-1361.
Shimizu K, Takeda S, Noji H, Hirose N, Ebihara Y, Arai Y, Hamamatsu M, Nakazawa S, Gondo Y, Konishi K. Dietary patterns and further survival in Japanese centenarians. J Nutr Sci Vitaminol (Tokyo). 2003 Apr;49(2):133-8.
Willcox BJ, Willcox DC, Todoriki H, Fujiyoshi A, Yano K, He Q, Curb JD, Suzuki M. Caloric restriction, the traditional Okinawan diet, and healthy aging: the diet of the world’s longest-lived people and its potential impact on morbidity and life span. Ann N Y Acad Sci. 2007 Oct;1114:434-55.
Xu H, Åkesson A, Orsini N, Håkansson N, Wolk A, Carrero JJ. Modest U-Shaped Association between Dietary Acid Load and Risk of All-Cause and Cardiovascular Mortality in Adults. J Nutr. 2016 Aug;146(8):1580-5.