Join us on Patreon! https://www.patreon.com/MichaelLustgartenPhD
Paper referenced in the video:
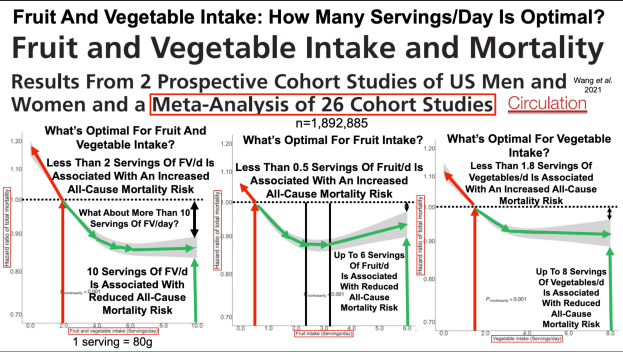
Fruit and Vegetable Intake and Mortality Results From 2 Prospective Cohort Studies of US Men and Women and a Meta-Analysis of 26 Cohort Studies
Join us on Patreon! https://www.patreon.com/MichaelLustgartenPhD
Paper referenced in the video:
Fruit and Vegetable Intake and Mortality Results From 2 Prospective Cohort Studies of US Men and Women and a Meta-Analysis of 26 Cohort Studies
Join us on Patreon!
https://www.patreon.com/MichaelLustga…
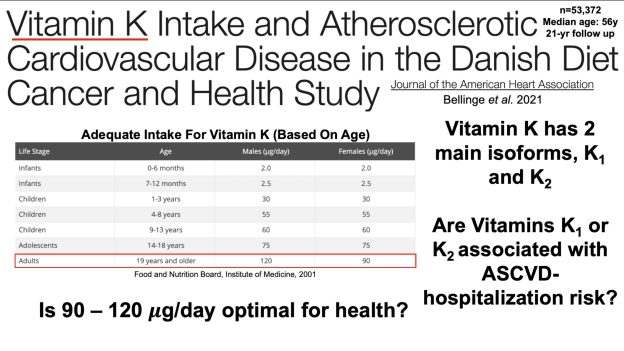
Vitamin K Intake and Atherosclerotic Cardiovascular Disease in the Danish Diet Cancer and Health Study https://pubmed.ncbi.nlm.nih.gov/34369…
Vitamin K2 amounts in food: Menaquinones, Bacteria, and Foods: Vitamin K2 in the Diet https://www.intechopen.com/chapters/5…
Multiple Vitamin K Forms Exist in Dairy Foods
https://pubmed.ncbi.nlm.nih.gov/29955…
Menaquinone Content of Cheese
https://www.ncbi.nlm.nih.gov/pmc/arti…
Determination of Phylloquinone and Menaquinones in Food Effect of Food Matrix on Circulating Vitamin K Concentrations
https://pubmed.ncbi.nlm.nih.gov/11356…
Vitamin K1 intakes derived from cronometer.com

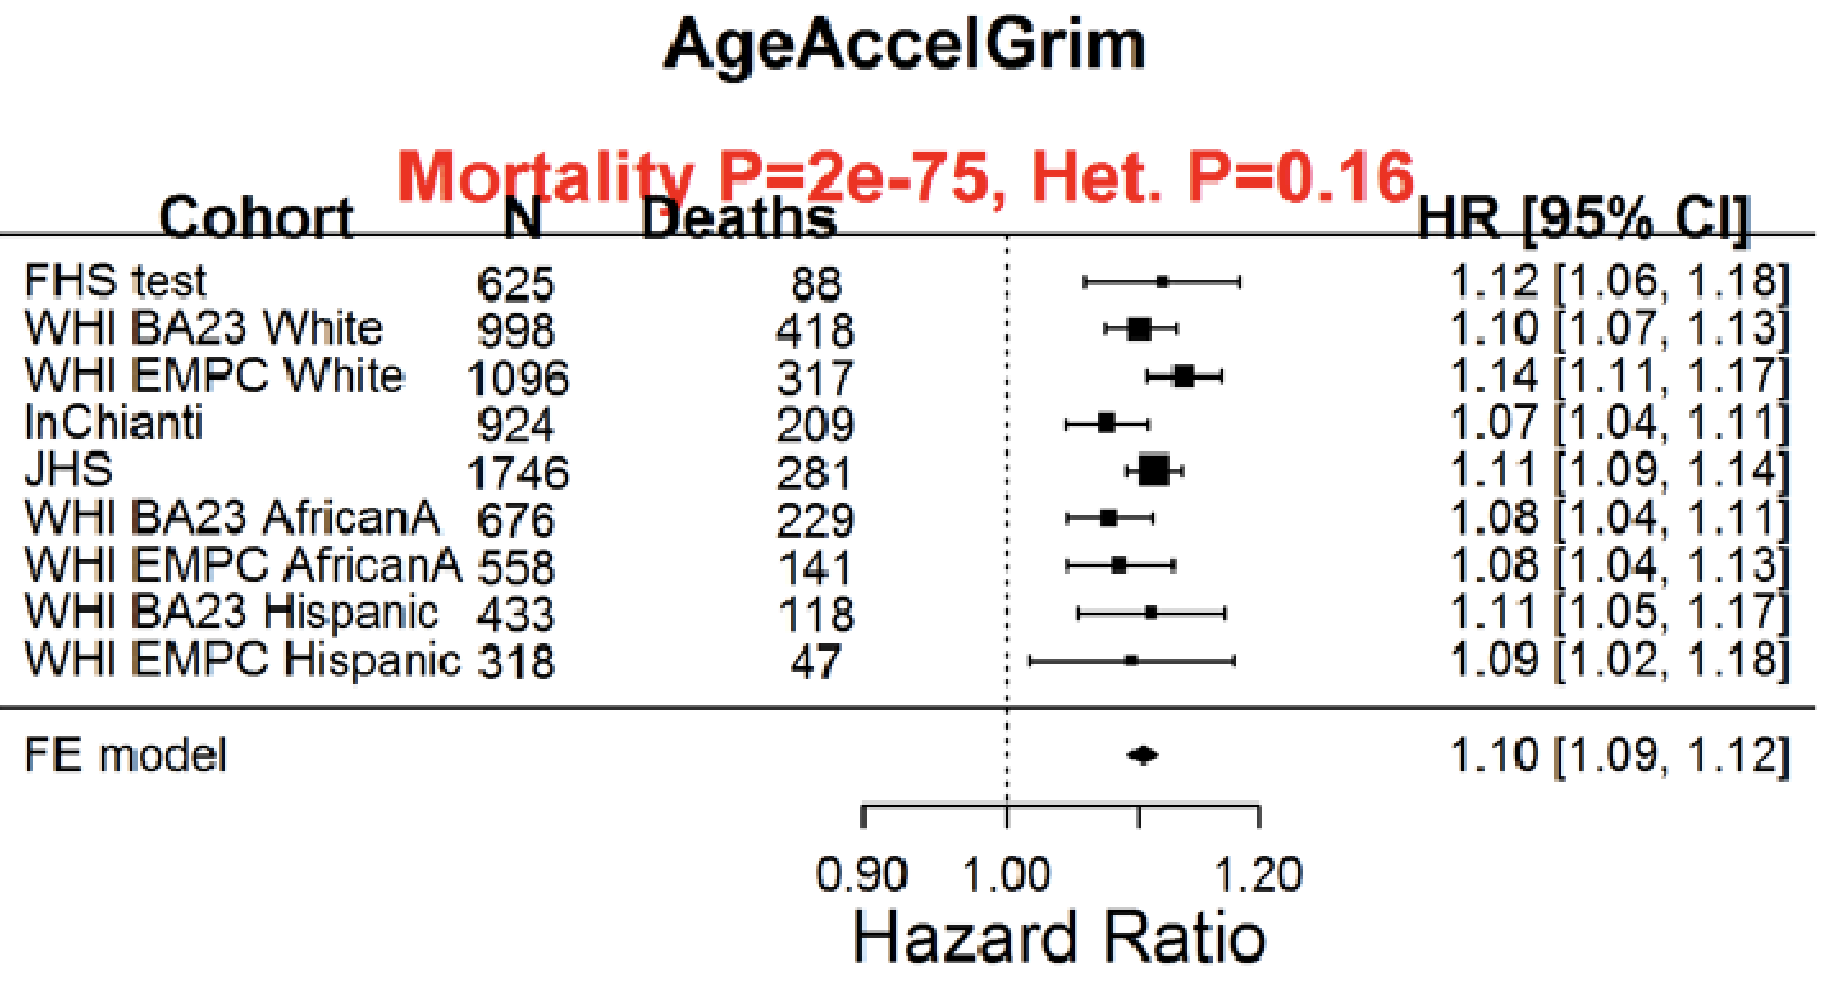
Having a faster rate of epigenetic aging, as measured by the epigenetic age metric, AgeAccelGrim, is associated with a significantly increased risk of death for all causes in a variety of cohorts, including the Framingham Heart Study (FHS), the Women’s Health Initiative (WHI) study, the InChianti study, the Jackson Heart Study (JHS), and collectively, when evaluated as a meta-analysis (Lu et al. 2019):
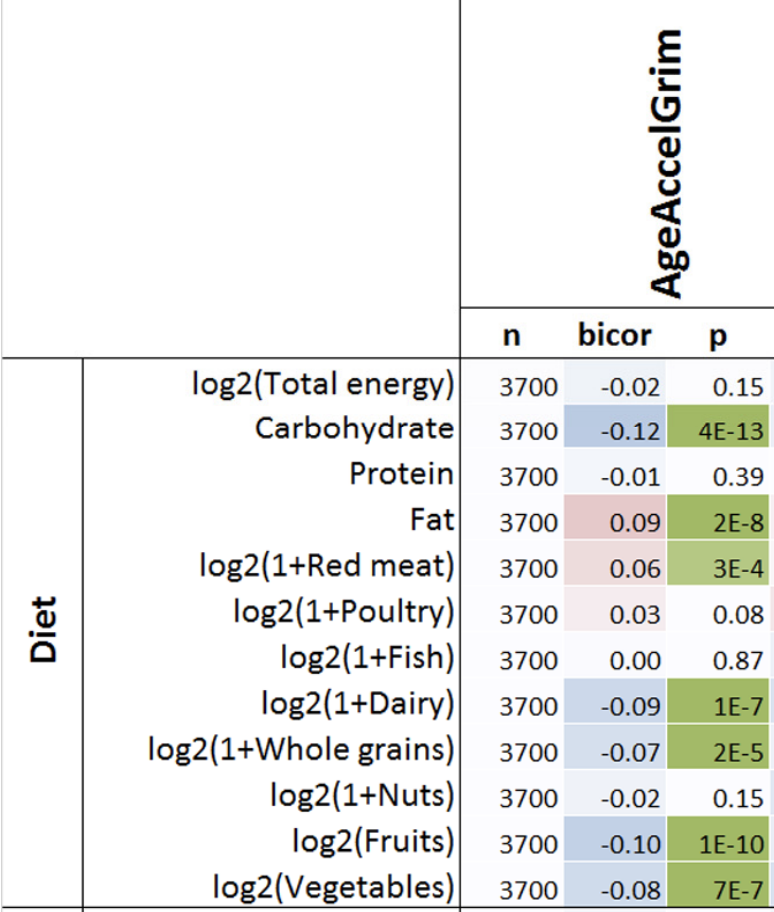
With the goal of minimizing disease risk and maximizing longevity, can epigenetic aging be slowed? Shown below is the correlation between dietary components with AgeAccelGrim. Dietary factors that were significantly associated (the column labelled, “p”) with a younger epigenetic age were carbohydrate intake, dairy, whole grains, fruit, and vegetables. In contrast, dietary fat intake and red meat were associated with older epigenetic ages (Lu et al. 2019):
Note that dietary recall data as a means for identifying nutrient intake can be unreliable-a better measure of dietary intake is circulating biomarkers. Are there associations between circulating biomarkers of nutrient intake with epigenetic aging?
Higher blood levels of carotenoids, including lycopene, alpha- and beta-carotene, lutein+zeaxanthin, and beta-cryptoxanthin were associated with a younger epigenetic age (Lu et al. 2019):
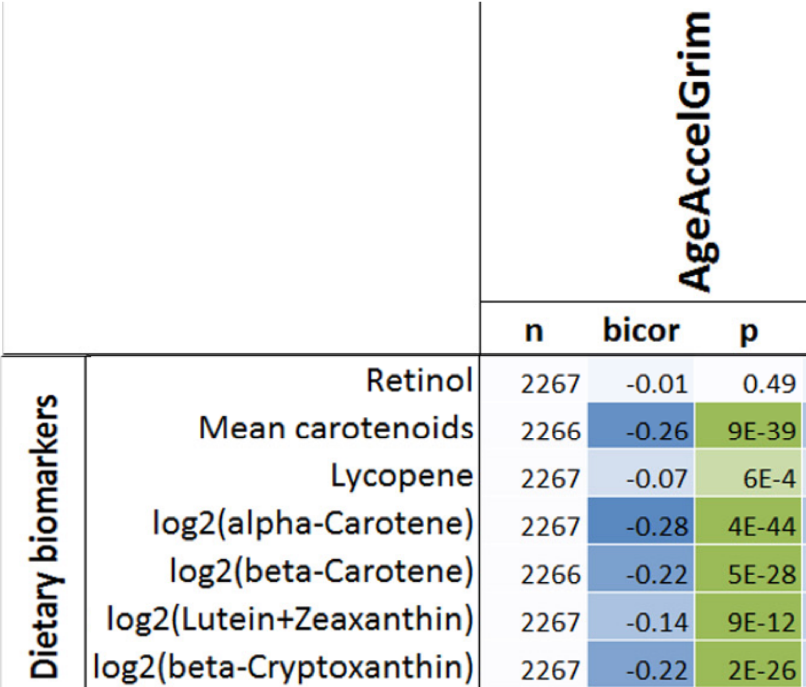
If your goal is optimal health and longevity, eating foods that are rich in these nutrients may be an important strategy for slowing epigenetic aging. Which foods contain these nutrients? Carotenoids are found almost exclusively in vegetables and fruits. For example, lycopene is enriched in watermelon and tomatoes, alpha- and beta-carotene is high in carrots, orange vegetables (sweet potato, squash, pumpkin) and greens, lutein+zeaxanthin is prevalent in greens, and beta-cryptoxanthin’s highest levels are found in butternut squash and red bell peppers.
If you’re interested, please have a look at my book!
References
Nutrient composition data: https://reedir.arsnet.usda.gov/codesearchwebapp/(S(ujsr52ygvp0tw13m1luk0rny))/CodeSearch.aspx
Lu AT, Quach A, Wilson JG, Reiner AP, Aviv A, Raj K, Hou L, Baccarelli AA, Li Y, Stewart JD, Whitsel EA, Assimes TL, Ferrucci L, Horvath S. DNA methylation GrimAge strongly predicts lifespan and healthspan. Aging (Albany NY). 2019 Jan 21;11(2):303-327. doi: 10.18632/aging.101684.
If you’re interested, please have a look at my book!
Video of my presentation starts at 14:28, and lasts until 1:29:00+!
If you’re interested, please have a look at my book!
In an earlier post, I wrote about the association between biomarkers of systemic acid-base balance (serum bicarbonate, the anion gap, urinary pH) with all-cause mortality risk (https://atomic-temporary-71218033.wpcomstaging.com/2015/08/28/serum-bicarbonate-and-anion-gap-whats-optimal/). Based on these data, systemic acidity may not be optimal for health and longevity, when compared with more alkaline values. Can circulating acid-base biomarkers be optimized through diet?
One way to optimize serum bicarbonate is with a low dietary PRAL (potential renal acid load). For a given food, PRAL is a measure of how much acid or base that the kidney will see. In subjects with normal kidney function (or with chronic kidney disease, CKD), a low dietary PRAL (alkaline-forming) is associated with high serum bicarbonate, whereas a high dietary PRAL (acid-forming) is associated with reduced serum bicarbonate (Ikizler et al. 2015):

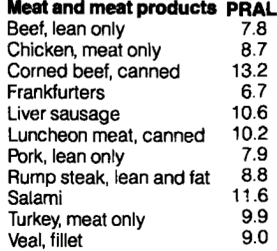
So how can we achieve a low dietary acid intake (low PRAL), with the goal of increasing serum bicarbonate? The answer is to abundantly consume foods with a low PRAL (vegetables), while minimizing foods with a high PRAL (animal products, grains). Let’s have a look at the PRAL values for several food groups (Remer and Manz, 1995):
All of the meat and meat products shown below have acid-forming, positive PRAL values:
Similarly, fish have acid-forming, positive PRAL values:

While PRAL values for milk, dairy, and eggs are generally acid-forming, there is a wider range, compared with meat and fish. For example, parmesan and cheddar cheese have high PRAL values (34.2, 26.5, respectively), whereas milk and yogurt have PRAL values ~1:

Grains are similar to animal products in terms of their PRAL values:

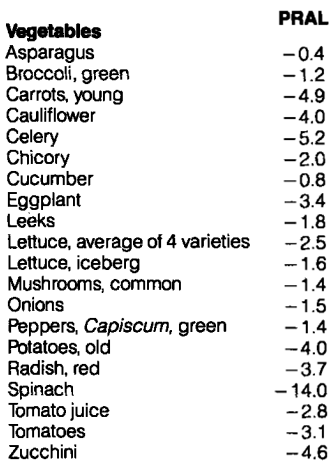
In contrast, all of the vegetables on the list below have very low, alkaline-forming PRAL values. The All-Star for a low PRAL is spinach (-14):
Similarly, most fruits have alkaline forming, low PRAL values. Although raisins seem to be the PRAL All-Star, their data (and all of the other foods on the list) are based on 100g (299 calories for raisins). For an equivalent amount of calories for strawberries, their PRAL equates to -20.6, which is similar to the raisin PRAL. Also included on the list are nuts, which contain a range of PRAL values from negative (hazelnuts) to positive (walnuts, peanuts):

What’s my dietary PRAL? To determine that, it’s first important to define the PRAL equation: PRAL = (0.49 * protein intake in g/day) + (0.037 * phosphorus intake in mg/day) – (0.02 * potassium intake in mg/day) – (0.013 * calcium intake in mg/day) – (0.027 * magnesium intake in mg/day; Remer and Manz, 1994). Using my latest 7-day average dietary data yields a very low, alkaline-forming PRAL, -121.9: (protein, 88g; phosphorus, 2038 mg; potassium, 9868 mg; calcium, 1421 mg; magnesium, 901 mg)! It’s important to note that the major contributor to my very low PRAL value comes from the potassium term. Because of my abundant vegetable intake, my potassium intake is very high, resulting in a highly alkaline PRAL. Considering that PRAL values of -40 were associated with serum bicarbonate values of ~28, my serum bicarbonate value of 31 on my last blood test (8/2015) may in part be explained by my very low dietary PRAL value, -121.9.

NEAP is more easily calculated than PRAL-all you need to know are your dietary protein and potassium intakes: NEAP = (54.5 * protein intake in grams/day)/(potassium intake in mEq/day) -10.2 (Frassetto et al. 1999). To convert your daily potassium intake from mg to mEq, divide by 39.1. Using my 7-day average protein and potassium intake data yields a NEAP = (54.5 * 88)/(9868/39.1) – 10.2 = 8.8. Based on the plot above for NEAP vs. serum bicarbonate, that again puts me on the far left, which is associated with serum bicarbonate values greater than 28.
Collectively, eating more potassium-rich vegetables will reduce PRAL and NEAP, which is associated with systemic alkalinity, as measured by an elevated serum bicarbonate. Because high serum bicarbonate levels are associated with reduced all-cause mortality risk, this may be an important strategy for improving health and longevity!
If you’re interested, please have a look at my book!
References
Frassetto LA, Todd KM, Morris RJC, Sebastian A. Estimation of net endogenous noncarbonic acid production in humans from diet potassium and protein contents. Am J Clin Nutr. 1998;68:576-583.
Ikizler HO, Zelnick L, Ruzinski J, Curtin L, Utzschneider KM, Kestenbaum B, Himmelfarb J, de Boer IH. Dietary Acid Load Is Associated With Serum Bicarbonate but not Insulin Sensitivity in Chronic Kidney Disease. J Ren Nutr. 2016 Mar;26(2):93-102.
Remer T, Manz F. Estimation of the renal net acid excretion by adults consuming diets containing variable amounts of protein. Am J Clin Nutr. 1994;59:1356-1361.
Remer, T. and Manz, F. Potential renal acid load of foods and its influence on urine pH. Journal of the American Dietetic Association 1995 ;95(7), 791-797.
Do you think Paleo diets involve eating mostly meat? While how much meat was eaten in that era is debatable, what is known is that they ate a lot of high-fiber fruits and vegetables. Shown below are the estimated daily fiber and energy intake (Eaton et al. 1997). On a 3000 calorie diet it’s estimated that those who lived in the Paleo era consumed 104 g fiber/day. That translates into 3.3 g fiber per 100 calories.
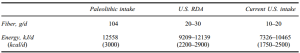
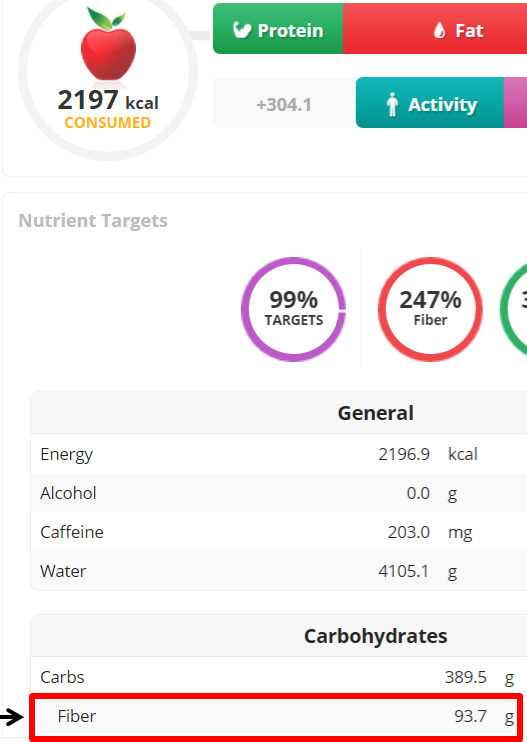
Do you consider yourself a Paleo eater? If so, do you get that much fiber? For example, I average 2200 calories per day. Based on the estimated Paleo fiber intake of 3.3g fiber/100 calories, I should average 66g or more dietary fiber per day. As shown below, my 7-day average for fiber intake is 94g/day.
If you’re interested, please have a look at my book!
Reference:
Eaton SB, Eaton SB 3rd, Konner MJ. Paleolithic nutrition revisited: A twelve-year retrospective on its nature and implications. Eur J Clin Nutr. 1997 Apr;51(4):207-16.
In previous articles I’ve written about the heath benefits of eating whole grains, which have been shown in large epidemiological studies to be associated with reduced all-cause mortality risk. Based on this data, the USDA’s MyPlate recommends a minimum of 3.5 oz, up to 7 oz. of whole grains on a 2200 calorie diet. 3.5 servings of barley yields 350 calories, whereas 7 oz. yields 700. In terms of percentage of total calories, MyPlate recommends that 16-32% of daily calories should come from whole grains.
In terms of vegetables, MyPlate’s recommendations are shown below. They recommend 3 servings of vegetables per day, with these amounts varied between green vegetables (and other vegetables), red and orange vegetables, beans and peas, and starchy vegetables. For ease of calculation I grouped ‘other vegetables’ with green vegetables. Based on the recommended weekly servings for each group and representative foods, I calculated weekly calorie amounts for each group. Average veggie calories per day = 187. Divided by 2200 calories, that equals 8.5% of total calories.

So clearly MyPlate wants us to eat between 2-4 fold more whole grains than veggies, in terms of total daily calories, but why is that? In a meta-analysis of 7 studies including 660,186 subjects, increased vegetable consumption is also associated with reduced mortality risk, as shown below:

Maybe whole grains are superior to veggies in terms of nutrient density? To see if that’s true, in the Table below I compared the nutrient composition of broccoli, spinach and romaine lettuce against barley (the king of grains for fiber), whole wheat spaghetti and oats. How do they compare in terms of macronutrients, when each has 100 calories? First, it should be obvious that to get 100 calories of veggies (see the serving column), you will eat significantly more food. To most, this will seem like a bad thing. But more chewing for the same amount of calories may end up in eating less, an important fact because of the worldwide explosion in obesity rates. Second, each of these veggies have 2-3 fold more protein and 3-4 fold more fiber than than whole grains. So far, veggies are far superior to whole grains.

What about vitamin content? As shown below, veggies crush whole grains for vitamin content. Whole grains are not better than veggies in terms of vitamin content for any category.

Maybe mineral content is better in whole grains? As shown below, they’re not. Veggies are much better in 9/10 mineral categories, with whole grains having marginally more selenium than veggies.

Based on these data, I have now dramatically increased my daily vegetable intake, while reducing my whole grain intake. Shown below is a snapshot of today’s veggie (and some other foods, too) intake, and it’s also important to mention that this amount is now representative of my daily vegetable intake. I haven’t eliminated whole grains, only minimized them.

My total veggie intake between carrots, beets, green peas, corn, asparagus and 1 pickle spear is 50.6 oz, or 1416 grams. Considering that 1 serving of vegetables = 80g, I ate 17.7 servings of veggies today. That amount is almost equal to what MyPlate recommends to eat in 1 week!
If you’re interested, please have a look at my book!
References:
Nutrition data from ndb.nal.usda.gov
Wang X, Ouyang Y, Liu J, Zhu M, Zhao G, Bao W, Hu FB. Fruit and vegetable consumption and mortality from all causes, cardiovascular disease, and cancer: systematic review and dose-response meta-analysis of prospective cohort studies. BMJ. 2014 Jul 29;349:g4490.

In an earlier I post I hypothesized that gut bacteria may be involved in mechanisms that affect lifespan. Because gut bacteria ferment dietary fiber to make short chain fatty acids such as butyrate, which may be involved in processes that mediate lifespan, investigation of large-scale epidemiological studies about the association between dietary fiber intake with all-cause mortality would be a good way to test this hypothesis. While this post won’t summarize all of the studies that relate fiber intake to mortality risk, in future posts I will sequentially investigate all the studies that have examined this association.
The Dietary National Institutes of Health-AARP Diet and Health Study (Park et al. 2011) included 567,169 men and women, aged 50–71 years who provided dietary intake data for a 9-year period. Dietary intakes were assessed with a self-administered 124 item food frequency questionnaire.
Compared with the lowest dietary fiber intake (13g in men, 11g in women), death from all causes was reduced by 22%, when compared with those with the highest intake (29g in men, 26g in women). So, the answer is to eat more fiber! I should say it’s easy to get 30 grams of fiber/day. That’s pretty close to my breakfast, which includes 100g of flaxseed, 35g yacon and ~90g of medjool dates.
Which dietary component was associated with this reduced risk, fiber from grains, fruits, vegetables or beans? Relative risk (including 95% confidence intervals) for men is shown in Table 1.
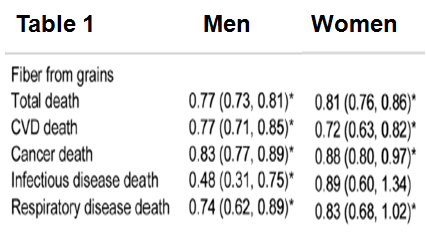
In comparison with the lowest grain fiber intake, those with the highest intake had significantly reduced risk of 23%, 23%, 17%, 52% and 26% death from all causes, cardiovascular disease, cancer, infectious diseases and, respiratory diseases, respectively. In women, fiber from grains significantly reduced mortality risk for each of these categories by 17-28%, with the exception of deaths from infectious disease. So, for the Paleo types who say don’t eat whole grains, the evidence doesn’t support that idea!
In Table 2 we see that fiber from fruits was not significantly associated with reduced mortality risk for any outcome. Does that mean don’t eat fruit? No. Fruit intake is well documented to be associated with improved health, so other components besides fruit fiber are likely involved.

What about mortality risk for fiber from vegetables (Table 3)?

In men, compared with the lowest vegetable fiber intake, those with the highest vegetable fiber intake had 5% and 8% significantly reduced all-cause mortality risk and, cancer deaths, respectively. In women, all-cause mortality was significanty reduced by 5%, whereas respiratory disease deaths were reduced by 28%.
The association between fiber from beans with mortality risk is shown in Table 4.
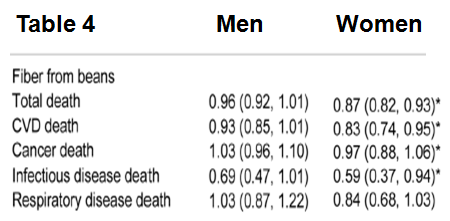
Fiber from beans was not associated with reduced mortality risk for any outcome in men, but, all-cause, CVD, cancer and infectious disease deaths were significantly reduced by 13%, 17%, 3% and 41%, respectively in women.
The take home message? Eat more fiber!
If you’re interested, please have a look at my book!
References:
Park Y, Subar AF, Hollenbeck A, Schatzkin A. Dietary fiber intake and mortality in the NIH-AARP diet and health study. Arch Intern Med. 2011 Jun 27;171(12):1061-8.
