Category Archives: albumin

1.7 Years of Biological Aging In The Past 3.6 Years

In an earlier post (https://michaellustgarten.wordpress.com/2018/06/26/maximizing-health-and-lifespan-is-calorie-restriction-essential/), I documented my aging.ai biologic age for 13 blood test measurements from 2016 – 2019. If you missed that post, here are those data:
agingai2Note that note my average biologic age has slowly increased from 2016 to 2019, from 28y in 2016 (2 measurements), to 29.25y in 2017 (6 measurements), to 29.5y in 2018 (6 measurements), to 30y in my June 2019 measurement.

To gain more insight into my 2019 prediction for biologic age, I kept measuring. On September 17, 2019, I had my worst biological age to date, 33y, based on the blood test data below:
Screen Shot 2019-11-03 at 3.51.05 PM.png

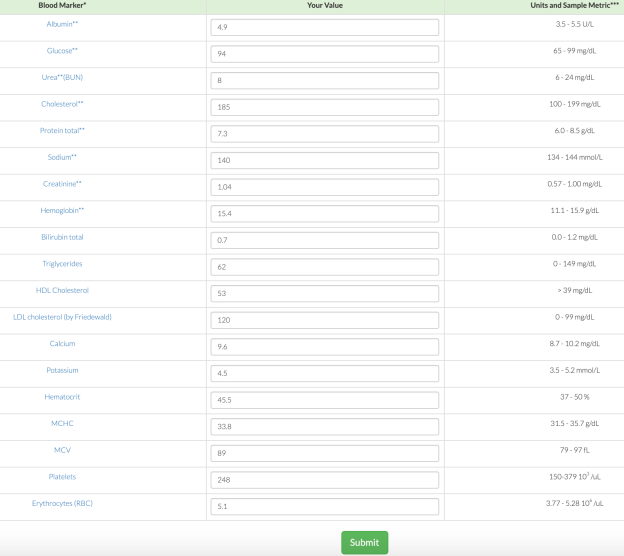
Seeing a biological age that high (for me) was the motivation that I needed to finally stick to a mild caloric restriction, which I hypothesized would positively affect my biological age. I wrote about this in my recent Phenotypic Age post (https://michaellustgarten.wordpress.com/2019/11/01/biological-age-31-3y-chronological-age-46y/). Did it work? Shown below is my blood test data for October 29th.

Screen Shot 2019-11-03 at 4.07.28 PM

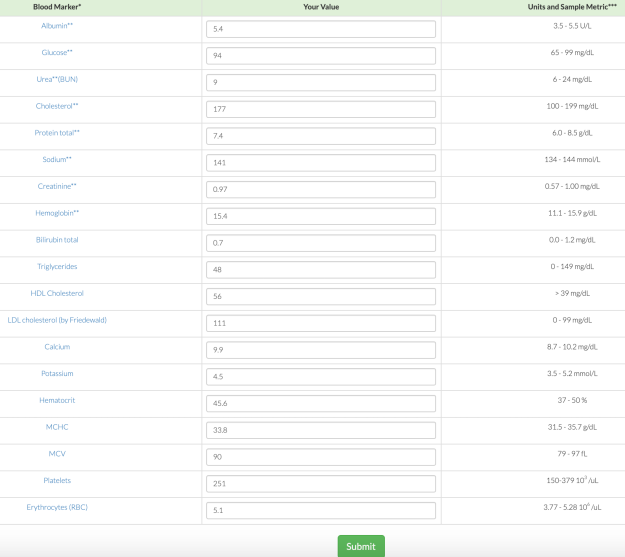
Based on that data, my biological age was 28y, and when averaging the 3 measurements in 2019 (so far!), my average biological age is 29.67y. When considering that my average biological age in 2016 was 28y, it looks like I’ve only aged ~1.7 years in 3.58 years of elapsed time!


If you’re interested, please have a look at my book!

Biological Age = 31.3y, Chronological Age= 46y

On June 10, 2019 (for the first time) I measured all of the blood test variables that are included in the biologic age calculator, Phenotypic Age, and ended up with a biological age = 35.39y (https://michaellustgarten.wordpress.com/2019/09/09/quantifying-biological-age/).

While that value is 23% younger than my chronological age (46y), I knew that I could do better! So I tried again on September 17, 2019. Basically, the same biological age, 35.58y:

pheno 8_2019.png

An 23% younger biological age on 2 separate dates, months apart might be good for most, but not for me. So, I tried again on October 29th, 2019, and voila, a biological age of 31.3y, which is 32% younger than my chronological age! How did I do it?

oct pheno.png

From my last blood test until my most recent blood test, I attempted a mild caloric restriction. To maintain my body weight, I require about 2800 calories per day, an amount which is based on daily body weight weighing in conjunction with daily dietary tracking. For the period of time that elapsed between my last 2 blood tests, I averaged 2657 calories/day, which is 3.2% less than the 2745 calories/day that I averaged for the dietary period that corresponded to my September blood test. That I was also in a very mild caloric restriction is confirmed by a reduction in my average body weight, which was (purposefully) down 0.7 lbs from September 17 to October 29th, when compared with the dietary period that corresponded to my September blood test (August 20 – September 17).

This is a superficial analysis of how I further reduced my biological age, but in future posts I’ll report the average dietary intake that corresponded to my relatively youthful biologic age!

If you’re interested, please have a look at my book!