Tag Archives: Phenotypic Age

Quantifying Biological Age: Blood Test #3 in 2022

Join us on Patreon! https://www.patreon.com/MichaelLustgartenPhD

Levine’s Biological age calculator is embedded as an Excel file in this link from my website: https://michaellustgarten.com/2019/09/09/quantifying-biological-age/

An epigenetic biomarker of aging for lifespan and healthspan https://pubmed.ncbi.nlm.nih.gov/29676998/

Underlying features of epigenetic aging clocks in vivo and in vitro https://pubmed.ncbi.nlm.nih.gov/32930491/

Population Specific Biomarkers of Human Aging: A Big Data Study Using South Korean, Canadian, and Eastern European Patient Populations https://pubmed.ncbi.nlm.nih.gov/29340580/

Advertisement

Quantifying Biological Age: Blood Test #5 in 2020

My latest blood test results are in-how’s my biological age?

In the video I discuss my dietary approach prior to my latest blood test, the blood test results, and my plan to improve them with diet going forward.

Quantifying Biological Age: Blood Test Measurement #3 in 2020

In this video, I discuss data for 6 blood test measurements since 2018 that show a Phenotypic (Biological) Age that is ~14 years than my current age (47y).
 

15+ Years Younger Than My Chronological Age: Blood Test #2 In 2020

Exactly 1 month ago, my first biological age measurement of 2020 was 32.75y (https://michaellustgarten.wordpress.com/2020/02/14/biological-age-32-75y-chronological-age-47y-first-2020-measurement/). When considering that my chronological age is 47y, that’s a 14 year improvement, but I wasn’t (and still aren’t) satisfied. When I sent my blood for analysis, I was battling a mild upper respiratory infection (cough, no fever), which likely raised my WBCs, thereby resulting in a higher biologic age. Also, I was experimenting with a higher intake of meat, eggs, and cheese, to see what affect that it would have on my circulating biomarkers. On that blood test in February, my creatinine levels were higher than my 2015-2020 average value, and if those foods were associated with circulating levels of creatinine, reducing them should also reduce creatinine, and accordingly, further improve my biological age. I also assumed that all other variables on Levine’s Phenotypic Age calculator would be unchanged.

On March 9 2020, I sent my blood for analysis so that I could calculate biological age with Levine’s PhenotypicAge. Almost exactly as expected, my WBCs (4.7 * 10^3 cells/microliter) were closer to my 2015-2020 average value (4.6), rather than the higher value (5.8) in my blood test last month. Similarly, reducing my intake of beef, eggs, and cheese brought creatinine from 1.08 to 0.97 mg/dL, which is closer to its 5-year average (0.94 mg/dL). As a result, I further reduced my biological age by 1.14 years to 31.61y, which is 15+ years younger than my chronological!

pa 3.9.2020

Because I track my diet every day, I can investigate the correlation between my meat, eggs, and cheese intake with creatinine. I now have 8 blood tests that correspond to dietary data, and interestingly, there is a moderately strong correlation between my average daily beef+egg+cheese intake with creatinine (r = 0.55). Based on these data, I’m going to continue to minimize consumption of these foods, with the goal of optimizing creatinine.cr mec intake

On a final note, I also expected to further reduce my CRP from 0.3 to something lower, but it slightly increased to 0.37 mg/L. While that is far from a high value, lower is better, and in future blood tests I’ll try to figure out how to further reduce it.

If you’re interested in calculating your biological age, here’s the Excel link:

DNAmPhenoAge_gen (1)


Which Blood Test Analyte Is Most Important For Predicting Biologic Age?

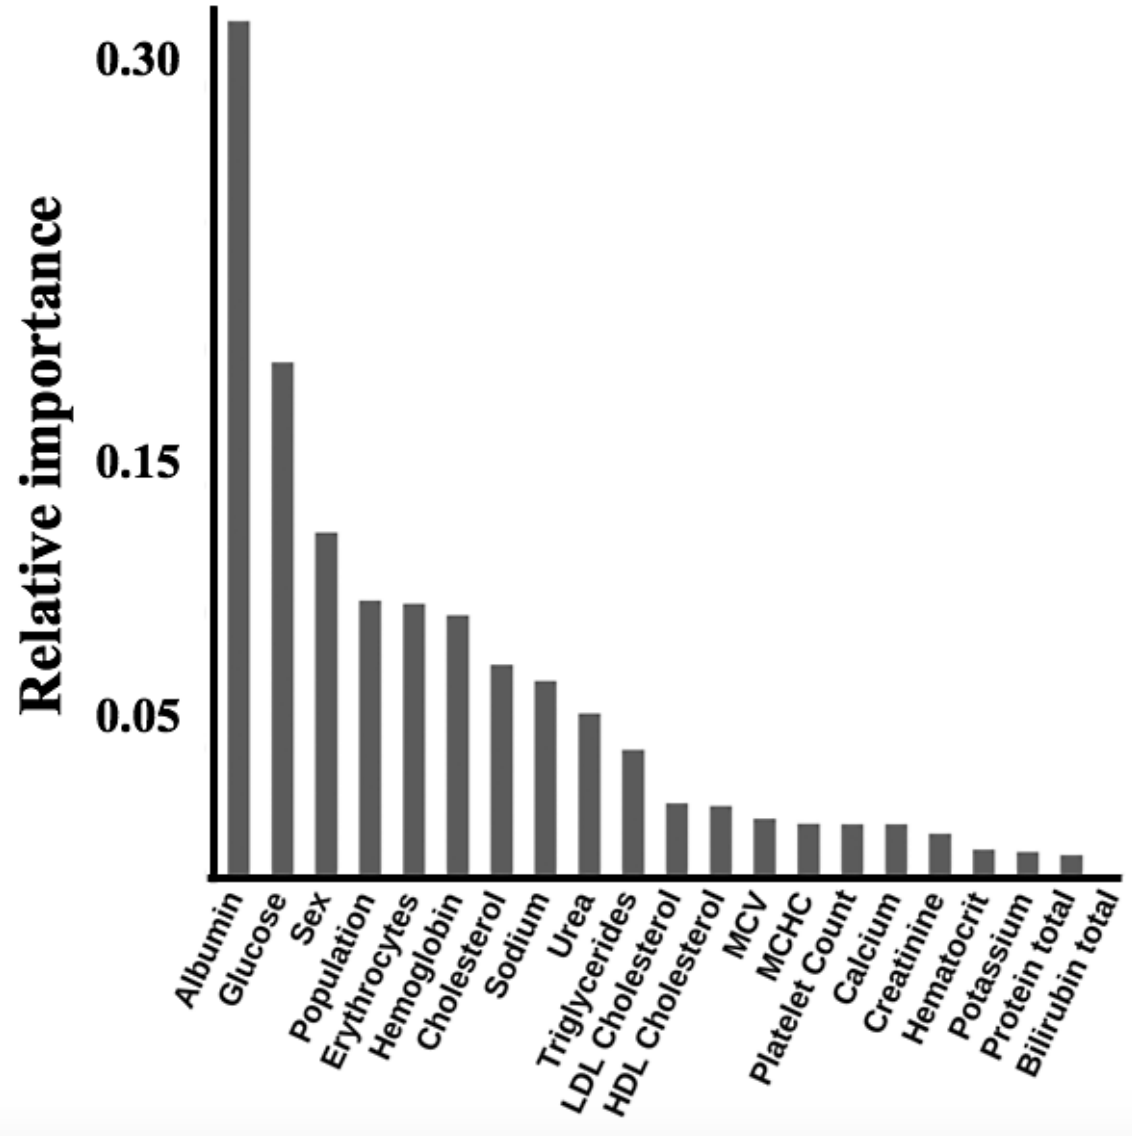
Three studies have investigated the ability of blood test analytes to predict biological age. First, when considering the top 20 variables that were associated with biological age in aging.ai, albumin contributed most to this prediction, almost 2x more than circulating levels of glucose (Mamoshina et al. 2018):

Screen Shot 2019-12-01 at 1.04.59 PM.png

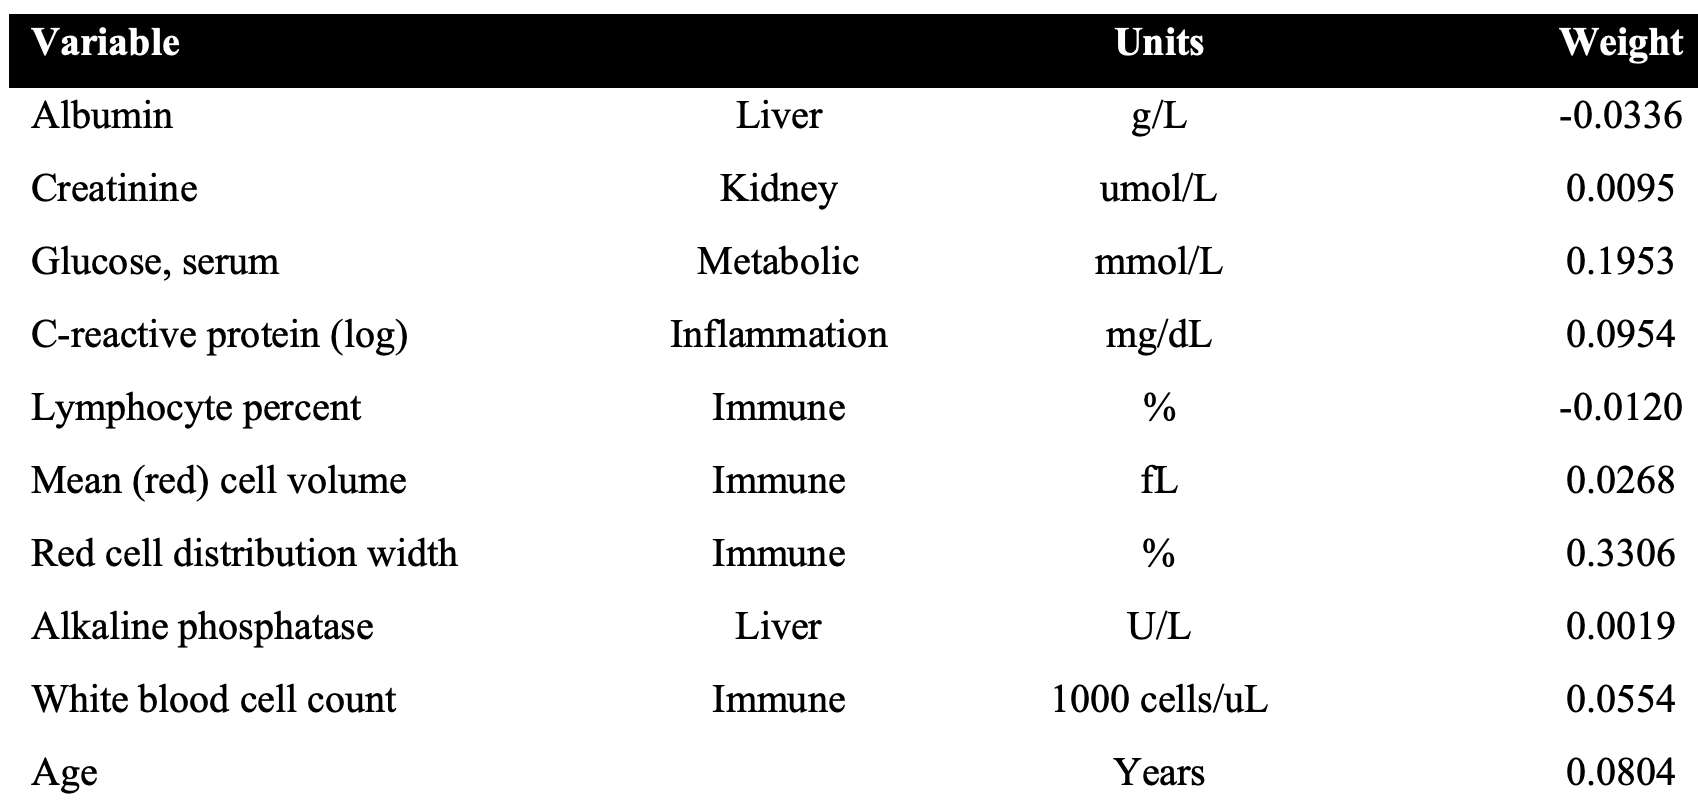
Second, albumin was one of the 9 blood test variables that were best able to predict biological age when using the Phenotypic Age calculator.  However, as shown below, it didn’t come in first place, but fifth. Interestingly, the analyte that contributed most to biological age prediction was the red cell distribution width (RDW%), with glucose again in second place (Levine et al. 2018):

Screen Shot 2019-12-01 at 1.21.58 PM

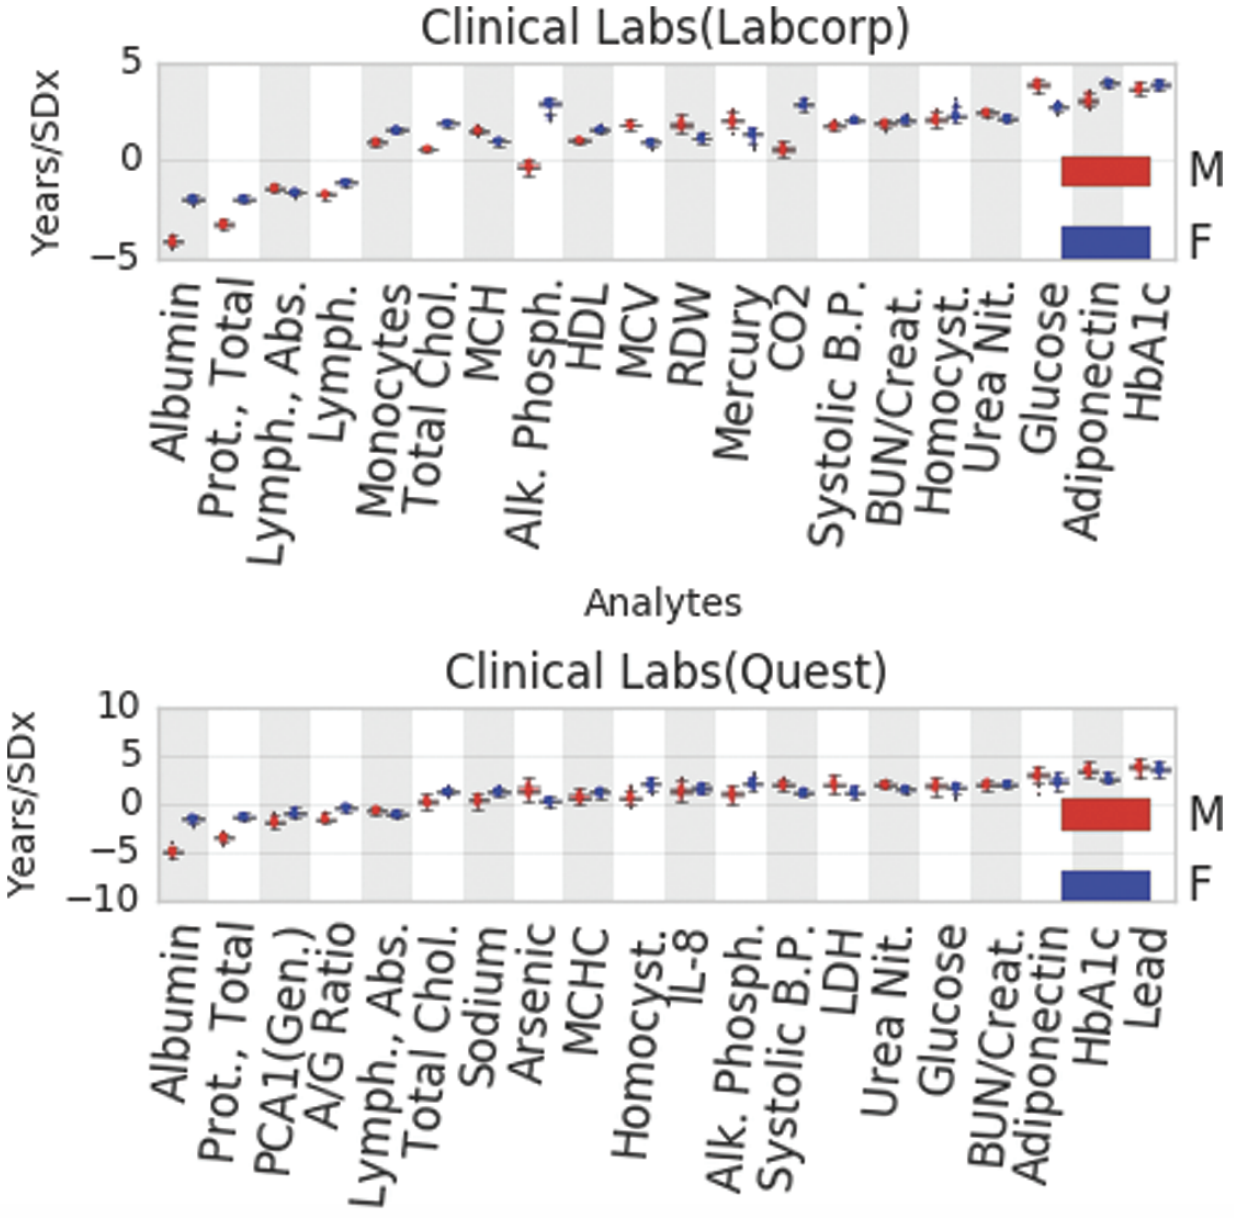
Third, Earls et al. (2019) used the Klemera-Doubal algorithm (Klemera and Doubal, 2006) in conjunction with blood test data to predict biological age. Regardless if the blood was analyzed by Labcorp or Quest, higher levels of albumin (the left side of both images below) were associated with the greatest reduction in biological age, up to 5 years! In contrast, HbA1c was associated with a higher biological age when measured by Labcorp (top image, right side), and second to lead in the Quest analysis (bottom image, right side). Interestingly, glucose came in third and fifth in the Labcorb and Quest data sets, respectively, in terms of its positive association with biological age.

Screen Shot 2019-12-01 at 12.59.22 PM

Glucose would’ve been an obvious choice, but would you have guessed that albumin may be just as important, and potentially more important for predicting biological age?


If you’re interested, please have a look at my book!

References

Earls JC, Rappaport N, Heath L, Wilmanski T, Magis AT, Schork NJ, Omenn GS, Lovejoy J, Hood L, Price ND. Multi-Omic Biological Age Estimation and Its Correlation With Wellness and Disease Phenotypes: A Longitudinal Study of 3,558 Individuals. J Gerontol A Biol Sci Med Sci. 2019 Nov 13;74(Supplement_1):S52-S60. doi: 10.1093/gerona/glz220.

Klemera P, Doubal S. A new approach to the concept and computation of biological age. Mech Ageing Dev. 2006;127:240–248. doi:10.1016/j. mad.2005.10.004

Levine ME, Lu AT, Quach A, Chen BH, Assimes TL, Bandinelli S, Hou L, Baccarelli AA, Stewart JD, Li Y, Whitsel EA, Wilson JG, Reiner AP, Aviv A, Lohman K, Liu Y, Ferrucci L, Horvath S. An epigenetic biomarker of aging for lifespan and healthspanAging (Albany NY). 2018 Apr 18;10(4):573-591. doi: 10.18632/aging.101414.

Mamoshina P, Kochetov K, Putin E, Cortese F, Aliper A, Lee WS, Ahn SM, Uhn L, Skjodt N, Kovalchuk O, Scheibye-Knudsen M, Zhavoronkov A. Population specific biomarkers of human aging: a big data study using South Korean, Canadian and Eastern European patient populations. J Gerontol A Biol Sci Med Sci. 2018 Jan 11.

Biological Age = 31.3y, Chronological Age= 46y

On June 10, 2019 (for the first time) I measured all of the blood test variables that are included in the biologic age calculator, Phenotypic Age, and ended up with a biological age = 35.39y (https://michaellustgarten.wordpress.com/2019/09/09/quantifying-biological-age/).

While that value is 23% younger than my chronological age (46y), I knew that I could do better! So I tried again on September 17, 2019. Basically, the same biological age, 35.58y:

pheno 8_2019.png

An 23% younger biological age on 2 separate dates, months apart might be good for most, but not for me. So, I tried again on October 29th, 2019, and voila, a biological age of 31.3y, which is 32% younger than my chronological age! How did I do it?

oct pheno.png

From my last blood test until my most recent blood test, I attempted a mild caloric restriction. To maintain my body weight, I require about 2800 calories per day, an amount which is based on daily body weight weighing in conjunction with daily dietary tracking. For the period of time that elapsed between my last 2 blood tests, I averaged 2657 calories/day, which is 3.2% less than the 2745 calories/day that I averaged for the dietary period that corresponded to my September blood test. That I was also in a very mild caloric restriction is confirmed by a reduction in my average body weight, which was (purposefully) down 0.7 lbs from September 17 to October 29th, when compared with the dietary period that corresponded to my September blood test (August 20 – September 17).

This is a superficial analysis of how I further reduced my biological age, but in future posts I’ll report the average dietary intake that corresponded to my relatively youthful biologic age!

If you’re interested, please have a look at my book!