Circulating levels of calcium can deposit in the coronary arteries (and in other arterial sites), a process that is known as coronary artery calcification (CAC). Arterial calcification is associated with arterial stiffness, which increases risk for adverse cardiovascular events, including cardiovascular disease-related mortality (Allison et al. 2012).
Can CAC accumulation be slowed/minimized/prevented? One possible factor may involve the dietary intake of magnesium (Mg). As shown below, adults (average age, ~53y) that had a median dietary Mg intake of 425 mg/day had ~50% reduced odds of having any CAC, when compared with lower Mg intakes (Hruby et al. 2014):

Getting at least 425 mg of dietary Mg is relatively easy for me. Plotted below is my dietary magnesium intake for the 365 day period from August 31, 2018 until September 2, 2019. All of that comes from food, as I don’t supplement with Mg. In addition, my average daily Mg intake during that period is 786 mg/day (red line):
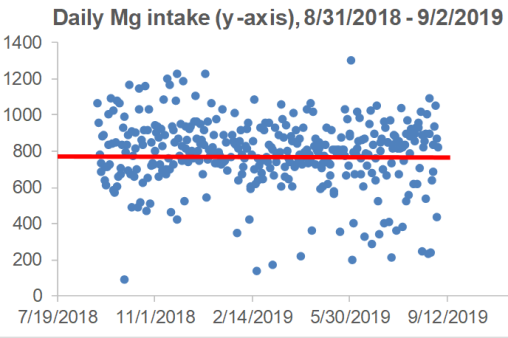
Based on my average Mg intake, my odds for having any CAC should be minimized. However, the best approach would be to actually measure CAC. Stay tuned for that data, sometime later this year!
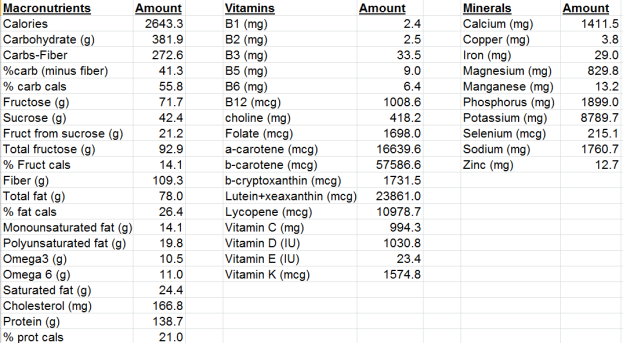
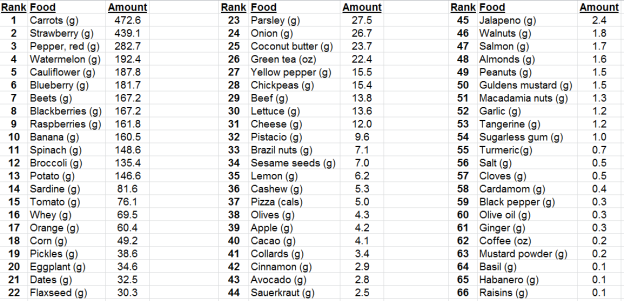
Which foods contribute to my 786 mg Mg intake/day? ~14% of that comes from spinach, as over that same time period, I averaged 4.82 oz. of spinach/day, which supplies 107 mg of Mg. Other moderate sources of Magnesium (for me) come from carrots and bananas (~59 mg/day each), strawberries (43 mg/day), red bell peppers (37 mg/day), broccoli (26 mg/day), cacao beans (23 mg/day), and others.
If you’re interested, please have a look at my book!
References
Allison MA, Hsi S, Wassel CL, Morgan C, Ix JH, Wright CM, Criqui MH. Calcified atherosclerosis in different vascular beds and the risk of mortality. Arterioscler Thromb Vasc Biol. 2012 Jan;32(1):140-6.
Hruby A, O’Donnell CJ, Jacques PF, Meigs JB, Hoffmann U, McKeown NM. Magnesium intake is inversely associated with coronary artery calcification: the Framingham Heart Study. JACC Cardiovasc Imaging. 2014 Jan;7(1):59-69.