The percentage of lymphocytes is one of the 9 blood test variables included in the biological age calculator, Phenotypic Age (https://michaellustgarten.wordpress.com/2019/09/09/quantifying-biological-age/). The reference range for lymphocyte % is 20 – 40% of the total amount of white blood cells (WBCs), but are higher or lower values optimal for health and longevity?
To answer that question, it’s important to know how levels of lymphocytes change during aging, and its association with risk of death for all causes. In one of the earliest studies to examine how the percentage of lymphocytes changes with age, Levine (2013) reported that lymphocyte % significantly decreased during aging in 9,389 adults (age range, 30 – 75y). However, the absolute values for these changes, i.e. from 40% to 30%, for ex., was not reported.
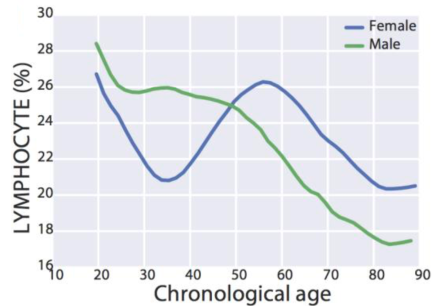
Similarly, lymphocyte % decreased during aging in a much larger study (377,686 subjects; age range, 18 – 85y; Wang et al. 2017):

Interestingly, for women, lymphocyte % decreased from 27% to 21% from 20 – 35y, increased from 21% to 26% from 35 – 55y, then again decreased from 26% to 20% from 55y to 85y. In contrast, lymphocyte % more steadily decreased for men, from 28% to 17% from 20 – 85y.
Based on the aging data, higher values for lymphocyte % are are associated with biologic youth, whereas lower values are found in older adults. Although there are few studies that have investigated associations between lymphocyte % with aging or disease risk, in contrast, more studies have been published for absolute levels of lymphocytes.
In a small study of 106 older adults (> 85y) that were healthy (i.e. free of disease) at baseline, lymphocytes less than 1.14*10^9 cells/L (equivalent to 1140*10^6 cells/L) was associated with an increased risk of death for all causes, when compared with 1850*10^6 cells/L (Izaks et al. 2003):

In a larger study (624 subjects), lymphocytes less than 1540*10^6 cells/L was associated with a significantly shorter average lifespan (~5y; 0.5 proportion remaining below), when compared with 1540 – 2040*10^6 cells/L . Also note that survival for the group that had 1540 – 2040*10^9 lymphocytes/L was not significantly different from the group that had more than 2040*10^9 lymphocytes/L (Leng et al. 2005):
In agreement with the smaller studies, lymphocytes < 1300 and < 1200*10^6 cells/L in women and men (red and blue, far left), respectively was associated with an increased all-cause mortality risk, when compared with average lymphocyte values ~1900*10^6 cells/L (decile 5) in a larger study that included 262,394 non-smokers (age range, 37 – 73y; Welsh et al. 2018):

Collectively, these data suggest that higher values for lymphocyte % and for the absolute amount of lymphocytes may be optimal for minimizing disease risk and for maximizing longevity. If both are low, can they be raised? Circulating levels of lymphocytes are reduced during zinc deficiency (Fraker and King, 2001), so monitoring zinc intake, then increasing it to at least the RDA may be a first step towards increasing lymphocyte levels and %.
If you’re interested, please have a look at my book!
References
Fraker PJ, King LE. A distinct role for apoptosis in the changes in lymphopoiesis and myelopoiesis created by deficiencies in zinc. FASEB J. 2001 Dec;15(14):2572-8.
Izaks GJ, Remarque EJ, Becker SV, Westendorp RG. Lymphocyte count and mortality risk in older persons. The Leiden 85-Plus Study. J Am Geriatr Soc. 2003 Oct;51(10):1461-5.
Leng SX, Xue QL, Huang Y, Ferrucci L, Fried LP, Walston JD. Baseline total and specific differential white blood cell counts and 5-year all-cause mortality in community-dwelling older women. Exp Gerontol. 2005 Dec;40(12):982-7.
Levine ME. Modeling the rate of senescence: can estimated biological age predict mortality more accurately than chronological age? J Gerontol A Biol Sci Med Sci. 2013 Jun;68(6):667-74. doi: 10.1093/gerona/gls233.
Wang Z, Li L, Glicksberg BS, Israel A, Dudley JT, Ma’ayan A. Predicting age by mining electronic medical records with deep learning characterizes differences between chronological and physiological age. J Biomed Inform. 2017 Dec;76:59-68. doi: 10.1016/j.jbi.2017.11.003.
Welsh C, Welsh P, Mark PB, Celis-Morales CA, Lewsey J, Gray SR, Lyall DM, Iliodromiti S, Gill JMR, Pell J, Jhund PS, Sattar N. Association of Total and Differential Leukocyte Counts With Cardiovascular Disease and Mortality in the UK Biobank. Arterioscler Thromb Vasc Biol. 2018 Jun;38(6):1415-1423. doi: 10.1161/ATVBAHA.118.310945.
