Category Archives: Nutrient Comparisons

Dietary fiber from whole grains is associated with reduced mortality risk-which grains are highest in fiber?

In an earlier post I reported that dietary fiber from whole grains is associated with reduced mortality risk for all causes, cardiovascular disease, cancer, respiratory and infectious disease in both men and women (https://atomic-temporary-71218033.wpcomstaging.com/2014/08/02/is-dietary-fiber-associated-with-reduced-mortality/).

More specifically, which whole grains are highest in fiber?

Shown below are grams of dietary fiber per 100 grams (uncooked) for each respective grain.

grain fiber

It should be clear from the table that barley (16.6g) and rye (15.1g) are the all-stars for grains with the highest amounts of dietary fiber per 100g. Wheat (12.2g) and oats (10.6g) are also excellent sources. Because of the association between dietary fiber from grains and reduced mortality risk, it might be a good idea to add these foods to your diet!

If you’re interested, please have a look at my book!

Wild Rice: The protein-rich grain that almost nobody knows about!

In an earlier article I wrote about which grain is the best source for total protein, essential amino acids, branched chain amino acids (leucine, isoleucine and valine; BCAA) and arginine, from a list of grains that included oats, quinoa, corn, brown rice, potato, barley and millet (http://atomic-temporary-71218033.wpcomstaging.com/2014/07/30/which-grain-is-the-best-source-for-protein-essential-amino-acids-bcaa-and-arginine).

However, I have recently discovered that wild rice is also a high-protein containing grain, comparable to that of oats and better than quinoa. In this article I will compare total protein, essential amino acids, BCAA, arginine and glutathione precursor amino acid (glutamate, cysteine, glycine) content of wild rice to that of oats, quinoa and corn.

How does wild rice compare with oats, quinoa and corn in terms of total protein content (in grams, g) per 100 calories? First, it is important to mention that the serving size needed to yield 100 calories is shown in all tables: oats, 25.7g; wild rice, 28g; quinoa, 27.2g; corn, 116g. As shown in Table 1 below, oats are best, with 4.34g of protein per 100 calories. Although oats have more protein than wild rice, wild rice has more protein than both quinoa and corn (4.1g, wild rice; 3.84g, quinoa; corn, 3.79g)!

Table 1.

t1

How do these grains rank in terms of total essential amino acid (EAA) content? As shown in Table 2, oats are best, with 1.551g of EAA per 100 calories. Second, and better than quinoa once again is wild rice, with 1.488g of EAA.

Table 2.

t2

What about BCAA content, which is well known to stimulate protein synthesis (Blomstrand 2006)? As shown in Table 3, amazingly, corn contains more BCAA’s than any of the other grains, with 769 mg. Second are oats, with 749 mg, then wild rice at 698 mg, and finally, quinoa, with 527 mg. Once again, wild rice beats quinoa!

Table 3.

t4

What about arginine content? Arginine is the precursor for the production of nitric oxide, which has been claimed to promote vasodilation in active muscle during exercise, thereby improving strength, power and recovery (Alvares et al. 2011). In terms of arginine content, wild rice is best, with 318 mg per 100 calories. Second are oats, with 306 mg. Third is quinoa with 297 mg, followed by corn, with 152 mg. Once again, a solid showing by wild rice!

What about amino acid content for glutamate, cysteine and glycine, the precursor amino acids for the formation of the antioxidant glutathione (GSH)? GSH is the most abundant antioxidant in our cells, and therefore, supplying its precursor amino acids will yield maximal GSH production (Sekhar et al. 2011). In Table 4 we see that oats contain the most combined glutamate, cysteine and glycine, with 1275 mg per 100 calories. But, once again beating quinoa is wild rice, with 955 mg. Corn (915 mg) and quinoa (751 mg) bring up the back of the list.

Table 4.

t5

In sum, quinoa is well-popularized to be a protein-rich grain. However, in a previous analysis, oats were found to be better than quinoa in terms of total protein, EAA and BCAA content, and, arginine. Results from this analysis show that wild rice is also better than quinoa in each of these categories, and, has a higher amount of precursor amino acids needed for GSH synthesis.

So, go get some wild rice!

If you’re interested, please have a look at my book!

References
Álvares TS, Meirelles CM, Bhambhani YN, Paschoalin VM, Gomes PS. L-Arginine as a potential ergogenic aid in healthy subjects. Sports Med. 2011 Mar 1;41(3):233-48.

Blomstrand E, Eliasson J, Karlsson HK, Köhnke R. Branched-chain amino acids activate key enzymes in protein synthesis after physical exercise. J Nutr. 2006 Jan;136(1 Suppl):269S-73S.

Nutritional data provided by http://www.nal.usda.gov/fnic/foodcomp/search/

Sekhar RV, Patel SG, Guthikonda AP, Reid M, Balasubramanyam A, Taffet GE, Jahoor F. Deficient synthesis of glutathione underlies oxidative stress in aging and can be corrected by dietary cysteine and glycine supplementation. Am J Clin Nutr. 2011 Sep;94(3):847-53.

Restoring Boiling-Induced Sulforaphane Depletion in Broccoli with Mustard Powder!

One of the benefits that comes from eating cruciferous vegetables like broccoli and purple cabbage is consumption of sulforaphane, a naturally occurring anticancer compound. However, do you know that boiling these vegetables for longer than 4 minutes destroys most of their sulforaphane? Besides eating these vegetables raw (I like purple cabbage raw, but not broccoli) are there any foods that when combined reduce sulforaphane destruction? Luckily, the answer is yes!

In the figure below, the white bars indicate the amount of sulforaphane present after 4, 8 or 12 minutes of boiling. Boiling broccoli for 8 minutes destroys almost 2/3 of its sulforaphane, and after 12 minutes, sulforaphane is ~75% reduced. Adding ground mustard seeds (grey bars) at a relative to broccoli concentration of 1% or 2% restored broccoli’s sulforaphane content almost completely back to initial levels after 4, 8 and 12 minutes of boiling. It’s important to note that a mustard seed concentration of 1%, relative to broccoli translates into 3 grams of mustard seed powder per 300 grams of broccoli! That’s not a lot!

broccoli sulfurophane 2

If you’re interested, please have a look at my book!

Reference

Ghawi SK, Methven L, Niranjan K. The potential to intensify sulforaphane formation in cooked broccoli (Brassica oleracea var. italica) using mustard seeds (Sinapis alba). Food Chem. 2013 Jun 1;138(2-3):1734-41.

Which grain is the best source for protein, essential amino acids, BCAA and arginine?

Listed below are total protein, essential amino acids, branched chain amino acids, and arginine content for quinoa, oats, corn, millet, barley, brown rice and potato. The values provided are for 100 calories, for each respective grain.

Let’s ask some questions:

1. Is there a difference in protein content among these 7 grains?

Yes, there is a difference. Per 100 calories, oats are king, containing more than 2x the amount of protein in barley, the lowest ranking grain on this list. In fact, oats, quinoa and corn each have approximately 2x more total protein than each of the lowest ranking grains, potato, brown rice and barley. Millet is intermediate, at 2.95 grams of protein per 100 calories.

Table 1 Grains

2. Can these grains be considered as “complete protein”?

A “complete protein” is defined as containing all of the 10 essential amino acids (EAA). As shown in the table below, each of the 7 grains contains all of the 10 essential amino acids. Oats contain the greatest amount of essential amino acids (Total EAA), followed by corn and quinoa.

Table 2 Grains

3. Which grain contains the highest amount of branched chain amino acids (leucine, isoleucine and valine)?

The branched chain amino acids (BCAA) leucine, isoleucine and valine are well documented to stimulate muscle protein synthesis (Blomstrand et al. 2006). Oats, corn and millet contain the highest amounts of total BCAA, followed by quinoa, brown rice, potato and barley.

Table 3 Grains

4. Which grain is highest in arginine?

Arginine is the required precursor for the production of nitric oxide (NO), which has been claimed to promote vasodilation in active muscle during exercise, thereby improving strength, power and recovery (Alvares et al. 2011). As shown in the table below, once again, oats contain the highest amount of arginine, followed by quinoa and brown rice.

Table 4 Grains

Conclusions:

1) Oats contain the highest amount of total protein, relative to the other grains on this list.

2) All of the 7 grains on this list contain milligram amount of all of the 10 essential amino acids, making each of them a complete protein. Oats contain the highest total amount of essential amino acids, relative to the other grains on this list.

3) Oats also contain the highest amount of branched chain amino acids and arginine, when compared with all the other grains on this list.

If you’re interested, please have a look at my book!

References:

Álvares TS, Meirelles CM, Bhambhani YN, Paschoalin VM, Gomes PS. L-Arginine as a potential ergogenic aid in healthy subjects. Sports Med. 2011 Mar 1;41(3):233-48.

Blomstrand E, Eliasson J, Karlsson HK,Köhnke R. Branched-chain amino acids activate key enzymes in protein synthesis after physical exercise. J Nutr. 2006 Jan;136(1 Suppl):269S-73S.

Nutritional data provided by http://www.nal.usda.gov/fnic/foodcomp/search/

Grapes vs. Raisins: A Nutritional Analysis

If your goal is optimal nutrition, would you choose grapes or raisins? To most, the obvious answer would be grapes, because they’re less calorie dense than raisins. Grapes contain 20 calories per ounce, whereas raisins contain 85 calories/ounce. But, what if I asked the same question, and you had 100 calories to spend on either grapes or raisins? Although they’re the same fruit-raisins are dehydrated grapes-is there a difference in nutrition, when normalized to calories?

Before delving into the nutritional comparison it is important to briefly discuss what happens during the dehydration process. The grape obtains energy through photosynthesis occurring in the green stem. Once the grape is removed from its stem, it still has an energy requirement that needs to be met. Since the stem is no longer providing this energy, the grape begins to use its own chemical processes to maintain energy demand. At the core of the difference between the raisin and the grape is that once the grape leaves the stem, it starts to break down its own energy stores (ATP) to maintain the cellular energy demand, a process that consumes water.

Are there nutritional differences between the grapes and raisins?

grapes raisins

In the table we see that when normalized to 100 calories, there isn’t a difference in protein, fat or carbohydrate, when comparing grapes and raisins.

grapes raisins2

Among the minerals, Copper content is reduced by more than 40% in raisins when compared with grapes. Copper is a cofactor for the antioxidant enzyme, Copper-Zinc Superoxide Dismutase. That its content reduced in raisins indicates a diminished antioxidant response.

grapes raisins3

Antioxidant depletion in raisins is also evident when looking at the vitamin list. Vitamin C (95% reduced), β-Carotene (100%), Vitamin A (100%), Leutein + Zeaxanthin (100%), Vitamin E: α-Tocopherol (86%), and Vitamin E: γ-Tocopherol (90%) are all dramatically reduced in raisins, when compared with grapes. That raisins are depleted in antioxidants, when compared with grapes is confirmed by looking at their respective ORAC (Oxygen Radical Absorbance Capacity) values: 261 for grapes vs. 113 for raisins.

The B-vitamins riboflavin (59%), pantothenate (56%), and Vitamin B6 (54%), each of which are required for efficient energy metabolism are reduced in raisins.

Finally, both Vitamin K (94%) and choline (neurotransmitter, 54%) are also reduced in raisins, when compared with grapes.

So, if your interest is optimal nutrition, eat grapes, not raisins!

If you’re interested, please have a look at my book! 


References

Reference values for raisins and grapes obtained from http://www.nal.usda.gov/fnic/foodcomp/search/

ORAC values for raisins and grapes obtained from w ww.ars.usda.gov/SP2UserFiles/Place/…/Data/ORAC/ORAC_R2.pdf

Raw Vegan vs. Vegan: Which Diet is Best for Optimal for Health?

In a previous article I wrote about how vegans have been shown to have decreased risk of heart disease, cancer, and all-cause mortality. In addition, in 3 separate articles I’ve written about how cooking food at high temperature (above boiling, 212ºF), whether it is roasting, baking, frying or grilling produces molecules that have been shown to shorten lifespan (AGE products), and, that cause cancer in rodents (both acrylamide and furan). Collectively these data indicate that a vegan diet without cooking any of the food at high temperature is optimal for health. However, within the confines of a vegan diet, which is best for health, raw, or raw plus boiled? In this article, I will discuss why a purely raw food diet is not optimal for health.

In short, the reason is because of fructose. Fructose isn’t only found in HFCS, it’s also the main sugar found in fruit. Raw food diets consist of nuts, seeds, fruit and vegetables. However, on a 80-10-10 diet, in which nuts are rarely used, almost all of the calories will come from fruit. For example, bananas contain 27% fructose (http://ndb.nal.usda.gov/ndb/foods/list). In other words, if you eat nothing but bananas in a single day, this would be equivalent to a 27% fructose diet. And, on the fructose scale, bananas are relatively low in fructose. For example, strawberries, cherries, blueberries, oranges, peaches, pears, grapes, watermelon and apples contain 34%, 35%, 35%, 36%, 40%, 46%, 48%, 53%, 53% fructose, respectively. If you ate nothing but watermelon all day you would be on a 46% fructose diet. So, are there any adverse health effects of this amount of dietary fructose?

The answer is yes: both high and low fructose diets have been shown to elevate blood levels of triglycerides, which are a well documented risk factor for cardiovascular disease (Austin et al. 1998). On a 20% fructose diet for 5 weeks, triglycerides (20%), LDL (12%) and total cholesterol (10%) each increased (Reiser et al. 1989). In contrast, although triglycerides were not found to elevated after 4 weeks of a 20% fructose diet (compared with 3% fructose in the controls) in a separate study, both LDL and total cholesterol were significantly elevated (Swanson et. al  1992). However, evidence from 2 additional studies in humans clearly show the positive association between increased fructose intake and elevated triglycerides. Le et. al (2006) found that fructose supplemented at 1.5g/kg body weight for only 1 month was sufficient to raise blood levels of triglycerides by 36% and VLDL-triglycerides by 72%. The amount of fructose supplemented is the Le study is equivalent to 75g and 105g fructose for a 50kg and 70 kg woman and man, respectively, and can easily be obtained by eating 11-15 bananas. In addition, Faeh et. al (2005) showed that fructose supplemented at 3 grams/kg body weight increased triglycerides by 79%. This amount of supplemented fructose is equivalent to eating 22-30 bananas. In addition, these are relatively low-fructose containing diets.

In contrast, rats fed a 67% fructose diet (the control diet contained only starch) more than doubled plasma triglycerides, increased the concentration of triglycerides in liver, increased liver size, and, decreased liver copper content. The importance of copper depletion is illustrated by its role as a cofactor in the enzyme Copper-Zinc superoxide dismutase (CuZnSOD), the first line of defense against superoxide radicals located in the cytosol of all cells. Depletion of liver copper would be expected to reduce CuZnSOD activity, thereby increasing liver oxidative stress. Indeed, the concentration of lipid peroxidation products was shown to be higher in plasma, heart and urine in rats fed the high fructose diet (Busserolles et al. 2003). The good news is that an all fruit diet would never reach the 67% fructose diet found in the Busserolle study, but evidence from relatively low fructose diets (20%) still show elevations in triglycerides.

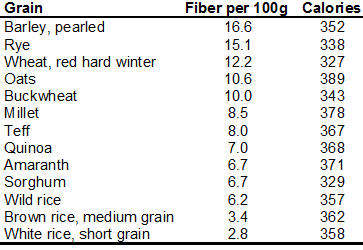
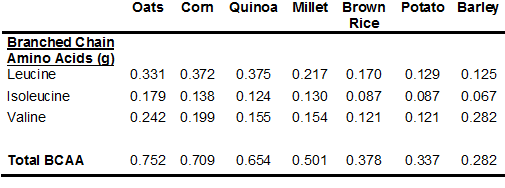
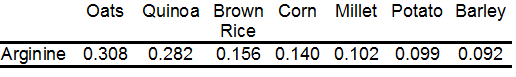
If on a raw food diet the answer is to not to eat only fruit, what should be substituted? As mentioned earlier, there is no risk of forming AGE products, acrylamide or furan when boiling food. Therefore, substitution of some amount of fruit on a raw food diet, perhaps one third to half of the total calories should come from whole grains. Boiled whole grains (with vegetables, for the added flavor) is a great way to keep your total fructose intake relatively low. To ensure no loss of nutrients during the boiling process, don’t dump the soup, drink it, it’s delicious! The tocotrienols found almost exclusively in whole grains have been shown to reduce cholesterol (Zaiden et. al 2010), to reduce inflammation (Wu et al. 2008), to reduce DNA damage (Chin et al. 2008), to reduce cancer progression (Wada et al. 2005), and are neuroprotective (Khana et al. 2003). Therefore, when substituting fruit for whole grains, you won’t be sacrificing nutrition!

From a personal experience, in 2011 I switched from a Mediterranean diet to almost exclusively raw vegan. However, my triglycerides, which have never been higher than 60 mg/dL jumped from 40 mg/dL in 2011 to 90 in 2012! Nothing else changed in my routine-the supplements that I take, or how often I exercise, my body weight/composition was the same-only my diet changed. Based on this, it seems like raw plus boiled may be the path to optimal health!

If you’re interested, please have a look at my book!

References:
Austin MA, Holkanson JE, Edwards KL. Hypertriglyceridemia as a cardiovascular risk factor. Am J Cardiol 1998;81:7B-12B.

Busserolles J, Gueux E, Rock E, Demigné C, Mazur A, Rayssiguier Y. Oligofructose protects against the hypertriglyceridemic and pro-oxidative effects of a high fructose diet in rats.
J Nutr. 2003 Jun;133(6):1903-8.

Chin SF, Hamid NA, Latiff AA, Zakaria Z, Mazlan M, Yusof YA, Karim AA, Ibahim J, Hamid Z, Ngah WZ. Reduction of DNA damage in older healthy adults by Tri E Tocotrienol supplementation. Nutrition. 2008 Jan;24(1):1-10.

Faeh D, Minehira K, Schwarz J, Periasami R, Seongus P, Tappy L. Effect of fructose overfeeding and fish oil administration on hepatic de novo lipogenesis and insulin sensitivity in healthy males. Diabetes 2005;54: 1907-13.

Khanna S, Roy S, Ryu H, Bahadduri P, Swaan PW, Ratan RR, Sen CK. Molecular basis of vitamin E action: tocotrienol modulates 12-lipoxygenase, a key mediator of glutamate-induced neurodegeneration J Biol Chem. 2003 Oct 31;278(44):43508-15.

Lê KA, Faeh D, Stettler R, Ith M, Kreis R, Vermathen P, Boesch C, Ravussin E, Tappy L. A 4-wk high-fructose diet alters lipid metabolism without affecting insulin sensitivity or ectopic lipids in healthy humans. Am J Clin Nutr. 2006 Dec;84(6):1374-9.

Fructose data in foods provided by http://ndb.nal.usda.gov/ndb/foods/list

Reiser S, Powell AS, Scholfield DJ, Panda P, Ellwood KC, Canary JJ. Blood lipids, lipoproteins, apoproteins, and uric acid in men fed diets containing fructose or high-amylose cornstarch. Am J Clin Nutr. 1989 May;49(5):832-9.

Swanson JE, Laine DC, Thomas W, Bantle JP. Metabolic effects of dietary fructose in healthy subjects. Am J Clin Nutr. 1992 Apr;55(4):851-6.

Wada S, Satomi Y, Murakoshi M, Noguchi N, Yoshikawa T, Nishino H. Tumor suppressive effects of tocotrienol in vivo and in vitro. Cancer Lett. 2005;229:181-91.

Wu SJ, Liu PL, Ng LT. Tocotrienol-rich fraction of palm oil exhibits anti-inflammatory property by suppressing the expression of inflammatory mediators in human monocytic cells. Mol Nutr Food Res. 2008 Aug;52(8):921-9.

Zaiden N, Yap WN, Ong S, Xu CH, Teo VH, Chang CP, Zhang XW, Nesaretnam K, Shiba S, Yap YL. Gamma delta tocotrienols reduce hepatic triglyceride synthesis and VLDL secretion. J Atheroscler Thromb. 2010 Oct 27;17(10):1019-32.

Sesame Seeds are a Great Source of Calcium (with Recipe!)

Dietary calcium is easily obtained from dairy, green leafy vegetables (i.e. kale) or, nuts/seeds (chia, amonds). What about other sources?

Do you know that unhulled sesame seeds are a great source of calcium? One ounce of sesame seeds has 270 mg calcium…But, sesame seeds are important for other reasons, too. Supplementation of sesamin, as extracted from sesame seeds has been shown to increase lifespan (Zuo et al. 2013). In humans, dietary sesamin has been shown to reduce blood pressure (Miyawaki et al. 2009) and, LDL and total cholesterol (Hirata et al. 1996). So, sesame seeds appear to be a functional food for those interested in optimal health!

Here’s my recipe for a delicious tahini salad!

Mike’s Tahini Salad

Salad:

16 oz romaine lettuce

12 oz cherry tomatoes

9 oz purple cabbage

3 oz sweet yellow corn

3 oz pickles


Tahini:

1 oz sesame seeds

3 garlic cloves

1-2 medium sized jalapenos

Half a lemon

1 teaspoon, cumin

Put all ingredients for the Tahini in the blender. Add ~5 ounces water, or more, based on your desired consistency.

Mix all the vegetables and Tahini together…Eat and enjoy!

11 2013 081

If you’re interested, please have a look at my book!

References:

Calcium in Sesame seeds determined via http://ndb.nal.usda.gov

Hirata F, Fujita K, Ishikura Y, Hosoda K, Ishikawa T, Nakamura H. Hypocholesterolemic effect of sesame lignan in humans. Atherosclerosis.1996;122(1):135–36.

Miyawaki T, Aono H, Toyoda-Ono Y, Maeda H, Kiso Y, Moriyama K. Antihypertensive effects of sesamin in humans. Journal of Nutritional Science & Vitaminology. 2009;55(1):87–91.

Zuo Y, Peng C, Liang Y, Ma KY, Chan HY, Huang Y, Chen ZY. Sesamin extends the mean lifespan of fruit flies. Biogerontology. 2013 Apr;14(2):107-19.

Broccoli vs Protein Bars

Do you eat protein bars and think that they’re a great protein source? Sure, they are. But is there a healthier way to get that protein into your diet?

In Table 1 I compared the macronutrient composition and, dietary fiber, sodium and potassium content of 2 popular protein bars, Met-Rx and Pure Protein with broccoli. That’s right, I said broccoli.

Met-Rx Pure Protein Broccoli
Size 1 Bar (85g) 1 Bar (78g) 2 lbs (900g)
Calories 310 300 306
Protein 32g 31g 25g
Fiber 2g 3g 23g
Sodium 200 mg 190mg 300mg
Potassium 160 mg 65mg 2840mg

One 3 oz. bar contains approximately 300 calories. In contrast, to get the same amount of calories, you can eat ~11x more food, 32 oz. (2 pounds) of broccoli!. One can make the counterargument that it’s difficult to eat 2 lbs. of broccoli. It’s not, and I eat a 2 pound broccoli meal 1-2x/week. What’s easier to do is eat a protein bar, not be full, and overeat! It’s much harder to overeat, in contrast, eating that much broccoli.

Next, eating that broccoli meal yields 8-11x more dietary fiber, for the same amount of calories. Dietary fiber feeds your gut bacteria, which may be involved in mechanisms underlying lifespan. Separately, broccoli’s potassium/sodum ratio is ~9.5, in comparison with less than 1 for both protein bars. An elevated potassium/sodium ratio is associated with reduced blood pressure (Zhang et al. 2013), which is a known risk factor for stroke and heart disease (Lawes et al. 2008).

Sure, it’s 2 lbs of broccoli, but are you really full after a 5-bite protein bar?

If you’re interested, please have a look at my book!

References:
Broccoli nutrition info from http://ndb.nal.usda.gov/ndb/foods/show/2920?

Lawes CM, Vander Hoorn S, Ronders A; International Society of Hypertension (2008) Global burden of blood-pressure-related disease, 2001. Lancet 371: 1513- 1518.

Zhang Z, Cogswell ME, Gillespie C, Fang J, Loustalot F, Dai S, Carriquiry AL, Kuklina EV, Hong Y, Merritt R, Yang Q. Association between usual sodium and potassium intake and blood pressure and hypertension among U.S. adults: NHANES 2005-2010. PLoS One. 2013 Oct 10;8(10).