If you’re interested, please have a look at my book!
Video of my presentation starts at 14:28, and lasts until 1:29:00+!
If you’re interested, please have a look at my book!
In a previous article I wrote about the effect of epicatechin on reducing myostatin, which may increase muscle mass (https://atomic-temporary-71218033.wpcomstaging.com/2015/02/02/inhibit-myostatin-with-chocolate-increase-muscle-mass/). Are there any other ways to inhibit myostatin with the goal of increasing muscle mass?
10 grams of essential amino acids have been shown to reduce myostatin levels in skeletal muscle (Drummond et al. 2009). Because essential amino acids are found in high amounts in animal protein-containing foods, the answer to decrease myostatin would be to eat more protein, right?
Not so fast, because high protein diets (~20% of total calories), especially from animal sources are associated with an increased all-cause mortality risk in people younger than 65 years when compared with those eating a low protein diet (~10% of total calories; Levine et al. 2014). Fortunately, it isn’t just a bolus of essential amino acids that inhibits myostatin. Addition of the essential amino acid leucine to muscle cells inhibits myostatin expression, causing them to grow (Chen et al. 2013). If your goal is to maximize muscle mass but also, optimal health, what daily intake of leucine should you aim for while keeping your total protein intake low?
It has been reported that a leucine intake of 45 mg/kg/day (or more) may be required by athletes to maximize muscle protein synthesis (Mero 1999). For a 70 kg person, this translates into 3.15g of leucine per day (45 mg*70kg=3150mg, = 3.15g). Shown below is my 7-day average (5/21/2015-5/28/2015) protein intake. From the chart, my average daily leucine intake is 3.2 g. However, the nutrient tracking software that I use for some reason includes the total protein amount from my daily can of sardines but not its constituent amino acids. I used ndb.nal.usda.gov to get that info: 1 can of sardines has 1.6 g of leucine. In total, my daily leucine intake is 4.8 g/day. My body weight is currently at 69.1 kgs. These values put me at 70 mg leucine/kg body weight/day (70 * 69.1kg = 4837 mg, = 4.8 g), which is well above the 45 mg/kg/day value above.
So which foods are rich in leucine? Below I’ve ranked foods based on their leucine content (in grams) divided by total calories. Egg whites and cod fish are the all-stars for leucine content per calorie. Chicken and beef are relatively good sources of leucine. Although spinach is better than skim milk when comparing its leucine/calorie content, none of the vegetables or beans come close to the leucine/calorie content found in egg whites or cod fish.
If you’re interested, please have a look at my book!
References:
Chen X, Huang Z, Chen D, Yang T, Liu G.MicroRNA-27a is induced by leucine and contributes to leucine-induced proliferation promotion in C2C12 cells. Int J Mol Sci. 2013 Jul 8;14(7):14076-84.
Drummond MJ, Glynn EL, Fry CS, Dhanani S, Volpi E, Rasmussen BB. Essential amino acids increase microRNA-499, -208b, and -23a and downregulate myostatin and myocyte enhancer factor 2C mRNA expression in human skeletal muscle. J Nutr. 2009 Dec;139(12):2279-84.
Levine ME, Suarez JA, Brandhorst S, Balasubramanian P, Cheng CW, Madia F, Fontana L, Mirisola MG, Guevara-Aguirre J, Wan J, Passarino G, Kennedy BK, Wei M, Cohen P, Crimmins EM, Longo VD. Low protein intake is associated with a major reduction in IGF-1, cancer, and overall mortality in the 65 and younger but not older population. Cell Metab. 2014 Mar 4;19(3):407-17.
Mero A. Leucine supplementation and intensive training. Sports Med. 1999 Jun;27(6):347-58
Listed below are total protein, essential amino acids, branched chain amino acids, and arginine content for quinoa, oats, corn, millet, barley, brown rice and potato. The values provided are for 100 calories, for each respective grain.
Let’s ask some questions:
1. Is there a difference in protein content among these 7 grains?
Yes, there is a difference. Per 100 calories, oats are king, containing more than 2x the amount of protein in barley, the lowest ranking grain on this list. In fact, oats, quinoa and corn each have approximately 2x more total protein than each of the lowest ranking grains, potato, brown rice and barley. Millet is intermediate, at 2.95 grams of protein per 100 calories.
2. Can these grains be considered as “complete protein”?
A “complete protein” is defined as containing all of the 10 essential amino acids (EAA). As shown in the table below, each of the 7 grains contains all of the 10 essential amino acids. Oats contain the greatest amount of essential amino acids (Total EAA), followed by corn and quinoa.
3. Which grain contains the highest amount of branched chain amino acids (leucine, isoleucine and valine)?
The branched chain amino acids (BCAA) leucine, isoleucine and valine are well documented to stimulate muscle protein synthesis (Blomstrand et al. 2006). Oats, corn and millet contain the highest amounts of total BCAA, followed by quinoa, brown rice, potato and barley.
4. Which grain is highest in arginine?
Arginine is the required precursor for the production of nitric oxide (NO), which has been claimed to promote vasodilation in active muscle during exercise, thereby improving strength, power and recovery (Alvares et al. 2011). As shown in the table below, once again, oats contain the highest amount of arginine, followed by quinoa and brown rice.
Conclusions:
1) Oats contain the highest amount of total protein, relative to the other grains on this list.
2) All of the 7 grains on this list contain milligram amount of all of the 10 essential amino acids, making each of them a complete protein. Oats contain the highest total amount of essential amino acids, relative to the other grains on this list.
3) Oats also contain the highest amount of branched chain amino acids and arginine, when compared with all the other grains on this list.
If you’re interested, please have a look at my book!
References:
Álvares TS, Meirelles CM, Bhambhani YN, Paschoalin VM, Gomes PS. L-Arginine as a potential ergogenic aid in healthy subjects. Sports Med. 2011 Mar 1;41(3):233-48.
Blomstrand E, Eliasson J, Karlsson HK,Köhnke R. Branched-chain amino acids activate key enzymes in protein synthesis after physical exercise. J Nutr. 2006 Jan;136(1 Suppl):269S-73S.
Nutritional data provided by http://www.nal.usda.gov/fnic/foodcomp/search/
Calorie restriction is well documented as the gold standard in terms of minimizing disease risk and maximizing longevity in almost every organism tested-worms, flies, mice, rats, dogs and monkeys. However, eating 10-30% less calories than usual is a difficult task for most people, as evidenced by the continuous rise in global obesity. But, there may be a way to reap the benefits of a calorie restricted diet without actually eating less calories, one that involves eating less methionine.
Methionine is one of the 20 essential amino acids, meaning that the human body cannot synthesize it, and therefore, it must be supplied by the diet. As shown below, a 5.5-fold restriction in dietary methionine (0.17% of total calories compared with 0.86%) without any other dietary changes (in rats) has been shown to increase average lifespan by ~20%, and maximal lifespan by 12% (Orentreich et al. 1993). Translated into human lifespan, a 20% increase would equate to an average lifespan from 75 to 90 years and a maximal lifespan from 122 to 134 years!
More importantly, food intake when normalized to body weight was greater in methionine-restricted animals, evidence that indicates that the lifespan extending effect was not due to a reduction in calories.
In other words, the methionine-restricted rats ate more than rats on the normal diet, but, these calories were not deposited as fat (or muscle), but burned as heat. This concept, of an increase in heat production (as opposed to energy production) is known as uncoupling, and has also been shown to be associated with an increased lifespan (Speakman et al. 2004). Furthermore, dietary methionine restriction has been shown to increase uncoupling (Hasek et al. 2010), and may be playing a part in the observed extended lifespan shown by Orentreich et al. (1993).
So how can we incorporate methionine restriction into our every day diet? The easy answer would be to reduce overall protein intake. For example, a diet that included a 4-egg white omelet for breakfast, a tuna sandwich for lunch, and a relatively lean (85-15, protein-fat) burger for dinner would contain a total of ~75 grams of protein and ~2.1 grams of methionine (based on the methionine content list as reported by McCarty et al. 2009) . Replacing these protein (and methionine) rich sources with an equivalent amount of calories (80 calories, egg whites; 170 calories, tuna; 250 calories beef) with whole wheat pasta (500 calories, or any other grain) reduces the overall protein intake to 24 grams, with ~300 mg (0.3 grams) of methionine. As you can see, elimination of egg/fish/meat reduces the methionine content by 7-fold, and, may be feasible in humans as a means for increasing lifespan.
My 7-day average protein intake is shown below. Within that, my average methionine intake is 0.8g/day. However, it is important to note that the nutrient-tracking software that I use (cronometer.com) for some reason doesn’t have the amino acid breakdown for my daily can of sardines, which adds 0.6 g of methionine. In total, I consume on average, 0.8 g + 0.6 g = 1.4 daily grams of methionine. Each gram of protein contains 4 calories. Therefore, my daily methionine intake =1.4*4 = 5.6 calories. My average calorie intake during that 7-day period was 2241 calories. 5.6/2241 *100 = 0.25%, which puts me closer to the 0.17% long-lived diet than to the shorter-lived 0.86% of Orentreich et al. 1993.
If you’re interested, please have a look at my book!
References:
Hasek BE, Stewart LK, Henagan TM, Boudreau A, Lenard NR, Black C, Shin J, Huypens P, Malloy VL, Plaisance EP, Krajcik RA, Orentreich N, Gettys TW. Dietary methionine restriction enhances metabolic flexibility and increases uncoupled respiration in both fed and fasted states. Am J Physiol Regul Integr Comp Physiol. 2010 Sep;299(3):R728-39.
McCarty MF, Barroso-Aranda J, Contreras F. The low-methionine content of vegan diets may make methionine restriction feasible as a life extension strategy. Med Hypotheses. 2009 Feb;72(2):125-8.
Orentreich N, Matias JR, DeFelice A, Zimmerman JA. Low methionine ingestion by rats extends life span. J Nutr. 1993 Feb;123(2):269-74.
How much protein is optimal for health? In this article I’ll explain how to use a simple blood test to answer that question.
Blood urea nitrogen (BUN) is a blood test that you can get at a yearly checkup. It measures the amount of nitrogen, as contained in urea, in your blood. Independent of poor kidney function (where BUN levels are elevated because of an inability to excrete it), urea production is almost perfectly correlated (r = 0.98) to dietary protein intake (Young et al. 2000):
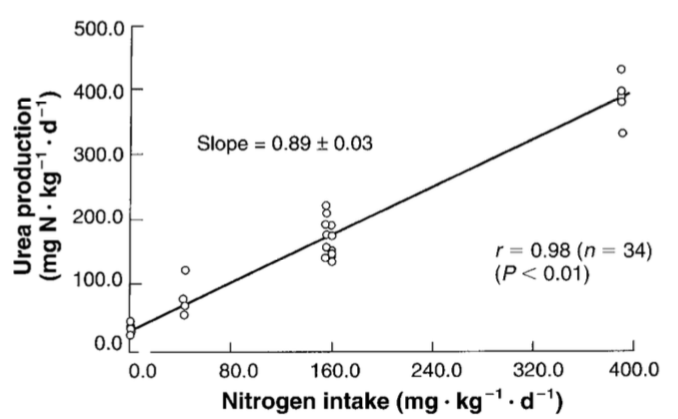
The main source of dietary nitrogen is protein, so if you eat a lot of protein, you’ll make a lot of urea. Circulating levels of urea can be easily calculated by measuring BUN, via:
Urea [mg/dL]= BUN [mg/dL] * 2.14). Therefore, measuring BUN can then be used to determine if your protein intake is too high or too low.
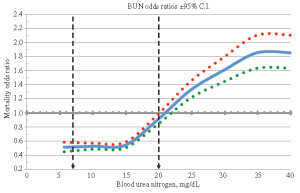
How much should BUN levels be, with the goal of optimizing health? The reference range for BUN is 5-20 mg/dL. Are BUN values of 5 equal to 20 in terms of mortality risk? What’s optimal? As shown below, BUN levels less than 15 mg/dL are associated with maximally reduced risk of death from all causes. As BUN increases above 15 mg/dL, mortality risk increases. For example, a person with a BUN of 20 would have ~50% higher mortality risk than someone with a value of 15 mg/dL:
Why would elevated circulating urea be associated with reduced health? Urea (42 mg/dL, light grey bars; 72 mg/dL, dark grey bars below) can diffuse into the gastrointestinal tract, where it’s involved in decreasing expression of the tight junction proteins, zonulin-1 (ZO-1), occludin, and claudin-1 (Vaziri et al. 2013):
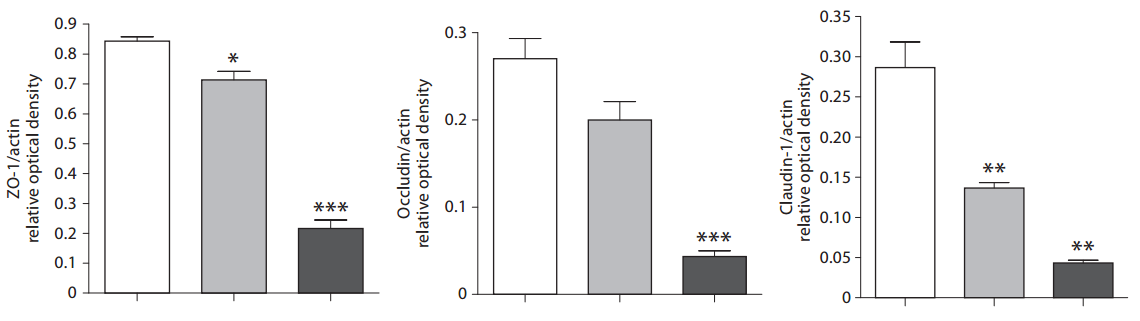
Decreased levels of ZO-1, occludin, and claudin-1 would be expected to increase gut leakiness, the process where bacteria and/or their metabolic products (i.e. lipopolysaccharide; LPS) move from the intestine into the blood. In support of this, tight junction protein expression decreases during aging (Tran and Greenwood-Van Meerveld, 2013) in parallel with increased circulating LPS (Ghosh et al. 2015). Elevated circulating LPS increases oxidative stress, inflammation, and insulin resistance (for more details see: https://www.amazon.com/dp/B01G48A88A), three major theories of aging!
It’s important to mention that the data of Vaziri et al. (2013) showed decreased tight junction protein expression at urea concentrations of 42 and 72 mg/dL. How does that translate into BUN values? Urea concentrations of 42 and 72 mg/dL correspond to BUN values of 19.6 and 33.6 mg/dL, respectively (42/2.14, 72/2.14). Interestingly, from the all-cause mortality data, a BUN value of 20 is associated with increased risk, compared with values less than 15, and this suggests that the effect of urea on gut leakiness may be one reason why!
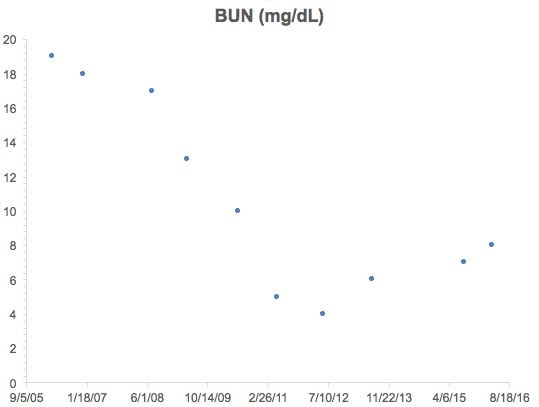
What’s my BUN? As shown below, I’ve measured BUN 10 times since 2006. At that time (and before), my diet was protein heavy, consuming 150+ grams of protein per day. This is reflected in my relatively high (greater than 15) BUN values until 2008, which is when I started to reduce my protein intake. In 2012, I tried a fruititarian diet for 1 year-the corresponding low protein intake (~40g protein/day) resulted in my lowest BUN value of 4. In 2013, I tried a vegan diet rich in whole grains for 1 year (~60g protein/day), and that small increase in protein compared with the fruititarian diet increased my BUN to 6. Since then, I’ve settled on a vegetable dominant, pesco-vegetarian dietary pattern that yields an average of ~85 grams of protein per day. Using that approach, my BUN is 8, well under the 15 threshold.
If you’re interested, please have a look at my book!
References
Ghosh S, Lertwattanarak R, Garduño Jde J, Galeana JJ, Li J, Zamarripa F, Lancaster JL, Mohan S, Hussey S, Musi N. Elevated muscle TLR4 expression and metabolic endotoxemia in human aging. J Gerontol A Biol Sci Med Sci. 2015 Feb;70(2):232-46.
Lustgarten M. Infectious Burden: The Cause Of Aging And Age-Related Disease. 2016. https://www.amazon.com/dp/B01G48A88A
Solinger AB, Rothman SI. Risks of mortality associated with common laboratory tests: a novel, simple and meaningful way to set decision limits from data available in the Electronic Medical Record. Clin Chem Lab Med. 2013 Sep;51(9):1803-13.
Tran L, Greenwood-Van Meerveld B. Age-associated remodeling of the intestinal epithelial barrier. J Gerontol A Biol Sci Med Sci. 2013 Sep;68(9):1045-56.
Vaziri ND, Yuan J, Norris K. Role of urea in intestinal barrier dysfunction and disruption of epithelial tight junction in chronic kidney disease. Am J Nephrol. 2013;37(1):1-6.
Young VR, El-Khoury AE, Raguso CA, Forslund AH, Hambraeus L. Rates of urea production and hydrolysis and leucine oxidation change linearly over widely varying protein intakes in healthy adults. J Nutr. 2000 Apr;130(4):761-6.
Do you eat protein bars and think that they’re a great protein source? Sure, they are. But is there a healthier way to get that protein into your diet?
In Table 1 I compared the macronutrient composition and, dietary fiber, sodium and potassium content of 2 popular protein bars, Met-Rx and Pure Protein with broccoli. That’s right, I said broccoli.
Met-Rx | Pure Protein | Broccoli | |
Size | 1 Bar (85g) | 1 Bar (78g) | 2 lbs (900g) |
Calories | 310 | 300 | 306 |
Protein | 32g | 31g | 25g |
Fiber | 2g | 3g | 23g |
Sodium | 200 mg | 190mg | 300mg |
Potassium | 160 mg | 65mg | 2840mg |
One 3 oz. bar contains approximately 300 calories. In contrast, to get the same amount of calories, you can eat ~11x more food, 32 oz. (2 pounds) of broccoli!. One can make the counterargument that it’s difficult to eat 2 lbs. of broccoli. It’s not, and I eat a 2 pound broccoli meal 1-2x/week. What’s easier to do is eat a protein bar, not be full, and overeat! It’s much harder to overeat, in contrast, eating that much broccoli.
Next, eating that broccoli meal yields 8-11x more dietary fiber, for the same amount of calories. Dietary fiber feeds your gut bacteria, which may be involved in mechanisms underlying lifespan. Separately, broccoli’s potassium/sodum ratio is ~9.5, in comparison with less than 1 for both protein bars. An elevated potassium/sodium ratio is associated with reduced blood pressure (Zhang et al. 2013), which is a known risk factor for stroke and heart disease (Lawes et al. 2008).
Sure, it’s 2 lbs of broccoli, but are you really full after a 5-bite protein bar?
If you’re interested, please have a look at my book!
References:
Broccoli nutrition info from http://ndb.nal.usda.gov/ndb/foods/show/2920?
Lawes CM, Vander Hoorn S, Ronders A; International Society of Hypertension (2008) Global burden of blood-pressure-related disease, 2001. Lancet 371: 1513- 1518.
Zhang Z, Cogswell ME, Gillespie C, Fang J, Loustalot F, Dai S, Carriquiry AL, Kuklina EV, Hong Y, Merritt R, Yang Q. Association between usual sodium and potassium intake and blood pressure and hypertension among U.S. adults: NHANES 2005-2010. PLoS One. 2013 Oct 10;8(10).