Tag Archives: blood urea nitrogen

Optimizing Biological Age With Aging.ai: Blood Urea Nitrogen

Blood urea nitrogen (BUN) is one of the 19 variables found on the biological age calculator, aging.ai. It measures the amount of nitrogen, as contained in urea (i.e., blood urea nitrogen, BUN) in your blood. The reference range for BUN is 5 – 20 mg/dL, but within that range, what’s optimal?

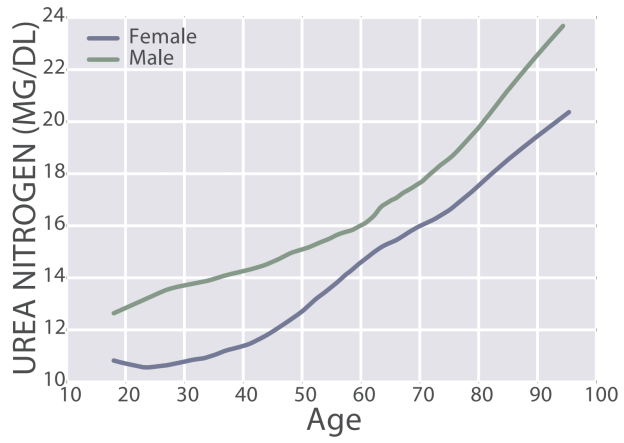
First, BUN increases during aging, from 11 – 13 mg/dL in 20 yr olds to 20 – 22 mg/dL in 90 yr olds (Wang et al. 2017):

Screen Shot 2019-11-21 at 5.55.45 AM

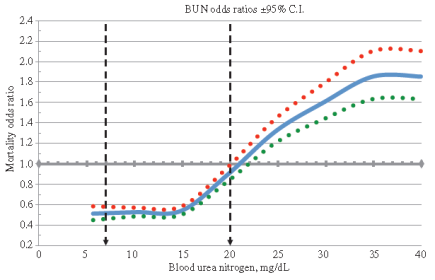
The importance of the age-related increase in BUN is illustrated by the finding that risk of death for all causes increases above 15 mg/dL:

BUN

Also note that maximally decreased risk for all cause mortality was associated with BUN values between 5 – 15 mg/dL. In addition, even though a BUN value = 20 mg/dL is technically within the reference range, risk of death for all causes would be 50% higher when compared with someone that had BUN levels between 5 – 15 mg/dL. Collectively, based on the aging and all-cause mortality data, I’d argue that 5 – 13 mg/dL may be the optimal range for BUN.

Assuming normal kidney function (see https://michaellustgarten.wordpress.com/2019/11/18/optimizing-biologic-age-creatinine/), if your BUN is higher than 15 mg/dL, can it be reduced? Note that urea production is almost perfectly correlated (r = 0.98) with dietary protein intake (Young et al. 2000):
urea nitrog

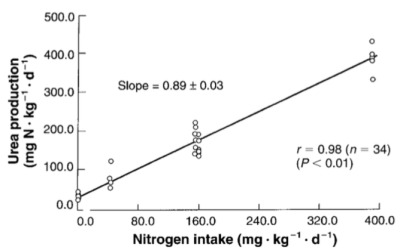
In other words, the main source of dietary nitrogen is protein, so if you eat a lot of protein, you’ll make a lot of urea. Circulating levels of urea can be easily calculated by measuring BUN, via: Urea [mg/dL]= BUN [mg/dL] * 2.14). Therefore, measuring BUN can then be used to determine if your protein intake is too high or too low.

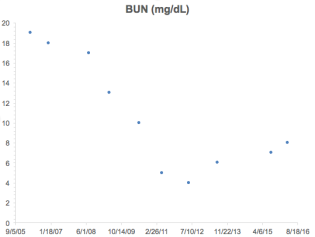
What’s my BUN? As shown below, I’ve measured BUN 22 times since 2015. In line with the Young et al. (2000) data that showed an almost perfectly linear correlation between dietary nitrogen intake with urea production, similarly, as my dietary protein intake has increased, so have my BUN levels. The correlation between my dietary protein intake with BUN is strong (= 0.76, R^2 = 0.575, p-value = 4.3E-05):

upd bun

Note that my BUN is (purposefully) below 15 mg/dL, the upper limit for reduced all-cause mortality risk in Solinger and Rothman (2013), and within the 11 – 13 mg/dL range reported for the 20 yr olds of Wang et al. (2017).

For more recent tracked data, see the video! 

References

Solinger AB, Rothman SI. Risks of mortality associated with common laboratory tests: a novel, simple and meaningful way to set decision limits from data available in the Electronic Medical Record. Clin Chem Lab Med. 2013 Sep;51(9):1803-13.

Wang Z, Li L, Glicksberg BS, Israel A, Dudley JT, Ma’ayan A. Predicting age by mining electronic medical records with deep learning characterizes differences between chronological and physiological ageJ Biomed Inform. 2017 Dec;76:59-68. doi: 10.1016/j.jbi.2017.11.003.

Young VR, El-Khoury AE, Raguso CA, Forslund AH, Hambraeus L. Rates of urea production and hydrolysis and leucine oxidation change linearly over widely varying protein intakes in healthy adults. J Nutr. 2000 Apr;130(4):761-6.

If you’re interested, please have a look at my book!

Advertisement

Blood Urea Nitrogen: A Simple Blood Test For Determining Optimal Protein Intake

How much protein is optimal for health? In this article I’ll explain how to use a simple blood test to answer that question.

Blood urea nitrogen (BUN) is a blood test that you can get at a yearly checkup. It measures the amount of nitrogen, as contained in urea, in your blood. Independent of poor kidney function (where BUN levels are elevated because of an inability to excrete it), urea production is almost perfectly correlated (r = 0.98) to dietary protein intake (Young et al. 2000):
urea nitrog

The main source of dietary nitrogen is protein, so if you eat a lot of protein, you’ll make a lot of urea. Circulating levels of urea can be easily calculated by measuring BUN, via:
Urea [mg/dL]= BUN [mg/dL] * 2.14). Therefore, measuring BUN can then be used to determine if your protein intake is too high or too low.

How much should BUN levels be, with the goal of optimizing health? The reference range for BUN is 5-20 mg/dL. Are BUN values of 5 equal to 20 in terms of mortality risk? What’s optimal? As shown below, BUN levels less than 15 mg/dL are associated with maximally reduced risk of death from all causes. As BUN increases above 15 mg/dL, mortality risk increases. For example, a person with a BUN of 20 would have ~50% higher mortality risk than someone with a value of 15 mg/dL:

BUN

Why would elevated circulating urea be associated with reduced health? Urea (42 mg/dL, light grey bars; 72 mg/dL, dark grey bars below) can diffuse into the gastrointestinal tract, where it’s involved in decreasing expression of the tight junction proteins, zonulin-1 (ZO-1), occludin, and claudin-1 (Vaziri et al. 2013):

urea tj proteins

Decreased levels of ZO-1, occludin, and claudin-1 would be expected to increase gut leakiness, the process where bacteria and/or their metabolic products (i.e. lipopolysaccharide; LPS) move from the intestine into the blood. In support of this, tight junction protein expression decreases during aging (Tran and Greenwood-Van Meerveld, 2013) in parallel with increased circulating LPS (Ghosh et al. 2015). Elevated circulating LPS increases oxidative stress, inflammation, and insulin resistance (for more details see: https://www.amazon.com/dp/B01G48A88A), three major theories of aging!

It’s important to mention that the data of Vaziri et al. (2013) showed decreased tight junction protein expression at urea concentrations of 42 and 72 mg/dL. How does that translate into BUN values? Urea concentrations of 42 and 72 mg/dL correspond to BUN values of 19.6 and 33.6 mg/dL, respectively (42/2.14, 72/2.14). Interestingly, from the all-cause mortality data, a BUN value of 20 is associated with increased risk, compared with values less than 15, and this suggests that the effect of urea on gut leakiness may be one reason why!

What’s my BUN? As shown below, I’ve measured BUN 10 times since 2006. At that time (and before), my diet was protein heavy, consuming 150+ grams of protein per day. This is reflected in my relatively high (greater than 15) BUN values until 2008, which is when I started to reduce my protein intake. In 2012, I tried a fruititarian diet for 1 year-the corresponding low protein intake (~40g protein/day) resulted in my lowest BUN value of 4. In 2013, I tried a vegan diet rich in whole grains for 1 year (~60g protein/day), and that small increase in protein compared with the fruititarian diet increased my BUN to 6. Since then, I’ve settled on a vegetable dominant, pesco-vegetarian dietary pattern that yields an average of ~85 grams of protein per day. Using that approach, my BUN is 8, well under the 15 threshold.

BUN

If you’re interested, please have a look at my book!

References

Ghosh S, Lertwattanarak R, Garduño Jde J, Galeana JJ, Li J, Zamarripa F, Lancaster JL, Mohan S, Hussey S, Musi N. Elevated muscle TLR4 expression and metabolic endotoxemia in human aging. J Gerontol A Biol Sci Med Sci. 2015 Feb;70(2):232-46.

Lustgarten M. Infectious Burden: The Cause Of Aging And Age-Related Disease. 2016. https://www.amazon.com/dp/B01G48A88A

Solinger AB, Rothman SI. Risks of mortality associated with common laboratory tests: a novel, simple and meaningful way to set decision limits from data available in the Electronic Medical Record. Clin Chem Lab Med. 2013 Sep;51(9):1803-13.

Tran L, Greenwood-Van Meerveld B. Age-associated remodeling of the intestinal epithelial barrier. J Gerontol A Biol Sci Med Sci. 2013 Sep;68(9):1045-56.

Vaziri ND, Yuan J, Norris K. Role of urea in intestinal barrier dysfunction and disruption of epithelial tight junction in chronic kidney disease. Am J Nephrol. 2013;37(1):1-6.

Young VR, El-Khoury AE, Raguso CA, Forslund AH, Hambraeus L. Rates of urea production and hydrolysis and leucine oxidation change linearly over widely varying protein intakes in healthy adults. J Nutr. 2000 Apr;130(4):761-6.