Tag Archives: Heart Rate Variability

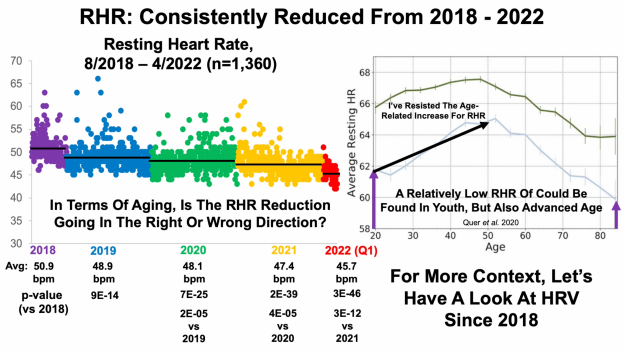
Resting Heart Rate And Heart Rate Variability: What’s Optimal, 1,502 Days of Data

Join us on Patreon!
https://www.patreon.com/MichaelLustgartenPhD

Quantify Discount Link (At-Home Blood Testing)
https://getquantify.io/mlustgarten

TruDiagnostic Discount Link (Epigenetic Testing)
CONQUERAGING!

https://bit.ly/3Rken0n

Bristle Discount Link (Oral microbiome quantification):
ConquerAging15
https://www.bmq30trk.com/4FL3LK/GTSC3/

Cronometer Discount Link (Daily diet tracking):
https://shareasale.com/r.cfm?b=1390137&u=3266601&m=61121&urllink=&afftrack=

Support the channel with Buy Me A Coffee!
https://www.buymeacoffee.com/mlhnrca


Papers referenced in the video:
Biological aging of human body and brain systems
https://www.medrxiv.org/content/10.1101/2022.09.03.22279337v1

Relation of high heart rate variability to healthy longevity
https://pubmed.ncbi.nlm.nih.gov/20381674/

Heart Rate Variability and Exceptional Longevity
https://pubmed.ncbi.nlm.nih.gov/33041862/

Inter- and intraindividual variability in daily resting heart rate and its associations with age, sex, sleep, BMI, and time of year: Retrospective, longitudinal cohort study of 92,457 adults
https://pubmed.ncbi.nlm.nih.gov/32023264/

Heart rate variability with photoplethysmography in 8 million individuals: a cross-sectional study
https://pubmed.ncbi.nlm.nih.gov/33328029/

Advertisement

Resting Heart Rate And Heart Rate Variability: What’s Optimal, 4-Year Progress

Join us on Patreon! https://www.patreon.com/MichaelLustgartenPhD

Papers referenced in the video: Inter- and intraindividual variability in daily resting heart rate and its associations with age, sex, sleep, BMI, and time of year: Retrospective, longitudinal cohort study of 92,457 adults https://pubmed.ncbi.nlm.nih.gov/32023264/

Heart rate variability with photoplethysmography in 8 million individuals: a cross-sectional study https://pubmed.ncbi.nlm.nih.gov/33328029/

Blood Test #2 in 2022: Supplements, Cardiovascular Fitness Metrics (HRV, RHR)

Join us on Patreon! https://www.patreon.com/MichaelLustgartenPhD

Levine’s Biological age calculator is embedded as an Excel file in this link from my website: https://michaellustgarten.com/2019/09/09/quantifying-biological-age/

Papers referenced in the video:
Inter- and intra-individual variability in daily resting heart rate and its associations with age, sex, sleep, BMI, and time of year: Retrospective, longitudinal cohort study of 92,457 adults https://pubmed.ncbi.nlm.nih.gov/32023264/

Heart rate variability with photoplethysmography in 8 million individuals: a cross-sectional study https://pubmed.ncbi.nlm.nih.gov/33328029/

Resting Heart Rate, Heart Rate Variability: 1,240 Days Of Data

Join us on Patreon! https://www.patreon.com/MichaelLustgartenPhD

Paper referenced in the video: Inter- and intraindividual variability in daily resting heart rate and its associations with age, sex, sleep, BMI, and time of year: Retrospective, longitudinal cohort study of 92,457 adults https://pubmed.ncbi.nlm.nih.gov/32023264/

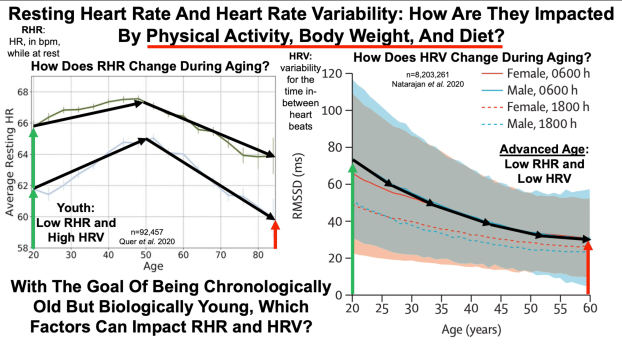
Physical Activity, Body Weight, And Diet Affect Resting Heart Rate And Heart Rate Variability

Join us on Patreon! https://www.patreon.com/MichaelLustgartenPhD

Papers referenced in the video:

Inter- and intraindividual variability in daily resting heart rate and its associations with age, sex, sleep, BMI, and time of year: Retrospective, longitudinal cohort study of 92,457 adults

https://pubmed.ncbi.nlm.nih.gov/32023264/

Heart rate variability with photoplethysmography in 8 million individuals: a cross-sectional study

https://pubmed.ncbi.nlm.nih.gov/33328029/

Is Weight Loss Driving Improvements For Resting Heart Rate And Heart Rate Variability?

Consistent exercise training would seem like the obvious choice to reduce resting heart rate (RHR) and to increase heart rate variability (HRV). Are there other factors that can impact these variables? Body weight and daily calorie intake may affect RHR and HRV, and in the video I present 700+ days of data for these correlations.

Resting Heart Rate And Heart Rate Variability: What’s Optimal?

To determine what’s optimal for resting heart rate and heart rate variability, I review the published literature for how they change during aging, and what’s associated with mortality risk. Also included are my data over the past ~2 years, to see how I compare against the literature.

Resting Heart Rate, Heart Rate Variability: January 2020 Update

How’s my progress on the road to achieving a resting heart rate (RHR) as close to 40 beats per minute (bpm) as possible? Shown below is my RHR data for August 2018-Jan 2019, which corresponds to the 6-month period after I started tracking RHR. When compared with that period, am I still making year-over-year progress?

jan hr

First, note that my Jan 2019 RHR value of 47.4 bpm seems dramatically reduced when compared with Aug-Dec 2018. My computer crashed in Jan 2019, and I lost 4 days of January 2019 RHR data, with remaining data for 27 days. Accordingly, I didn’t expect to be better than that, year-over-year. Nonetheless,  my average RHR for Jan 2020 is 46.9 bpm, which is superficially better, but it isn’t statistically different from Jan 2019 (p = 0.13). However, my RHR is still going in the right direction!

What about my heart rate variability (HRV)? Relative to Jan 2019 (56.6), my HRV in Jan 2020 was significantly higher (76; p=0.003), but note that I didn’t additionally improve my HRV relative to December 2019 (86.3).

hrvjan2

I’ve been consistent with my exercise program, including weekly workouts (3-4x, ~1 hr each session) and walking (15-20 miles), so are there other variables that may explain the sudden increase in HRV from Nov 2019-Jan 2020? During that time, I’ve been cutting my calorie intake by a small amount (~100-200 cals/day) below my body weight maintenance intake, with the goal of getting leaner. As a result, I’ve slowly decreased my body weight from 157 to 154 during that time. Although there is a weak negative correlation between my body weight with HRV (R2=0.0553), this association is statistically significant (p=0.024). So reducing body weight may have played a role in the sudden HRV increase:

hrv bw

For those who may have missed my other post updates for RHR and/or HRV:
Dec 2019 update: https://michaellustgarten.wordpress.com/2020/01/01/resting-heart-rate-heart-rate-variability-december-2019-update/

Oct, Nov 2019 update: https://michaellustgarten.wordpress.com/2019/12/05/resting-heart-rate-heart-rate-variability-still-making-progress/

Sept 2019 update: https://michaellustgarten.wordpress.com/2019/10/08/resting-heart-rate-year-over-year-update/

Also, why a RHR as close to 40 bpm may be optimal: https://michaellustgarten.wordpress.com/2019/02/02/resting-heart-rate-whats-optimal/


If you’re interested, please have a look at my book!


Resting Heart Rate, Heart Rate Variability: December 2019 Update

In earlier posts, I reported year-over-year improvements for my resting heart rate (RHR), from 51.5 (bpm) when I first started tracking in August 2018 to 48 bpm in November 2019 (https://michaellustgarten.wordpress.com/2019/12/05/resting-heart-rate-heart-rate-variability-still-making-progress/). Did my year-over-year RHR improvement continue in December 2019?

As shown below, in December 2018, my average RHR was 49.5 bpm. In December 2019, it was 47.5! These data are significantly different (p=6.5E-05):

rhr dec 2019

While RHR is one metric of cardiovascular health, heart rate variability (HRV) is another. With a stronger heart, the expectation would be a lower RHR, but a higher HRV. December 2019 was my best month ever for HRV, with an average HRV value of 86.3!

hrv 12 2019

Also note that December 2019’s HRV value is significantly different when compared with December 2018 (p=1.6E-11).

How am I able to continuously improve my RHR, and recently, my HRV? I average 15-20 miles of walking per week, and 3-4 days/week of structured exercise (1 hr/session), including a combination of weights, core, and stretching. My average HR during my structured workouts had been ~105 bpm prior to the past few months, but in November and December 2019 I made more of an effort to minimize rest periods, and included higher reps to keep my exercise HR as high as possible. My goal is to get my RHR to 40 bpm, which is associated with maximally reduced risk of death for all causes (https://michaellustgarten.wordpress.com/2019/02/02/resting-heart-rate-whats-optimal/). Stay tuned for more RHR and HRV data next month!

If you’re interested, please have a look at my book!

Resting Heart Rate, Heart Rate Variability: Still Making Progress?

Although many of my posts aimed at improving health and longevity are focused on diet, in this post I’ll show data that demonstrates that I’ve been able to steadily improve my cardiovascualr fitness. In earlier posts I reported that a resting heart rate (RHR) of 40 beats per minute (bpm) was associated with lowest risk for all-cause mortality (https://michaellustgarten.wordpress.com/2019/02/02/resting-heart-rate-whats-optimal/), and I noted my own RHR progress in a year-over-year update, from values of 51.5 – 52.7 bpm in August – Sept 2018 to 49.3 – 48.7 bpm during the same months in 2019 (see https://michaellustgarten.wordpress.com/2019/10/08/resting-heart-rate-year-over-year-update/). Have I continued to make progress?

Shown below are 2 more months of RHR data, from August – November 2018, and the data for those months in 2019:
rhr 4 moFrom August – November 2018, I reduced my RHR from ~52 to 50 bpm, whereas in 2019, I made smaller progress, but the trend is still downward, from 49 to 48 bpm. The 2018 data is significantly different from the 2019 data, as assessed by single-factor ANOVA (p = 8E-14).

Adding strength to these findings is that my heart rate variability (HRV), as a second index of cardiovascular health, has increased during the same period:

hrv2Note that from August – November 2018, my average daily HRV value never topped 48, whereas during the same 4 months in 2019, it was never lower than 52.1, with my best ever HRV values found in November. The 2018 is significantly different when compared with 2019, again based on single-factor ANOVA (p = 5.2E-13).

How am I improving my cardiovascular fitness? That’s a topic for another post, but note that my strength is still pretty good, as evidenced by my 12 pull-ups in the video below!

https://www.youtube.com/watch?v=dLktQvFz70Q

If you’re interested, have a look at my book!