Monthly Archives: July 2014

Methionine restriction extends lifespan

Calorie restriction is well documented as the gold standard in terms of minimizing disease risk and maximizing longevity in almost every organism tested-worms, flies, mice, rats, dogs and monkeys. However, eating 10-30% less calories than usual is a difficult task for most people, as evidenced by the continuous rise in global obesity. But, there may be a way to reap the benefits of a calorie restricted diet without actually eating less calories, one that involves eating less methionine.

Methionine is one of the 20 essential amino acids, meaning that the human body cannot synthesize it, and therefore, it must be supplied by the diet. As shown below, a 5.5-fold restriction in dietary methionine (0.17% of total calories compared with 0.86%) without any other dietary changes (in rats) has been shown to increase average lifespan by ~20%, and maximal lifespan by 12% (Orentreich et al. 1993). Translated into human lifespan, a 20% increase would equate to an average lifespan from 75 to 90 years and a maximal lifespan from 122 to 134 years!

methio

More importantly, food intake when normalized to body weight was greater in methionine-restricted animals, evidence that indicates that the lifespan extending effect was not due to a reduction in calories.

methio food

In other words, the methionine-restricted rats ate more than rats on the normal diet, but, these calories were not deposited as fat (or muscle), but burned as heat. This concept, of an increase in heat production (as opposed to energy production) is known as uncoupling, and has also been shown to be associated with an increased lifespan (Speakman et al. 2004). Furthermore, dietary methionine restriction has been shown to increase uncoupling (Hasek et al. 2010), and may be playing a part in the observed extended lifespan shown by Orentreich et al. (1993).

So how can we incorporate methionine restriction into our every day diet? The easy answer would be to reduce overall protein intake. For example, a diet that included a 4-egg white omelet for breakfast, a tuna sandwich for lunch, and a relatively lean (85-15, protein-fat) burger for dinner would contain a total of ~75 grams of protein and ~2.1 grams of methionine (based on the methionine content list as reported by McCarty et al. 2009) . Replacing these protein (and methionine) rich sources with an equivalent amount of calories (80 calories, egg whites; 170 calories, tuna; 250 calories beef) with whole wheat pasta (500 calories, or any other grain) reduces the overall protein intake to 24 grams, with ~300 mg (0.3 grams) of methionine. As you can see, elimination of egg/fish/meat reduces the methionine content by 7-fold, and, may be feasible in humans as a means for increasing lifespan.

My 7-day average protein intake is shown below. Within that, my average methionine intake is 0.8g/day. However, it is important to note that the nutrient-tracking software that I use (cronometer.com) for some reason doesn’t have the amino acid breakdown for my daily can of sardines, which adds 0.6 g of methionine. In total, I consume on average, 0.8 g + 0.6 g = 1.4 daily grams of methionine. Each gram of protein contains 4 calories. Therefore, my daily methionine intake =1.4*4 = 5.6 calories. My average calorie intake during that 7-day period was 2241 calories. 5.6/2241 *100 = 0.25%, which puts me closer to the 0.17% long-lived diet than to the shorter-lived 0.86% of Orentreich et al. 1993.

methio crono

If you’re interested, please have a look at my book!

References:

Hasek BE, Stewart LK, Henagan TM, Boudreau A, Lenard NR, Black C, Shin J, Huypens P, Malloy VL, Plaisance EP, Krajcik RA, Orentreich N, Gettys TW. Dietary methionine restriction enhances metabolic flexibility and increases uncoupled respiration in both fed and fasted states. Am J Physiol Regul Integr Comp Physiol. 2010 Sep;299(3):R728-39.

McCarty MF, Barroso-Aranda J, Contreras F. The low-methionine content of vegan diets may make methionine restriction feasible as a life extension strategy. Med Hypotheses. 2009 Feb;72(2):125-8.

Orentreich N, Matias JR, DeFelice A, Zimmerman JA. Low methionine ingestion by rats extends life span. J Nutr. 1993 Feb;123(2):269-74.

Be Careful How You Prepare Your Food: Advanced Glycation End Products Shorten Lifespan!

Dietary advanced glycation end products (AGEs) are formed as a result of the heat-induced (greater than 100C) binding of sugar to protein, fat or nucleic acids (DNA or RNA). The common way to identify AGE products in food is the browning effect: deep-frying, broiling, roasting, and grilling each produce a temperature that is sufficient to greatly increase AGE product formation, relative to either raw or boiled food.

The importance of dietary AGE products is that they shorten lifespan! Cai et al. (2007) quantified the amount of one particular type of AGE product, CML (carboxy-methyl-lysine) found in the mouse diet, and then fed mice half of this amount. The low-CML diet was sufficient to significantly extend median and maximal lifespan by 15% and 6%, respectively:

age lifespan

As shown below (inset), no difference in food intake was observed when comparing the 2 groups-from this it can be concluded that the lifespan extending effect of the low-CML diet was not related to a reduction in calorie intake. Also, mice on the low-CML diet had significantly decreased body weight, evidence that shows that it isn’t just calories that we should be worried about in terms of body weight maintenance.

age bw food intake

Dietary AGE products also shorten lifespan on a calorie-restricted diet. Calorie restriction is the gold standard in terms of minimizing disease risk and extending longevity in a variety of organisms, including worms, flies, mice, dogs, and monkeys. Because CR mice eat less food than controls, the possibility existed that CR-fed animals also ate less AGE products. To address this possibility, Cai et al. (2008) quantified the amount of AGE products that CR-fed mice consumed, and then increased this amount to either equal to or greater than what mice on a regular diet ate. In terms of lifespan, mice on a low AGE, low calorie diet had increased average and maximal lifespan, relative to mice on a regular, ad libitum diet. However, lifespan was significantly reduced for CR-fed mice whose food was supplemented an AGE product amount that was equal to the regular diet!

cr age less

These data suggest that if you eat less calories than normal, you will live longer, but, if your lower-calorie diet is poor in quality (i.e. high in AGE products), you will lose the lifespan extending effect of CR.

In support of the hypothesis that AGE products are bad for lifespan, dietary supplementation with glycated albumin (left) and fructosylated albumin (right) also shorten lifespan, in flies (Tsakiri et al. 2013):
fly lifespan glycation

To illustrate how cooking food at a high temperature impacts AGE formation, shown below is the AGE product (CML) content for a variety of foods (Goldberg et al. 2004):
age list
For example, boiling beef (as in a chili recipe), compared with roasting it results in ~3-fold less AGE products. Boiling egg yolks results in about half as much CML when compared with frying. Interestingly, olive oil has more than double the amount of CML, when compared to broiled chicken or beef!  Finally, fruits and vegetables such as bananas, apples, carrots, and green beans have almost negligible amounts of CML.

This post is now in video form!

References:

Cai W, He JC, Zhu L, Chen X, Wallenstein S, Striker GE, Vlassara H. Reduced oxidant stress and extended lifespan in mice exposed to a low glycotoxin diet: association with increased AGER1 expression.Am J Pathol. 2007 Jun;170(6):1893-902.

Cai W, He JC, Zhu L, Chen X, Zheng F, Striker GE, Vlassara H. Oral glycotoxins determine the effects of calorie restriction on oxidant stress, age-related diseases, and lifespan. Am J Pathol. 2008 Aug;173(2):327-36.

Goldberg T, Cai W, Peppa M, Dardaine V, Baliga BS, Uribarri J, Vlassara H. Advanced glycoxidation end products in commonly consumed foods. J Am Diet Assoc. 2004 Aug;104(8):1287-91.

Tsakiri EN, Iliaki KK, Höhn A, Grimm S, Papassideri IS, Grune T, Trougakos IP. Diet-derived advanced glycation end products or lipofuscin disrupts proteostasis and reduces life span in Drosophila melanogaster. Free Radic Biol Med. 2013 Dec;65:1155-63.

If you’re interested, please have a look at my book!

Blood Urea Nitrogen: A Simple Blood Test For Determining Optimal Protein Intake

How much protein is optimal for health? In this article I’ll explain how to use a simple blood test to answer that question.

Blood urea nitrogen (BUN) is a blood test that you can get at a yearly checkup. It measures the amount of nitrogen, as contained in urea, in your blood. Independent of poor kidney function (where BUN levels are elevated because of an inability to excrete it), urea production is almost perfectly correlated (r = 0.98) to dietary protein intake (Young et al. 2000):
urea nitrog

The main source of dietary nitrogen is protein, so if you eat a lot of protein, you’ll make a lot of urea. Circulating levels of urea can be easily calculated by measuring BUN, via:
Urea [mg/dL]= BUN [mg/dL] * 2.14). Therefore, measuring BUN can then be used to determine if your protein intake is too high or too low.

How much should BUN levels be, with the goal of optimizing health? The reference range for BUN is 5-20 mg/dL. Are BUN values of 5 equal to 20 in terms of mortality risk? What’s optimal? As shown below, BUN levels less than 15 mg/dL are associated with maximally reduced risk of death from all causes. As BUN increases above 15 mg/dL, mortality risk increases. For example, a person with a BUN of 20 would have ~50% higher mortality risk than someone with a value of 15 mg/dL:

BUN

Why would elevated circulating urea be associated with reduced health? Urea (42 mg/dL, light grey bars; 72 mg/dL, dark grey bars below) can diffuse into the gastrointestinal tract, where it’s involved in decreasing expression of the tight junction proteins, zonulin-1 (ZO-1), occludin, and claudin-1 (Vaziri et al. 2013):

urea tj proteins

Decreased levels of ZO-1, occludin, and claudin-1 would be expected to increase gut leakiness, the process where bacteria and/or their metabolic products (i.e. lipopolysaccharide; LPS) move from the intestine into the blood. In support of this, tight junction protein expression decreases during aging (Tran and Greenwood-Van Meerveld, 2013) in parallel with increased circulating LPS (Ghosh et al. 2015). Elevated circulating LPS increases oxidative stress, inflammation, and insulin resistance (for more details see: https://www.amazon.com/dp/B01G48A88A), three major theories of aging!

It’s important to mention that the data of Vaziri et al. (2013) showed decreased tight junction protein expression at urea concentrations of 42 and 72 mg/dL. How does that translate into BUN values? Urea concentrations of 42 and 72 mg/dL correspond to BUN values of 19.6 and 33.6 mg/dL, respectively (42/2.14, 72/2.14). Interestingly, from the all-cause mortality data, a BUN value of 20 is associated with increased risk, compared with values less than 15, and this suggests that the effect of urea on gut leakiness may be one reason why!

What’s my BUN? As shown below, I’ve measured BUN 10 times since 2006. At that time (and before), my diet was protein heavy, consuming 150+ grams of protein per day. This is reflected in my relatively high (greater than 15) BUN values until 2008, which is when I started to reduce my protein intake. In 2012, I tried a fruititarian diet for 1 year-the corresponding low protein intake (~40g protein/day) resulted in my lowest BUN value of 4. In 2013, I tried a vegan diet rich in whole grains for 1 year (~60g protein/day), and that small increase in protein compared with the fruititarian diet increased my BUN to 6. Since then, I’ve settled on a vegetable dominant, pesco-vegetarian dietary pattern that yields an average of ~85 grams of protein per day. Using that approach, my BUN is 8, well under the 15 threshold.

BUN

If you’re interested, please have a look at my book!

References

Ghosh S, Lertwattanarak R, Garduño Jde J, Galeana JJ, Li J, Zamarripa F, Lancaster JL, Mohan S, Hussey S, Musi N. Elevated muscle TLR4 expression and metabolic endotoxemia in human aging. J Gerontol A Biol Sci Med Sci. 2015 Feb;70(2):232-46.

Lustgarten M. Infectious Burden: The Cause Of Aging And Age-Related Disease. 2016. https://www.amazon.com/dp/B01G48A88A

Solinger AB, Rothman SI. Risks of mortality associated with common laboratory tests: a novel, simple and meaningful way to set decision limits from data available in the Electronic Medical Record. Clin Chem Lab Med. 2013 Sep;51(9):1803-13.

Tran L, Greenwood-Van Meerveld B. Age-associated remodeling of the intestinal epithelial barrier. J Gerontol A Biol Sci Med Sci. 2013 Sep;68(9):1045-56.

Vaziri ND, Yuan J, Norris K. Role of urea in intestinal barrier dysfunction and disruption of epithelial tight junction in chronic kidney disease. Am J Nephrol. 2013;37(1):1-6.

Young VR, El-Khoury AE, Raguso CA, Forslund AH, Hambraeus L. Rates of urea production and hydrolysis and leucine oxidation change linearly over widely varying protein intakes in healthy adults. J Nutr. 2000 Apr;130(4):761-6.

Dental Floss, Cancer And Mortality: Is There An Association?

Usually, my focus on optimal health involves proper diet and exercise. But, are there other factors that can reduce mortality risk? More specifically, does how often I brush my teeth or floss have an impact on cancer and all-cause mortality?

Tooth brushing at night before bed and using dental floss every day were found to be significant risk factors for reducing mortality risk in 5611 older adults (median age 81, Paganini-Hill et al. 2011). Tooth brushing at night was found to be the most important time for reducing mortality risk, compared with the morning and during the day, as those who never brushed at night had a 20–35% (men and women, respectively) increased mortality risk. In addition, not brushing your teeth at all was associated with a 41–91% (men and women, respectively) increased mortality risk compared with those who brushed three times daily.

What about flossing? Never flossing increased mortality risk by 30%, compared with those who flossed everyday. And, to illustrate the importance of both tooth brushing and flossing at night, people who brushed their teeth at night every day but never flossed had an increased mortality risk of ~25% , when compared with those who flossed everyday.

One possible explanation for the decreased mortality risk found in those who floss daily is a reduced risk of cancer. For example, those who never floss were found to have ~3-fold more gastric precancerous lesions, when compared with controls (Salazar et al. 2012).

So, if you’re interested in optimal health and lifespan, flossing and tooth brushing every day, especially at night seems to be a must!

If you’re interested, please have a look at my book!

References

Paganini-Hill A, White SC, Atchison KA. Dental Health Behaviors, Dentition, and Mortality in the Elderly: The Leisure World Cohort Study. J Aging Res. 2011;2011:156061.

Salazar CR, Francois F, Li Y, Corby P, Hays R, Leung C, Bedi S, Segers S, Queiroz E, Sun J, Wang B, Ho H, Craig R, Cruz GD, Blaser MJ, Perez-Perez G, Hayes RB, Dasanayake A, Pei Z, Chen Y. Association between oral health and gastric precancerous lesions. Carcinogenesis. 2012 Feb;33(2):399-403.

Dietary Acrylamide and Cancer Risk in Human Studies: What’s the data?

In an earlier article I wrote about how cooking foods at a high temperature (greater than 250ºF, including frying, baking, roasting and grilling) produces the neurotoxic and carcinogenic compound, acrylamide (http://voices.yahoo.com/acrylamide-chocolate-another-10217911.html?cat=5). However, the adverse effects acrylamide that I discussed were solely based on rodent studies. In this follow-up article, I’ll comprehensively discuss the evidence relating dietary acrylamide with human cancer.

Before introducing the data, it’s important to note that dietary acrylamide intake in all of the studies discussed below were calculated based on food frequency questionnaires. The highest acrylamide consuming group was approximately 40 µg/day, in comparison with low consumers of dietary acrylamide, ~10 µg /day. Without a doubt these values for dietary acrylamide intake are underestimated-for example, 1 ounce of Pringles potato chips contains 70 µg of acrylamide, and the commonly thought of as “healthier chips”, Baked Lays has 31µg/ounce (1 bag of chips).

Breast Cancer

Six large epidemiological studies (ranging from 33,000-120,000 subjects) and 1 smaller study (1500-6000 subjects) investigated the association between dietary acrylamide and breast cancer risk. Of these, 1 study, the UK Women’s Cohort Study identified a 20% significantly increased risk between acrylamide intake and premenopausal breast cancer (Burley et al. 2011). The other six studies did not show an association between acrylamide intake and breast cancer risk (Pellucchi et al. 2006, Hogervorst et al. 2007, Pedersen et al. 2009, Larsson et al. 2009, Wilson et al. 2009, Wilson et al. 2010).

Endometrial Cancer

Three large epidemiological studies have investigated the association between dietary acrylamide and endometrial cancer. In two of these studies, risk of cancer was increased by 41% and 99%, respectively (Wilson et al. 2010, Hogervorst et al. 2007). No association between dietary acrylamide intake and risk of endometrial cancer was found in the Swedish Mammography Study (Larsson et al. 2009).

Ovarian Cancer

No association between dietary acrylamide and risk of ovarian cancer was found in the small- scale Italian Cohort study, or, in 2 large-scale epidemiological studies (Pellucchi et al. 2006, Larsson et al. 2009, Wilson et al. 2010). However, a 122% increased risk for ovarian cancer in non-smokers was found in the Netherlands Cohort Study on Diet and Cancer (Hogervorst et al. 2007).

Prostate, Pancreatic, Brain Cancer

Five separate studies found no association between dietary acrylamide and risk of prostate cancer (Pellucchi et al. 2006, Hogervorst et al. 2008, Wilson et al. 2009, Larsson et al. 2009, Wilson et al. 2012). Similarly, pancreatic cancer risk is not increased (Pelucchi et al. 2011, Hogervorst et al. 2008), nor is brain cancer (Hogervorst et al. 2009), or, thyroid cancer (Schouten et al. 2009).

Esophageal cancer

One small study (987 subjects) found a 23% increased risk for esophageal cancer, and an 88% increased risk in those with a BMI greater than 25. In two other studies (Pellucchi et al. 2006, Hogervorst et al. 2008), no association between dietary acrylamide and esophageal cancer was found.

Head-neck cancer

Increased risk for oral-cavity cancer in female non-smokers in a large study (121,000 subjects; Schouten et al. 2009) was found. No association for oral cavity, pharynx or larynx cancer in a smaller study (1500-6000 subjects; Pellucchi et al. 2006)

Kidney Cancer

Although risk of kidney cancer was significantly increased by 59%, it appears as if this data was skewed by smokers. In non-smokers, risk of kidney cancer was not significant (Pellucchi et al. 2006). No association between dietary acrylamide and risk of kidney cancer was also identified in three additional studies (Mucci et al. 2003, Mucci  et al. 2004, Pellucchi et al. 2007).

Gastric, Colon, Rectal cancer

A small study with 1129 subjects found a 40% decreased risk of large bowel cancer (Mucci  et al. 2003). Four studies have not found a similar association (Pellucchi et al. 2006, Mucci et al. 2006, Hogervorst et al. 2008, Larsson et al. 2009).

Lung Cancer

A 55% decreased risk of lung cancer, in women was identified by Hogervorst et al. (2009).

Bladder cancer

Significant only in smokers, as 15+ cigarettes/day significantly increased risk of bladder cancer in those with the highest dietary acrylamide intake, relative to the lowest intake (Hogervorst et al. 2008).

Blood cancer

Multiple myeloma and follicular myeloma were found to be significantly increased by 14% and 28% for every 10 µg increment in dietary acrylamide (Bongers et al. 2012).

Conclusions

The easy interpretation of scientific studies is that if six studies show no effect and one study shows a positive effect, that the no effect-data is the real answer. For example, in the case of breast cancer, six studies showed no effect, whereas one study showed a significant association between acrylamide and premenopausal breast cancer. Should we conclude that there is no risk for breast cancer? As I mentioned earlier, it is likely that total dietary acrylamide intake was underestimated, and therefore, it is my opinion that none of the 25 studies should have shown an association between acrylamide and cancer. Therefore, that there was indeed a significant association for breast cancer with potentially underestimated acrylamide values is significant. Also, dietary acrylamide was shown to be significantly associated with myeloma, head-neck cancer, esophageal cancer, endometrial cancer and ovarian cancer. Paradoxically, dietary acrylamide reduced risk of lung and large bowel cancer.

What should someone who is interested in optimal health do with this information? Knowing that dietary acrylamide is indeed significantly associated with increased risk of human cancers, I would reduce or eliminate cooking food at a high temperature. I have!

If you’re interested, please have a look at my book!

References:

Bongers ML, Hogervorst JG, Schouten LJ, Goldbohm RA, Schouten HC, van den Brandt PA. Dietary acrylamide intake and the risk of lymphatic malignancies: the Netherlands Cohort Study on diet and cancer. PLoS One. 2012;7(6):e38016.

Burley VJ, Greenwood DC, Hepworth SJ, Fraser LK, de Kok TM, van Breda SG, Kyrtopoulos SA, Botsivali M, Kleinjans J, McKinney PA, Cade JE. Dietary acrylamide intake and risk of breast cancer in the UK women’s cohort. Br J Cancer. 2010 Nov 23;103(11):1749-54.

Hogervorst JG, Schouten LJ, Konings EJ, Goldbohm RA, van den Brandt PA. A prospective study of dietary acrylamide intake and the risk of endometrial, ovarian, and breast cancer. Cancer Epidemiol Biomarkers Prev. 2007 Nov;16(11):2304-13.

Hogervorst JG, Schouten LJ, Konings EJ, Goldbohm RA, van den Brandt PA. Dietary acrylamide intake and the risk of renal cell, bladder, and prostate cancer. Am J Clin Nutr. 2008 May;87(5):1428-38

Hogervorst JG, Schouten LJ, Konings EJ, Goldbohm RA, van den Brandt PA. Dietary acrylamide intake is not associated with gastrointestinal cancer risk. J Nutr. 2008 Nov;138(11):2229-36.

Hogervorst JG, Schouten LJ, Konings EJ, Goldbohm RA, van den Brandt PA. Lung cancer risk in relation to dietary acrylamide intake. J Natl Cancer Inst. 2009 May 6;101(9):651-62.

Hogervorst JG, Schouten LJ, Konings EJ, Goldbohm RA, van den Brandt PA. Dietary acrylamide intake and brain cancer risk. Cancer Epidemiol Biomarkers Prev. 2009 May;18(5):1663-6.

Larsson SC, Akesson A, Wolk A. Long-term dietary acrylamide intake and breast cancer risk in a prospective cohort of Swedish women. Am J Epidemiol. 2009 Feb 1;169(3):376-81.

Larsson SC, Håkansson N, Akesson A, Wolk A. Long-term dietary acrylamide intake and risk of endometrial cancer in a prospective cohort of Swedish women. Int J Cancer. 2009 Mar 1;124(5):1196-9.

Larsson SC, Akesson A, Bergkvist L, Wolk A. Dietary acrylamide intake and risk of colorectal cancer in a prospective cohort of men. Eur J Cancer. 2009 Mar;45(4):513-6.

Larsson SC, Akesson A, Wolk A. Long-term dietary acrylamide intake and risk of epithelial ovarian cancer in a prospective cohort of Swedish women. Cancer Epidemiol Biomarkers Prev. 2009 Mar;18(3):994-7.

Larsson SC, Akesson A, Wolk A. Dietary acrylamide intake and prostate cancer risk in a prospective cohort of Swedish men. Cancer Epidemiol Biomarkers Prev. 2009 Jun;18(6):1939-41.

Lin Y, Lagergren J, Lu Y. Dietary acrylamide intake and risk of esophageal cancer in a population-based case-control study in Sweden. Int J Cancer. 2011 Feb 1;128(3):676-81.

Mucci LA, Dickman PW, Steineck G, Adami HO, Augustsson K. Dietary acrylamide and cancer of the large bowel, kidney, and bladder: absence of an association in a population-based study in Sweden. Br J Cancer. 2003 Jan 13;88(1):84-9.

Mucci LA, Lindblad P, Steineck G, Adami HO. Dietary acrylamide and risk of renal cell cancer. Int J Cancer. 2004 May 1;109(5):774-6.

Mucci LA, Adami HO, Wolk A. Prospective study of dietary acrylamide and risk of colorectal cancer among women. Int J Cancer. 2006 Jan 1;118(1):169-73.

Pedersen GS, Hogervorst JG, Schouten LJ, Konings EJ, Goldbohm RA, van den Brandt PA. Dietary acrylamide intake and estrogen and progesterone receptor-defined postmenopausal breast cancer risk. Breast Cancer Res Treat. 2010 Jul;122(1):199-210.

Pelucchi C, Galeone C, Levi F, Negri E, Franceschi S, Talamini R, Bosetti C, Giacosa A, La Vecchia C. Dietary acrylamide and human cancer. Int J Cancer. 2006 Jan 15;118(2):467-71.

Pelucchi C, Galeone C, Dal Maso L, Talamini R, Montella M, Ramazzotti V, Negri E, Franceschi S, La Vecchia C. Dietary acrylamide and renal cell cancer. Int J Cancer. 2007 Mar 15;120(6):1376-7.

Pelucchi C, Galeone C, Talamini R, Negri E, Polesel J, Serraino D, La Vecchia C. Dietary acrylamide and pancreatic cancer risk in an Italian case–control study. Ann Oncol. 2011 Aug;22(8):1910-5.

Schouten LJ, Hogervorst JG, Konings EJ, Goldbohm RA, van den Brandt PA. Dietary acrylamide intake and the risk of head-neck and thyroid cancers: results from the Netherlands Cohort Study. Am J Epidemiol. 2009 Oct 1;170(7):873-84.

Wilson KM, Mucci LA, Cho E, Hunter DJ, Chen WY, Willett WC. Dietary acrylamide intake and risk of premenopausal breast cancer. Am J Epidemiol. 2009 Apr 15;169(8):954-61.

Wilson KM, Bälter K, Adami HO, Grönberg H, Vikström AC, Paulsson B, Törnqvist M, Mucci LA. Acrylamide exposure measured by food frequency questionnaire and hemoglobin adduct levels and prostate cancer risk in the Cancer of the Prostate in Sweden Study. Int J Cancer. 2009 May 15;124(10):2384-90.

Wilson KM, Mucci LA, Rosner BA, Willett WC. A prospective study on dietary acrylamide intake and the risk for breast, endometrial, and ovarian cancers. Cancer Epidemiol Biomarkers Prev. 2010 Oct;19(10):2503-15.

Wilson KM, Giovannucci E, Stampfer MJ, Mucci LA. Dietary acrylamide and risk of prostate cancer. Int J Cancer. 2012 Jul 15;131(2):479-87.

Kuna Cocoa: The Optimal Way to Decrease Blood Pressure, and, to Reduce Risk of Heart Disease and Cancer?

The main drawback to optimal health if you eat store-bought chocolate is that cacao beans are roasted, thereby increasing the concentration of the carcinogen, acrylamide (https://atomic-temporary-71218033.wpcomstaging.com/2014/07/27/acrylamide-is-in-chocolate-another-reason-why-cooking-food-at-high-temperature-is-not-good-for-you/). Besides eating homemade chocolate made from raw cacao beans (https://atomic-temporary-71218033.wpcomstaging.com/2014/09/21/homemade-chocolate-in-2-minutes/), are there any health benefits to drinking raw cacao?

The answer is yes, and it comes from the Kuna Indians, who live on a group of islands near Panama. The Kuna have been shown to have a low average blood pressure (BP, 110/70 mm Hg), and, do not experience the age-related increase in blood pressure that is common in Western society (Hollenberg et al. 1997). More importantly, death rates from cardiovascular disease and cancer, the #1 and #2 causes of death in the US were almost completely eliminated in the Kuna. Between 2000 to 2004, on the mainland of Panama, Bayard et al. (2007) reported that for every 100,000 residents, 83 died from cardiovascular disease (CVD), and 68 died from cancer. In contrast, per 100,000 Kuna, these death rates were reduced to 9 for CVD (a 9-fold reduction!) and 4 (a 15-fold reduction!) for cancer, respectively. In other words, cardiovascular disease and cancer are almost non-existent as a cause of death among the Kuna!

One could make the argument that the Kuna have decreased rates of CVD and cancer if it can be shown that their population is younger than on mainland Panama. The incidence of CVD and cancer increase with age, so if the Kuna population was younger than on the mainland, this could possibly explain their reduced death rates. However, the opposite was found to be true: approximately 94% of the residents of Panama are younger than 55 years of age, whereas ~87% of the Kuna are younger than 55. In addition, ~6% of Kuna’s population were found between the age of 55-64; ~4.4% were 65-74, and, ~2.4% were older than 75. In contrast, only 3% of mainland Panamanians were 55-64, ~1.9% were 65-74, and ~1.1% were older than 75 (Bayard et al. 2007). In other words, the percentage of Kuna older than 55 years was more than doubled, relative to mainland Panama! Not only do the Kuna have less CVD and cancer, they live longer than their mainland counterparts.

Before discussing how this is possible, it’s important to mention that the Kuna’s salt intake has been reported to be higher than both mainland Panama and, when compared with a Western diet. The Kuna eat, on average, 5500 mg of salt per day (Hollenberg et. al 1997). In comparison, Kuna who migrate to mainland Panama consume ~3300 mg/day (McCullough et. al 2006), subjects on a Western diet consume ~3700 mg, and, vegans consume ~1400 mg salt/day (Fontana et. al 2007). In other words, the Kuna eat more salt, but yet have lower BP, the absence of an age-related rise in BP, and have reduced risk of disease and mortality, relative to their Westernized-diet counterparts on the mainland of Panama.

Do the Kuna have genes that protect them from elevated blood pressure? If the Kuna were genetically protected, one would anticipate that they could move to an urban environment and maintain low blood pressure. However, Kuna that migrated to mainland Panama approximately 20 years earlier were found to have an increased incidence of both hypertension, and an age-related rise in BP (Hollenberg et. al 1997). This indicates that the Kuna were not protected by genes, and the factor that was keeping their blood pressure down was environmental.

So, how is this possible? There may be clues in the Kuna diet, which is almost exclusively plant and fish based, with almost no dairy, meat or nuts. The Kuna eat more fruit, 5 servings/day, vs. 1 serving/day on the mainland. The Kuna eat approximately 6 oz. fish/day, compared with, 1.5 oz/ day on the mainland (McCullough et. al 2006). Both increased fruit and fish intake may be responsible for the improved health that the Kuna experience, relative to their mainland counterparts.

But, there is another factor which is dramatically different in the Kuna diet when compared to the mainland-the Kuna consume more than 4 cups, or 30-40 ounces of a cocoa drink on a daily basis.  Mainland Panamanians ingest little cocoa, and what they take is commercially available and flavanol-poor (McCullough et. al 2006). In contrast, unlike almost all commercially available chocolate, the cocoa consumed by the Kuna is not roasted. To make their cocoa drink, the Kuna grind raw cacao beans, which is then boiled with banana. After boiling this mixture, it is poured through a strainer, leaving behind the cocoa and banana solids. Because it’s not roasted, Kuna cocoa contains all of the health benefits of the cacao bean, with none of the acrylamide!

It’s important to note that the cocoa ingested by the Kuna is naturally very rich in a specific subclass of flavonoids known as flavanols, including epicatechin, catechin, and flavanol-based oligomers known as procyanidins (Chevaux et. al 2001, Fisher and Hollenberg 2005). Kuna cocoa beans provide 3000 mg/100g flavanols. Kuna cocoa powder provides less (flavanols are lost during the fermentation process), at ~2000 mg/100g cocoa. In contrast, 6 commercially available cocoa powders /cocoa drinks didn’t exceed 150 mg flavanols/100g cocoa (Fisher and Hollenberg 2005). High levels of flavanol have been shown to reduce risk of death from coronary artery disease by as much as 58% (Mukamal et al. 2002).

Since I don’t live with the Kuna off the mainland of Panama, I don’t have access to unfermented cacao beans. However, raw, organic, fermented, non-roasted cacao beans are indeed available online. To make the cocoa drink, I use 1 oz. of cacao beans, 1 medium-large banana and ~35 oz. of water, boiled for 10-15 minutes. Then, I pass this solution through a strainer, and drink it once it cools down. It’s delicious!

If you’re interested in watching an ABC news video on the Kuna and the preparation of this cocoa drink, here is the link:http://abcnews.go.com/Health/video/cocoa-kuna-indians-panama-native-americans-chocolate-production-13402637.

100_1694

If you’re interested, please have a look at my book!

References:

Acrylamide data via: http://www.fda.gov/Food/FoodborneIllnessContaminants/ChemicalContaminants/ucm053549.htm

Bayard V, Chamorro F, Motta J, Hollenberg NK. Does flavanol intake influence mortality from nitric oxide-dependent processes? Ischemic heart disease, stroke, diabetes mellitus, and cancer in Panama. Int J Med Sci. 2007 Jan 27;4(1):53-8.

Chevaux KA, Jackson L, Villar ME, et al. Proximate mineral and procyandin content of certain foods and beverages consumed by Kuna Amerinds of Panama. J Food Composit Anal. 2001;14: 553–563.

Fisher NDL, Hollenberg NKH. Flavanols for cardiovascular health: the science behind the sweetness. J Hypertension. 2005;23: 1453–1459.

Fontana L, Meyer TE, Klein S, Holloszy JO. Long-term low-calorie low-protein vegan diet and endurance exercise are associated with low cardiometabolic risk. Rejuvenation Res. 2007 Jun;10(2):225-34.

Hollenberg NK, Martinez G, McCullough M, et al. Aging, acculturation, salt intake, and hypertension. Hypertension. 1997; 29:171–176.

McCullough ML, Chevaux K, Jackson L, Preston M, Martinez G, Schmitz HH, Coletti C, Campos H, Hollenberg NK. Hypertension, the Kuna, and the epidemiology of flavanols. J Cardiovasc Pharmacol. 2006;47 Suppl 2:S103-9; discussion 119-21.

Mukamal KJ, Maclure M, Muller JE, Sherwood JB, Mittleman MA. Tea consumption and mortality after acute myocardial infarction. Circulation 2002; 105:2476–2481.

http://www.nal.usda.gov/fnic/foodcomp/Data/Flav/Flav02-1.pdf

Sesame Seeds are a Great Source of Calcium (with Recipe!)

Dietary calcium is easily obtained from dairy, green leafy vegetables (i.e. kale) or, nuts/seeds (chia, amonds). What about other sources?

Do you know that unhulled sesame seeds are a great source of calcium? One ounce of sesame seeds has 270 mg calcium…But, sesame seeds are important for other reasons, too. Supplementation of sesamin, as extracted from sesame seeds has been shown to increase lifespan (Zuo et al. 2013). In humans, dietary sesamin has been shown to reduce blood pressure (Miyawaki et al. 2009) and, LDL and total cholesterol (Hirata et al. 1996). So, sesame seeds appear to be a functional food for those interested in optimal health!

Here’s my recipe for a delicious tahini salad!

Mike’s Tahini Salad

Salad:

16 oz romaine lettuce

12 oz cherry tomatoes

9 oz purple cabbage

3 oz sweet yellow corn

3 oz pickles


Tahini:

1 oz sesame seeds

3 garlic cloves

1-2 medium sized jalapenos

Half a lemon

1 teaspoon, cumin

Put all ingredients for the Tahini in the blender. Add ~5 ounces water, or more, based on your desired consistency.

Mix all the vegetables and Tahini together…Eat and enjoy!

11 2013 081

If you’re interested, please have a look at my book!

References:

Calcium in Sesame seeds determined via http://ndb.nal.usda.gov

Hirata F, Fujita K, Ishikura Y, Hosoda K, Ishikawa T, Nakamura H. Hypocholesterolemic effect of sesame lignan in humans. Atherosclerosis.1996;122(1):135–36.

Miyawaki T, Aono H, Toyoda-Ono Y, Maeda H, Kiso Y, Moriyama K. Antihypertensive effects of sesamin in humans. Journal of Nutritional Science & Vitaminology. 2009;55(1):87–91.

Zuo Y, Peng C, Liang Y, Ma KY, Chan HY, Huang Y, Chen ZY. Sesamin extends the mean lifespan of fruit flies. Biogerontology. 2013 Apr;14(2):107-19.

Gut Bacteria and Lifespan-Is there a Connection?

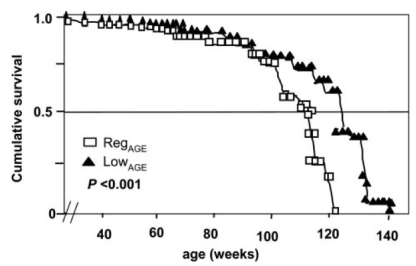
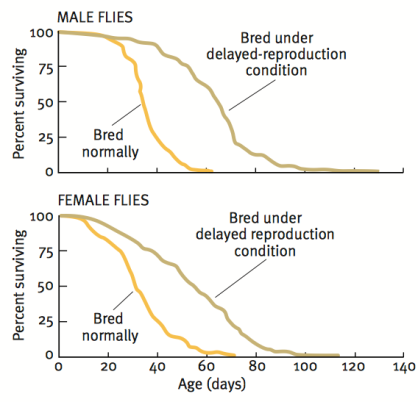
Our story begins with Michael Rose, who used an experimental evolution approach to breed flies that live more than 2-fold longer than controls (Rose 1999). In contrast with the one gene at a time knockout or overexpression strategy that is ubiquitous in modern biology, Rose separated initially genetically homogeneous flies into two groups-one with delayed and the other with normal reproduction. As shown below, after 80 generations, the group with continually delayed reproduction had ~2-fold increased average and maximal lifespan.

rose mort

While this suggests that continually delaying reproduction may extend lifespan in people, the time it would take to do that makes it an unreasonable strategy. In 2010, the average age at first reproduction in the US was 25.4 years (http://www.cdc.gov/nchs/data/nvsr/nvsr61/nvsr61_01.pdf). Therefore, to replicate the doubling of lifespan found in Drosophila, 80 generations * 25.4y would take more than 2000 years! In contrast, a more reasonable approach towards extending life in people may involve stimulation of some of the pathways involved in the extended fly lifespan.

What genetic mechanisms underlie this 2-fold increase in Drosophila lifespan? Kurapati et al. 2000) found that levels of the mitochondrially located heat shock protein 22 (Hsp22) were between two and ten-fold higher in long-lived Drospohila, relative to the shorter-lived controls. In 2004 Morrow et al. identified the causative role of Hsp22 overexpression, as average lifespan increased by ~30%, thereby implicating mechanisms related to upregulation of Hsp22 on increasing lifespan.

Unfortunately, the role of Hsp22 on influencing lifespan in mammals is unknown. But, can we learn something about the underlying mechanism of the Hsp22-induced increase in lifespan and apply that to mammalian aging?

Hsp22 expression is regulated by histone deacetylase (HDAC) inhibitors (Zhou et al. 2005). In other words, when certain HDAC’s are inhibited, histone acetylation increases, resulting in elevated Hsp22 expression. Interestingly, histone acetylation has also been shown to be involved in lifespan determination in yeast and worms (Kaeberlein et al. 1999, Kang et al. 2002, Kim et al. 1999, Tissenbaum and Guarente, 2001). In contrast, the HDAC’s that have been popularized by the resveratrol-sirtuin story results in histone deacetylation, or the removal of acetyl groups from histones.

Identification of compounds that inhibit the HDAC’s that control Hsp22 expression would seem to be a good method for potentially increasing mammalian lifespan. Supplementation with sodium butyrate increases Hsp22 expression in Drosophila (Zhao et al. 2005), resulting in increased Drosophila lifespan (McDonald et al. 2013). Interestingly, sodium butyrate is a class I, II, IV HDAC inhibitor, whereas the sirtuins are class III inhibitors (Witt et al. 2009), evidence that suggests differing roles for the HDACs on lifespan extension.

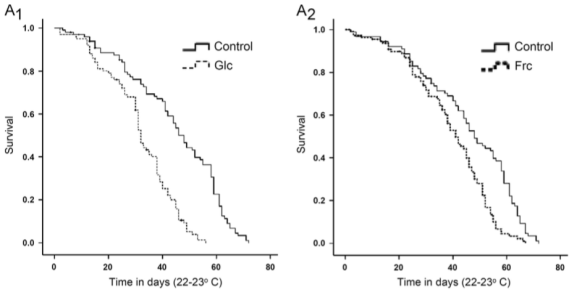
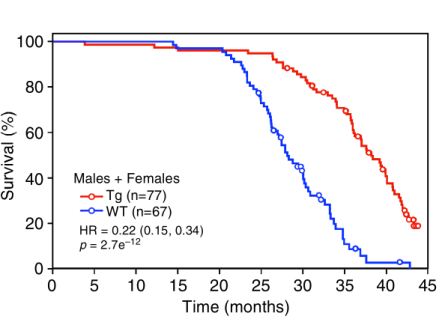
Unfortunately, the causative role of butyrate-producing bacteria on mammalian lifespan has yet to be directly tested. However, butyrate stimulates expression of fibroblast growth factor 21 (Li et al. 2012), a protein whose overexpression extends both average and maximal lifespan in mice (shown below; Zhang et al. 2012).

fgf

Furthermore, acarbose supplementation extends median and maximal lifespan in genetically heterogeneous mice (Harrison et al. 2013), an important finding because acarbose supplementation has been shown to elevate serum butyrate in human subjects (Wolever and Chiasson 2000).

How can we get butyrate into our diet? Although butter contains small amounts of butyrate, a butter-rich diet has been shown to be obesogenic (Hariri et al. 2010). Fortunately, there is another way we can increase levels of butyrate, and that’s by stimulating our intestinal bacteria to produce it! The most abundant butyrate-producing gut bacterial species are Faecalibacterium prausnitziiEubacterium rectaleEubacterium hallii and Anaerostipes hadrus (Tap et al. 2009, Walker et al. 2011).

Interestingly, butyrate-producing bacteria decrease during aging, which, in my opinion makes colonizing our intestines with these beneficial bacteria all the more important. For example, Faecalibacterium prausnitziiEubacterium hallii and Eubacterium rectale are significantly reduced in centenarians when compared with elderly and young subjects (Biagi et al. 2010). Several other gut bacterial butyrate producers are also reduced in centenarians when compared with the other age groups, including Ruminococcus obeumRoseburia intestinalisE. ventriosum, and, Papillibacter cinnamovorans.

Collectively, these data suggest that increasing gut bacterial species that produce butyrate may be important for increasing lifespan in both lower organisms and, in mammals. How can we boost butyrate-producing bacteria? Prebiotics, food ingredients that stimulate the growth and/or activity of bacteria in the digestive system may be the best option. Two such food components are inulin and fructooligosaccharides (FOS), which in vitro, stimulate growth of the butyrate producers F. prausnitzii, E.rectale, E. hallii and R. intestinalis 4-15 fold above basal levels (Scott et al. 2014). In vivo, consumption of 10g/day of inulin for 16 days in healthy, middle aged humans (BMI 25 kg*m-2, avg. age 38) significantly stimulated growth of F. prausnitzii (Ramirez-Farias et al. 2009). Therefore, consumption of foods rich in inulin and FOS may be a valid strategy for boosting levels of butyrate-producing bacteria in our intestines.

Foods containing inulin and fructoligosaccharides are shown in Table 1.

fos inulin

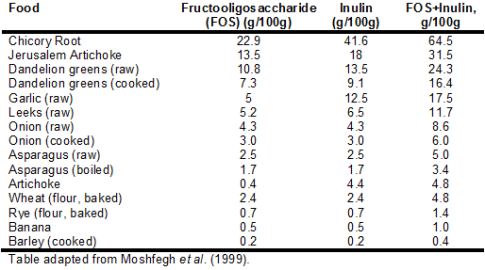
First, it’s important to mention that average intake for inulin and FOS is only ~2.5 grams/day (5g total) (Moshfegh et al. 1999). This is because relatively few foods contain high amounts of these prebiotic fibers. For example, whereas 100g of bananas (equivalent to 1 small banana) contains 1 gram total of combined inulin and FOS, in contrast, chicory root and Jerusalem artichoke contain 64.5 and 31.5 grams, respectively. In addition, although not shown in the table, most fruits contain limited amounts of FOS. Bananas contain more FOS/g than apple, blackberry, blueberry, cantaloupe, grapes, orange, peach, pear, raspberry, rhubarb, strawberry and watermelon (Dumitiriu 2005). This is an important finding because one would expect fruits to be rich in inulin and FOS, as both of these fibers contain long chain fructose polymers. Furthermore, based on values for asparagus, chicory, onion, loss of inulin and FOS upon boiling is ~30%, so eating these foods raw is not the only strategy for increasing dietary amounts of FOS and inulin.

Can increasing consumption of FOS and inulin improve health and lifespan? To date, dietary supplementation with inulin has been shown to improve cognitive performance (Messaoudi et al. 2005), and, to reduce cholesterol, triglycerides and body weight, and, improved survival in rats (Rozan et al. 2008). Although randomized controlled trials examining the effect of increasing butyrate-producing bacteria on health and mortality risk in older adults has yet to be performed, collectively, the evidence presented here suggests that if you’re interested in a low risk, potentially high reward approach towards improving health and lifespan, consuming more foods containing FOS and inulin may be a valid strategy!

If you’re interested, please have a look at my book!


References
Biagi E, Nylund L, Candela M, Ostan R, Bucci L, Pini E, Nikkïla J, Monti D, Satokari R, Franceschi C, Brigidi P, De Vos W. Through ageing, and beyond: gut microbiota and inflammatory status in seniors and centenarians. PLoS One. 2010 May 17;5(5):e10667.

Dumitiriu S. Polysaccharides: Structural Diversity and Functional Versatility. 2005. CRC Press. p854-855.

Hariri N, Gougeon R, Thibault L. A highly saturated fat-rich diet is more obesogenic than diets with lower saturated fat content. Nutr Res. 2010 Sep;30(9):632-43.

Harrison DE, Strong R, Allison DB, Ames BN, Astle CM, Atamna H, Fernandez E, Flurkey K, Javors MA, Nadon NL, Nelson JF, Pletcher S, Simpkins JW, Smith D, Wilkinson JE, Miller RA. Acarbose, 17-α-estradiol, and nordihydroguaiaretic acid extend mouse lifespan preferentially in males. Aging Cell. 2013 Oct 26.

Kaeberlein, M., McVey, M. and Guarente, L. (1999). The SIR2/3/4 complex and SIR2 alone promote longevity in Saccharomyces cerevisiae by two different mechanisms. Genes Dev. 13, 2570-2580.

Kang, H. L., Benzer, S. and Min, K. T. (2002). Life extension in Drosophila by feeding a drug. Genetics 99, 838-843. Kim, S., Benguria, A., Lai, C. and Jazwinski, S. M. (1999). Modulation of lifespan by histone deacetylase genes in Saccharomyces cerevisiae. Mol. Biol. Cell 10, 3125-3156.

Kurapati R, Passananti HB, Rose MR, Tower J. Increased hsp22 RNA levels in Drosophila lines genetically selected for increased longevity. J Gerontol A Biol Sci Med Sci. 2000 Nov;55(11):B552-9.

Li H, Gao Z, Zhang J, Ye X, Xu A, Ye J, Jia W. Sodium butyrate stimulates expression of fibroblast growth factor 21 in liver by inhibition of histone deacetylase 3. Diabetes. 2012 Apr;61(4):797-806.

McDonald P, Maizi BM, Arking R. Chemical regulation of mid- and late-life longevities in Drosophila. Exp Gerontol. 2013 Feb;48(2):240-9.

Messaoudi M, Rozan P, Nejdi A, Hidalgo S, Desor D. Behavioural and cognitive effects of oligofructose-enriched inulin in rats. Br J Nutr. 2005 Apr;93 Suppl 1:S27-30.

Moshfegh AJ, Friday JE, Goldman JP, Ahuja JK. Presence of inulin and oligofructose in the diets of Americans. J Nutr. 1999 Jul;129(7 Suppl):1407S-11S.

Morrow G, Samson M, Michaud S, Tanguay RM. Overexpression of the small mitochondrial Hsp22 extends Drosophila life span and increases resistance to oxidative stress. FASEB J. 2004 Mar;18(3):598-9.

Ramirez-Farias C, Slezak K, Fuller Z, Duncan A, Holtrop G & Louis P (2009) Effect of inulin on the human gut microbiota: stimulation of Bifidobacterium adolescentis and Faecalibacterium prausnitzii. Brit J Nutr 101: 533-542.

Rose MR. Can human aging be postponed? Sci Am. 1999 Dec;281(6):106-11.

Rozan P, Nejdi A, Hidalgo S, Bisson JF, Desor D, Messaoudi M. Effects of lifelong intervention with an oligofructose-enriched inulin in rats on general health and lifespan. Br J Nutr. 2008 Dec;100(6):1192-9.

Scott KP, Martin JC, Duncan SH, Flint HJ. Prebiotic stimulation of human colonic butyrate-producing bacteria and bifidobacteria, in vitro. FEMS Microbiol Ecol. 2014 Jan;87(1):30-40.

Tap J, Mondot S, Levenez F et al. (2009) Towards the human intestinal microbiota phylogenetic core. Environ Microbiol 11: 2574-2584.

Tissenbaum, H. A. and Guarente, L. (2001). Increased dosage of a sir2 gene extends lifespan in Caenorhabditis elegans. Nature 410, 227-230

Walker AW, Ince J, Duncan SH et al. (2011) Dominant and diet-responsive groups of bacteria within the human colonic microbiota. ISME J 5: 220-230.

Wolever TM, Chiasson JL. Acarbose raises serum butyrate in human subjects with impaired glucose tolerance. Br J Nutr. 2000 Jul;84(1):57-61.

Witt O, Deubzer HE, Milde T, Oehme I. HDAC family: What are the cancer relevant targets? Cancer Lett. 2009 May 8;277(1):8-21.

Zhang Y, Xie Y, Berglund ED, Coate KC, He TT, Katafuchi T, Xiao G, Potthoff MJ, Wei W, Wan Y, Yu RT, Evans RM, Kliewer SA, Mangelsdorf DJ. The starvation hormone, fibroblast growth factor-21, extends lifespan in mice. Elife. 2012;1:e00065.

Zhao Y, Sun H, Lu J, Li X, Chen X, Tao D, Huang W, Huang B. Lifespan extension and elevated hsp gene expression in Drosophila caused by histone deacetylase inhibitors. J Exp Biol. 2005 Feb;208(Pt 4):697-705.

Broccoli vs Protein Bars

Do you eat protein bars and think that they’re a great protein source? Sure, they are. But is there a healthier way to get that protein into your diet?

In Table 1 I compared the macronutrient composition and, dietary fiber, sodium and potassium content of 2 popular protein bars, Met-Rx and Pure Protein with broccoli. That’s right, I said broccoli.

Met-Rx Pure Protein Broccoli
Size 1 Bar (85g) 1 Bar (78g) 2 lbs (900g)
Calories 310 300 306
Protein 32g 31g 25g
Fiber 2g 3g 23g
Sodium 200 mg 190mg 300mg
Potassium 160 mg 65mg 2840mg

One 3 oz. bar contains approximately 300 calories. In contrast, to get the same amount of calories, you can eat ~11x more food, 32 oz. (2 pounds) of broccoli!. One can make the counterargument that it’s difficult to eat 2 lbs. of broccoli. It’s not, and I eat a 2 pound broccoli meal 1-2x/week. What’s easier to do is eat a protein bar, not be full, and overeat! It’s much harder to overeat, in contrast, eating that much broccoli.

Next, eating that broccoli meal yields 8-11x more dietary fiber, for the same amount of calories. Dietary fiber feeds your gut bacteria, which may be involved in mechanisms underlying lifespan. Separately, broccoli’s potassium/sodum ratio is ~9.5, in comparison with less than 1 for both protein bars. An elevated potassium/sodium ratio is associated with reduced blood pressure (Zhang et al. 2013), which is a known risk factor for stroke and heart disease (Lawes et al. 2008).

Sure, it’s 2 lbs of broccoli, but are you really full after a 5-bite protein bar?

If you’re interested, please have a look at my book!

References:
Broccoli nutrition info from http://ndb.nal.usda.gov/ndb/foods/show/2920?

Lawes CM, Vander Hoorn S, Ronders A; International Society of Hypertension (2008) Global burden of blood-pressure-related disease, 2001. Lancet 371: 1513- 1518.

Zhang Z, Cogswell ME, Gillespie C, Fang J, Loustalot F, Dai S, Carriquiry AL, Kuklina EV, Hong Y, Merritt R, Yang Q. Association between usual sodium and potassium intake and blood pressure and hypertension among U.S. adults: NHANES 2005-2010. PLoS One. 2013 Oct 10;8(10).