Join us on Patreon! https://www.patreon.com/MichaelLustgartenPhD
Discount Links:
NAD+ Quantification: https://www.jinfiniti.com/intracellular-nad-test/
Use Code: ConquerAging At Checkout
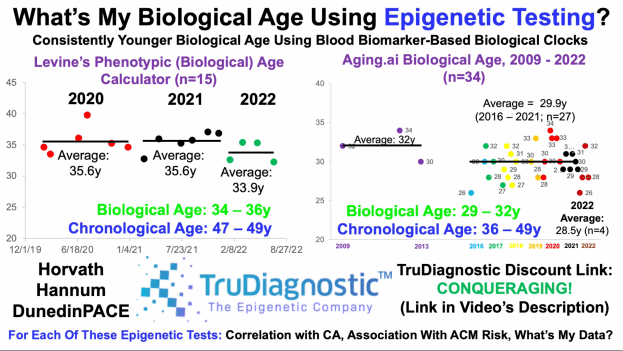
Telomere and Epigenetic Testing: Trudiagnostic.pxf.io/R55XDv
Use Code: CONQUERAGING
NAD+ Quantification: https://www.jinfiniti.com/intracellular-nad-test/
Use Code: ConquerAging At Checkout
At-Home Metabolomics: https://iollo.com?ref=michael-lustgarten Use Code: CONQUERAGING At Checkout
Oral Microbiome (Enter Code: ConquerAging): https://www.bristlehealth.com/?ref=michaellustgarten
At-Home Blood Testing: https://getquantify.io/mlustgarten
Green Tea: https://www.ochaandco.com/?ref=conqueraging
Diet Tracking: https://shareasale.com/r.cfm?b=1390137&u=3266601&m=61121&urllink=&afftrack=
If you’d like to support the channel, you can do that with the website, Buy Me A Coffee: https://www.buymeacoffee.com/mlhnrca
Conquer Aging Or Die Trying Merch! https://my-store-d4e7df.creator-spring.com/
Papers referenced in the video:
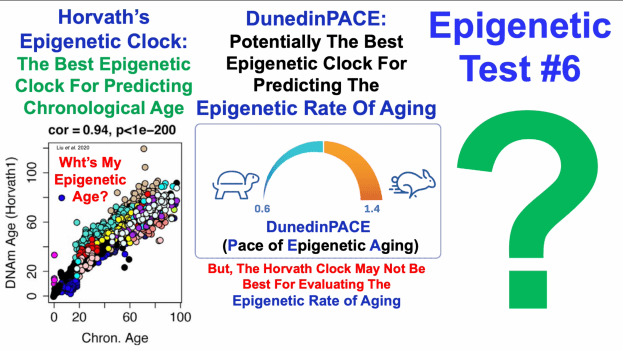
An epigenetic biomarker of aging for lifespan and healthspan
https://pubmed.ncbi.nlm.nih.gov/29676998/
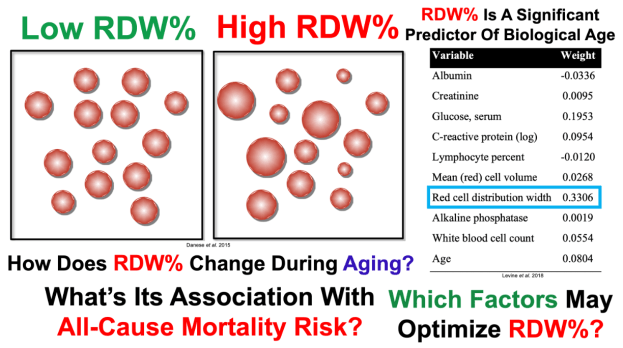
Red blood cell distribution width and cardiovascular diseases https://pubmed.ncbi.nlm.nih.gov/26623117/
Omega-3 index is directly associated with a healthy red blood cell distribution width
https://pubmed.ncbi.nlm.nih.gov/34839221/
Red blood cell distribution width is significantly associated with aging and gender
https://pubmed.ncbi.nlm.nih.gov/24897405/
Red cell distribution width associations with clinical outcomes: A population-based cohort study https://pubmed.ncbi.nlm.nih.gov/30865651/