Tag Archives: Carrots

Calcium Intake Affects The Association For Dietary Oxalate With CVD-Event Risk

Join us on Patreon! https://www.patreon.com/MichaelLustgartenPhD

Papers referenced in the video:

Dietary oxalate to calcium ratio and incident cardiovascular events: a 10-year follow-up among an Asian population https://pubmed.ncbi.nlm.nih.gov/35346210/

Effect of Different Cooking Methods on Vegetable Oxalate Content https://pubmed.ncbi.nlm.nih.gov/15826055/

Oxalate in renal stone disease: the terminal metabolite that just won’t go away https://pubmed.ncbi.nlm.nih.gov/18523430/

Advertisement

Optimizing Biological Age: Albumin

In an earlier post, I showed published data that albumin levels decrease with aging, and that lower levels are associated with an increased all-cause mortality risk (https://michaellustgarten.wordpress.com/2018/07/06/serum-albumin-and-acm/). I also showed my own blood test data (n=11), which included a strong correlation for albumin with my dietary intake of beta-carotene (= 0.75). Since then, I’ve measured my albumin levels an additional 9 times, with 20 total measurements that correspond to my tracked dietary intake. With more data, did the strength of this association get better, stay the same, or get worse?

The correlation for albumin with my dietary beta-carotene intake weakened slightly (r = 0.66), but the p-value strengthened (p = 0.0015 vs. p = 0.007):

alb update

Albumin is an important variable for predicting biological age, as demonstrated by its inclusion on the aging.ai and PhenoAge (https://michaellustgarten.wordpress.com/2019/09/09/quantifying-biological-age/) calculators. If your albumin levels aren’t close to 5 or greater than 4.5 g/dL if you’re a man or woman, respectively, you may want to consider increasing your beta-carotene intake, especially if you’re interested in optimizing biological youth. Each day, I get most of my beta-carotene  from about a pound of carrots, but also from a few ounces of spinach.

If you’re interested, please have a look at my book!

Serum Albumin Decreases During Aging: Can Diet Help?

Levels of serum albumin peak at about 20 years old (~4.6 g/dL for males, ~4.4 g/dL for females), then decrease during aging, as shown for the 1,079,193 adults of Weaving et al. (2016):

Screen Shot 2018-07-04 at 1.19.29 PM.png

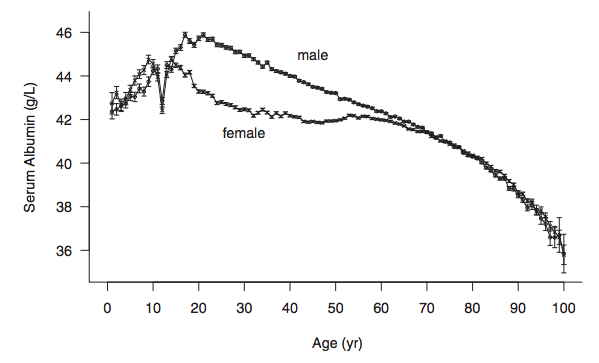
Similar age-related decreases for serum albumin albumin have also been reported in smaller studies: Gom et al. 2007 (62,854 subjects); Dong et al. 2010 (2,364 subjects); Le Couteur et al. 2010 (1,673 subjects); Dong et al. 2012 (1,489 subjects).

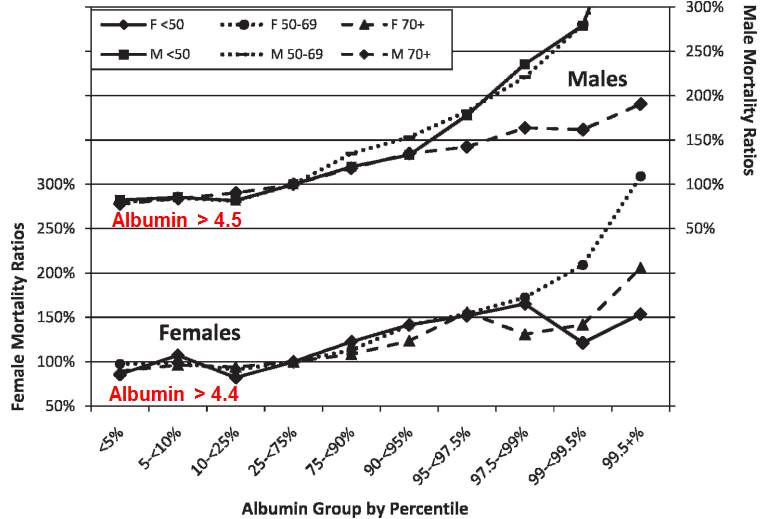
Why is it important that serum levels of albumin decrease during aging? Reduced levels of albumin are associated with an increased risk of death from all causes. For example, in the 1,704,566 adults of Fulks et al. 2010, serum albumin levels > 4.4 g/dL and 4.5 g/dL for females and males, respectively, were associated with maximally reduced risk of death from all causes, regardless of age (younger than 50y, 50-69y, or 70y+):

albumin mort.png

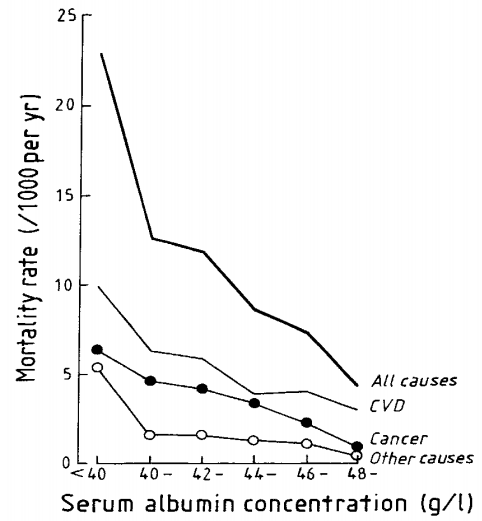
The association between reduced levels of serum albumin with an increased risk of death from all causes have also been found in smaller studies. In a ~9 year study of 7,735 men (age range, 40-59y), when serum albumin was less than 4 g/dL, the mortality rate was 23/1000/per year, compared with 4/1000/per year for subjects with values greater than 4.8 g/dL (Phillips et al. 1989):

albumin 3 mort

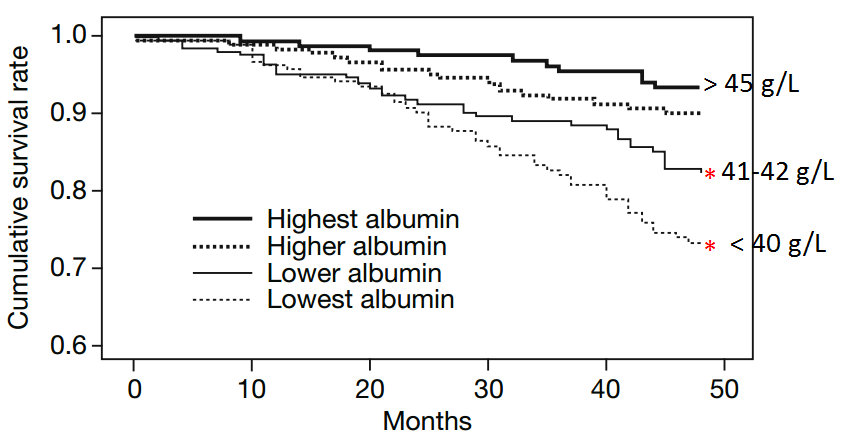
Similarly, in older adults (average age, ~80y, 672 subjects), serum albumin levels  greater than 4.5 g/dL (equivalent to 45 g/L) were associated with significantly reduced all-cause mortality risk, when compared with compared with < 4.1 g/dL (equivalent to 41 g/L, Takata et al. 2010):

albumin 2 mort

Decreased levels of serum albumin (less than 4 g/dL) being associated with an increased all-cause mortality risk was also identified in a 12-year study of 287 older adults (average age, ~75y, Sahyoun et al. 1996).

Can the age-related decrease in serum albumin be minimized, or prevented? Shown below is my data for serum albumin since 2005, when I was 32y:

alb

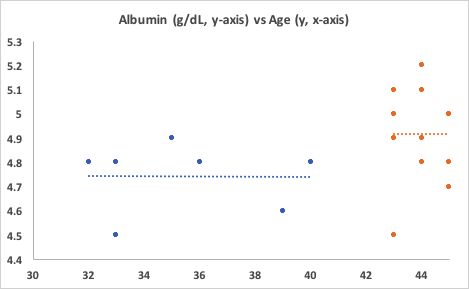
First, note the period from when I was 32y until 40y. No age-related decrease! My average albumin value over 7 measurements was 4.74 g/dL. Unfortunately, I didn’t track my dietary info during that time.

Also note the period from 43y to 45y. First, my albumin levels are significantly higher than the first period, 4.92 g/dL (p=0.027)! Second, again note the absence of an age-related decrease. Based on the data of Weaving et al. (2016), my albumin levels should be around 4.4 g/dL, but I’ve got them going in the opposite direction! How have I been able to do that?

Since April 2015, with use of a food scale, I’ve been tracking my daily dietary intake, including macro and micronutrients (54 variables). For each orange data point in the second period, I have an average dietary intake for each of the 54 variables that I can use to correlate with serum albumin. Based on that data, I can make an educated guess at what could potentially increase, or decrease it.

Of the 54 dietary variables that I track, only 3 were significantly correlated with albumin: positive associations for alpha-carotene (r = 0.66, p = 0.027), beta-carotene (r = 0.75, p =0.007), and a negative association for Vitamin K (r = -0.64, p = 0.03). Shown below is the strongest correlation of the three, beta-carotene, vs. serum albumin.

bcarot alb.png

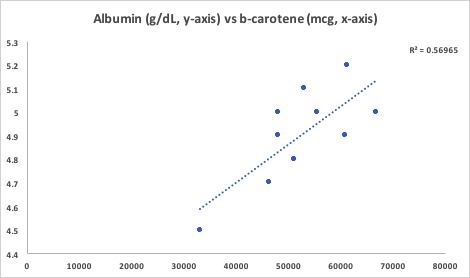
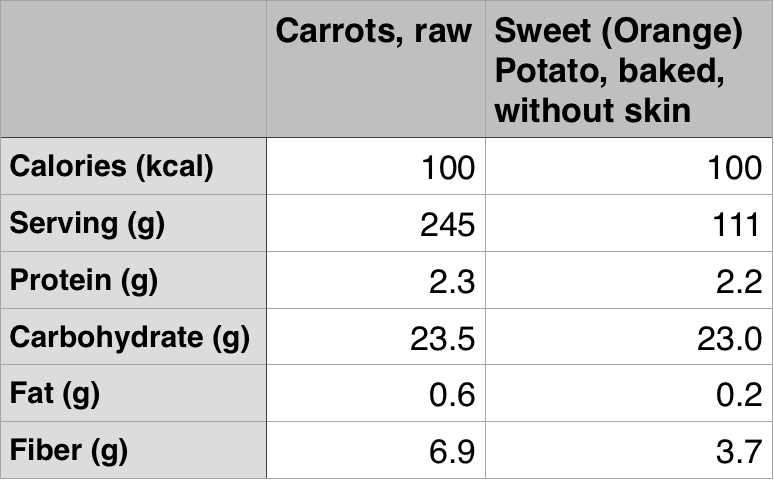
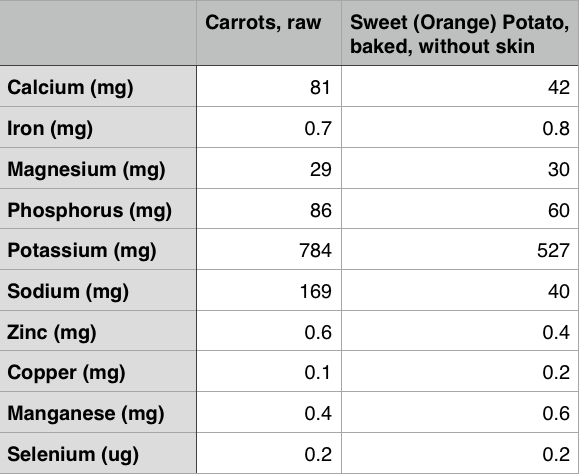
The majority of my alpha and beta-carotene intake comes from carrots, with a smaller amount coming from butternut squash. Interestingly, beta-cryptoxanthin, a Vitamin A metabolite that is abundant in butternut squash, was not significantly associated with serum albumin. Butternut squash is also a good source of alpha- and beta-carotene, so if  butternut squash was driving the correlation between the carotenes with albumin, I’d expect beta-crypoxanthin to also be significantly associated with it. However, since it’s not, carrots are the most likely source driving the association. Also note that the my average intake of Vitamin K is dramatically higher (1410 mcg; range, 1080-2203 mcg) than the RDA or AI, which are ~100-120 mcg/day. The negative association between my Vitamin K intake with albumin suggests that I should keep it closer to 1100 mcg/day to potentially keep my albumin levels high.

If you’re interested, please have a look at my book!


References

Dong MH, Bettencourt R, Barrett-Connor E, Loomba R. Alanine aminotransferase decreases with age: the Rancho Bernardo Study. PLoS One. 2010 Dec 8;5(12):e14254.

Dong MH, Bettencourt R, Brenner DA, Barrett-Connor E, Loomba R. Serum levels of alanine aminotransferase decrease with age in longitudinal analysis. Clin Gastroenterol Hepatol. 2012 Mar;10(3):285-90.e1.

Gom I, Fukushima H, Shiraki M, Miwa Y, Ando T, Takai K, Moriwaki H. Relationship between serum albumin level and aging in community-dwelling self-supported elderly population. J Nutr Sci Vitaminol (Tokyo). 2007 Feb;53(1):37-42.

Dong MH, Bettencourt R, Barrett-Connor E, Loomba R. Alanine aminotransferase decreases with age: the Rancho Bernardo Study. PLoS One. 2010 Dec 8;5(12):e14254.

Fulks M, Stout RL, Dolan VF. Albumin and all-cause mortality risk in insurance applicants. J Insur Med. 2010;42(1):11-7.

Le Couteur DG, Blyth FM, Creasey HM, Handelsman DJ, Naganathan V, Sambrook PN, Seibel MJ, Waite LM, Cumming RG. The association of alanine transaminase with aging, frailty, and mortality. J Gerontol A Biol Sci Med Sci. 2010 Jul;65(7):712-7.

Phillips A, Shaper AG, Whincup PH. Association between serum albumin and mortality from cardiovascular disease, cancer, and other causes. Lancet. 1989 Dec 16;2(8677):1434-6.

Sahyoun NR, Jacques PF, Dallal G, Russell RM. Use of albumin as a predictor of mortality in community dwelling and institutionalized elderly populationsJ Clin Epidemiol. 1996 Sep;49(9):981-8.

Takata Y, Ansai T, Soh I, Awano S, Sonoki K, Akifusa S, Kagiyama S, Hamasaki T, Torisu T, Yoshida A, Nakamichi I, Takehara T. Serum albumin levels as an independent predictor of 4-year mortality in a community-dwelling 80-year-old population. Aging Clin Exp Res. 2010 Feb;22(1):31-5.

Weaving G, Batstone GF, Jones RG. Age and sex variation in serum albumin concentration: an observational study. Ann Clin Biochem. 2016 Jan;53(Pt 1):106-11.

If Your Goal Is Optimal Nutrition, Which Is Better, Carrots Or Sweet (Orange) Potatoes?

If your goal is optimal nutrition, which orange root vegetable would you choose, carrots or sweet potatoes? 100 calories from carrots vs. 100 calories from sweet potatoes, let’s have a look!

First, to get 100 calories you can eat almost double the amount of carrots, 245g compared with 111g of a baked sweet potato. Protein and carbohydrate are about the same, whereas there is marginally more fat in carrots. However, for the same amount of calories, carrots have almost double the fiber! Fiber feed gut bacteria, which may be involved in lifespan (https://atomic-temporary-71218033.wpcomstaging.com/2014/07/16/are-the-bacteria-in-our-intestines-involved-in-mechanisms-underlying-health-and-lifespan/), so I’m all for that!

carr pot1

What about vitamin content? For the 17 Vitamins below, carrots have higher values for 10 of them, whereas sweet potatoes have higher values for only 3 vitamins. It’s important to note that for the same amount of calories, carrots have almost double the Vitamin A and beta-carotene,  17+ fold more alpha-carotene, and contain lutein+xeaxanthin (whereas sweet potatoes don’t have any!).

vitam

What about mineral content? For the 10 minerals shown in the below, raw carrots are better than sweet potato for 5 minerals, whereas sweet potato leads for 4 mineral categories. However, sweet potato is barely better for some, like magnesium, iron and copper, by 1 milligram, 0.1 and 0.1 milligrams, respectively.

miner

Carrots also contain flavanoids, including flavones (luteolin) and flavanols (kaempferol, myricetin, quercetin), whereas these metabolites are absent in sweet potatoes. An increased flavanoid intake in older adults is associated with reduced all-cause mortality risk (Ivey et al. 2015):

flav mort

So, based on energy and nutrient density (you can eat more carrots, and carrots have far more nutrition than sweet potatoes, for the same amount of calories), I would choose carrots over sweet potatoes. However, as an argument against this, Okinawans, who have one of the highest life expectancies in the world (shown below) consume more than half of the their calories from sweet potatoes (Wilcox and Wilcox 2014). Maybe carrots being better than sweet potatoes doesn’t matter? Or maybe the Okinawans would have slightly better health if they got a similar amount of calories from carrots instead?

okin

Interestingly, vegetables and fruits comprise the base of the Okinawan food pyramid (shown below; Wilcox et al. 2009), which I’ve suggested is both evolutionary accurate (https://atomic-temporary-71218033.wpcomstaging.com/2015/07/17/on-a-paleo-diet-not-if-you-fiber-intake-is-less-than/) and is optimal for maximizing nutrient density (https://atomic-temporary-71218033.wpcomstaging.com/2015/06/03/in-search-of-optimal-nutrient-density-veggies-or-whole-grains/).

okinawan food pyramid

So the take home here is that while carrots are better, it looks like you can’t go wrong eating either carrots or sweet potatoes!

If you’re interested, please have a look at my book!

References

Nutrition info (including flavanoid content) via ndb.nal.usda.gov

Ivey KL, Hodgson JM, Croft KD, Lewis JR, Prince RL. Flavonoid intake and all-cause mortality. Am J Clin Nutr. 2015 May;101(5):1012-20.

Murphy MM, Douglass JS, Birkett A. Resistant starch intakes in the United States. J Am Diet Assoc. 2008 Jan;108(1):67-78. Erratum in: J Am Diet Assoc. 2008 May;108(5):890.

Willcox DC, Willcox BJ, Todoriki H, Suzuki M. The Okinawan diet: health implications of a low-calorie, nutrient-dense, antioxidant-rich dietary pattern low in glycemic load. J Am Coll Nutr. 2009 Aug;28 Suppl:500S-516S.

Willcox BJ, Willcox DC. Caloric restriction, caloric restriction mimetics, and healthy aging in Okinawa: controversies and clinical implications. Curr Opin Clin Nutr Metab Care. 2014 Jan;17(1):51-8.