Author Archives: Michael Lustgarten

Unknown's avatar

About Michael Lustgarten

Ph.D, Physiology, University of Texas Health Science Center at San Antonio, 2009 B.S., Biochemistry, Queens College, 2003 B.A, English Textual Studies, 1994, Syracuse University

BMI: What’s Optimal For Longevity?

Is there a BMI that is associated with maximally reduced risk of death from all causes? Let’s have a look at the data!

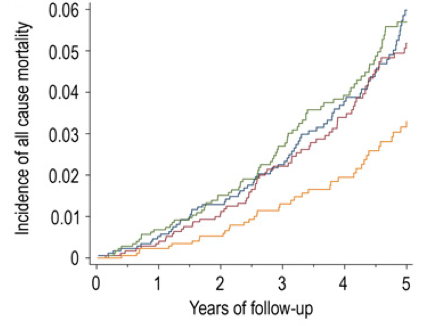
In a meta-analysis of 19 studies that included 1,460,000 adults (median age, 58 years) a BMI between 20-25 kg/m2 was associated with maximally reduced all-cause mortality risk (Berrington de Gonzalez et al. 2010):

both gend nonsmok bmi mort

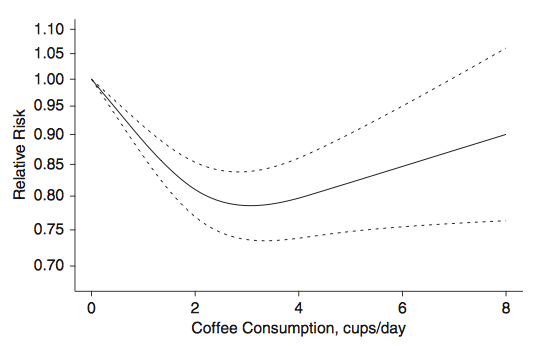
However, in a meta-analysis of 32 studies that included 197,140 older adults (65 years+), a BMI between 24 and 31 kg/m2 was associated with maximally reduced all-cause mortality risk (Winter et al. 2014). More specifically, a BMI between 26-26.9 kg/m2 was associated with maximally reduced all-cause mortality risk for never-smokers (Winter et al. 2014):

acm 65

So what’s optimal for longevity in terms of BMI, is it 20-25 kg/m2, or potentially higher, as reported in older adults? For additional insight about the association between BMI with all-cause mortality, I looked up the published BMI data for centenarians:

bmi cent

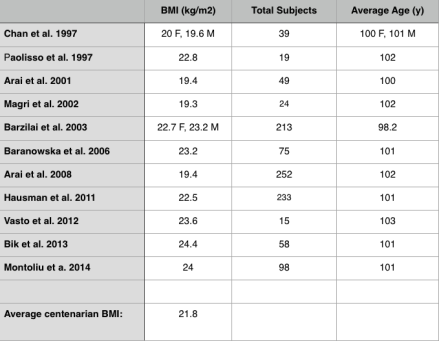
In these 11 studies that included 1075 centenarians, the BMI range was between 19.3-24.4 kg/m2, with an average BMI of 21.8. Shouldn’t that be the BMI reference range for those interested in living past 100?

If you’re interested, please have a look at my book!


References

Arai Y, Hirose N, Yamamura K, Shimizu K, Takayama M, Ebihara Y, Osono Y. Serum insulin-like growth factor-1 in centenarians: implications of IGF-1 as a rapid turnover protein. J Gerontol A Biol Sci Med Sci. 2001 Feb;56(2):M79-82.

Arai Y, Takayama M, Gondo Y, Inagaki H, Yamamura K, Nakazawa S, Kojima T, Ebihara Y, Shimizu K, Masui Y, Kitagawa K, Takebayashi T, Hirose N. Adipose endocrine function, insulin-like growth factor-1 axis, and exceptional survival beyond 100 years of age. J Gerontol A Biol Sci Med Sci. 2008 Nov;63(11):1209-18.

Baranowska B, Bik W, Baranowska-Bik A, Wolinska-Witort E, Szybinska A, Martynska L, Chmielowska M. Neuroendocrine control of metabolic homeostasis in Polish centenarians. J Physiol Pharmacol. 2006 Nov;57 Suppl 6:55-61.

Barzilai N, Atzmon G, Schechter C, Schaefer EJ, Cupples AL, Lipton R, Cheng S, Shuldiner AR. Unique lipoprotein phenotype and genotype associated with exceptional longevity. JAMA 2003;290:2030–40.

Berrington de Gonzalez A, Hartge P, Cerhan JR, Flint AJ, Hannan L, MacInnis RJ, Moore SC, Tobias GS, Anton-Culver H, Freeman LB, Beeson WL, Clipp SL, English DR, Folsom AR, Freedman DM, Giles G, Hakansson N, Henderson KD, Hoffman-Bolton J, Hoppin JA, Koenig KL, Lee IM, Linet MS, Park Y, Pocobelli G, Schatzkin A, Sesso HD, Weiderpass E, Willcox BJ, Wolk A, Zeleniuch-Jacquotte A, Willett WC, Thun MJ. Body-mass index and mortality among 1.46 million white adults. N Engl J Med. 2010 Dec 2;363(23):2211-9. doi: 10.1056/NEJMoa1000367. Erratum in: N Engl J Med. 2011 Sep 1;365(9):869.

Bik W, Baranowska-Bik A, Wolinska-Witort E, Kalisz M, Broczek K, Mossakowska M, Baranowska B. Assessment of adiponectin and its isoforms in Polish centenarians. Exp Gerontol. 2013 Apr;48(4):401-7.

Chan YC, Suzuki M, Yamamoto S. Dietary, anthropometric, hematological and biochemical assessment of the nutritional status of centenarians and elderly people in Okinawa, Japan. J Am Coll Nutr. 1997 Jun;16(3):229-35.

Hausman DB, Johnson MA, Davey A, Poon LW. Body mass index is associated with dietary patterns and health conditions in georgia centenarians. J Aging Res. 2011;2011:138015.

Magri F, Muzzoni B, Cravello L, Fioravanti M, Busconi L, Camozzi D, Vignati G, Ferrari E. Thyroid function in physiological aging and in centenarians: possible relationships with some nutritional markers. Metabolism. 2002 Jan;51(1):105-9.

Montoliu I, Scherer M, Beguelin F, DaSilva L, Mari D, Salvioli S, Martin FP, Capri M, Bucci L, Ostan R, Garagnani P, Monti D, Biagi E, Brigidi P, Kussmann M, Rezzi S, Franceschi C, Collino S. Serum profiling of healthy aging identifies phospho- and sphingolipid species as markers of human longevity. Aging (Albany NY). 2014 Jan;6(1):9-25.

Paolisso G, Ammendola S, Del Buono A, Gambardella A, Riondino M, Tagliamonte MR, Rizzo MR, Carella C, Varricchio M. Serum levels of insulin-like growth factor-I (IGF-I) and IGF-binding protein-3 in healthy centenarians: relationship with plasma leptin and lipid concentrations, insulin action, and cognitive function. J Clin Endocrinol Metab. 1997 Jul;82(7):2204-9.

Vasto S, Scapagnini G, Rizzo C, Monastero R, Marchese A, Caruso C. Mediterranean diet and longevity in Sicily: survey in a Sicani Mountains population. Rejuvenation Res. 2012 Apr;15(2):184-8.

Winter JE, MacInnis RJ, Wattanapenpaiboon N, Nowson CA. BMI and all-cause mortality in older adults: a meta-analysisAm J Clin Nutr. 2014 Apr;99(4):875-90.

Jesse Hahn should not be a starting pitcher!

Billy Beane has great success in finding under-valued talent. However, why is Jesse Hahn being used as a starting pitcher? Shown below are his pitching data, including college, the minors and majors.

hahn

What we see is that Hahn has been a starter for almost his entire career. However, his career high for innings pitched in 8 years was last year, totaling 115 innings. Do the A’s intend to get 150 innings out of Hahn as their #5 starter? That seems to be a best case scenario. Including college, Hahn has averaged 57 innings per year, including missing all of 2011. Take out 2011 and his yearly average is still only 66.3 innings! In a worst case scenario, Hahn may not last the full year. Based on these data, Hahn may be best suited for a relief role.

Stats via thebaseballcube.com

Eat more green leafy vegetables, reduce mortality risk?

Vitamin K is found in 2 predominant forms, Vitamin K1 (phylloquinone), found almost exclusively in green leafy vegetables, and Vitamin K2 (Menaquinone), found in fermented foods, organ meats, meat, butter and eggs. In the data below (Juanola-Falgarona et al. 2014), we see that Vitamin K1 (phylloquinone) is negatively associated with death from all causes:

all cause mortl phylo

Death from all causes was assessed based on the average value for four groups of Vitamin K1 intake: 171 ug/day = blue line, 276 ug/day =red line, 349 ug/day = green line and 626 ug/day = the yellow line. In the data above, Vitamin K1 values less than 349 ug/day are about the same in terms of all-cause mortality risk. However, those who ate 626 ug/day of Vitamin K1 had about half of the mortality risk compared to the lower K1 intake groups! Interestingly, the RDA for Vitamin K, at 90 ug/day seems to be outdated, based on the data above. Also, Vitamin K2 was not associated with all-cause mortality risk, as shown below:

k2 all cause

Based on the K1 mortality data, 626 ug/day seems like a good goal. However, osteocalcin is a Vitamin K-dependent protein that has been shown to be maximally active in the presence of 1000 ug of Vitamin K1 (Binkley et al. 2002)! Osteocalcin is involved in pathways that decline with aging: insulin secretion and β-cell proliferation in the pancreas, energy expenditure by muscle, insulin sensitivity in adipose tissue, muscle and liver, and increased testosterone production (Karsenty and Ferron 2012). Therefore, getting 1000 ug+ per day of Vitamin K1 may optimize all of these functions and, decrease mortality risk!

What’s the take home from these data? Eat more leafy greens! How much is needed to get 1000 ug  per day? Shown below is a short list of foods rich in Vitamin K and the serving size needed to reach 1000 ug. Approximately 4 ounces of cooked kale or 7 oz. of raw spinach will suffice, and at a low calorie yield. Other foods, like broccoli, brussel sprouts or romaine lettuce would need to be consumed in far greater amounts to reach 1000 ug.

k osteo

What’s my daily K1 intake? Shown below is my 7-day average (7/16/2015 – 7/22/2015) for K intake, derived almost exclusively from plant sources. 1379 ug/day puts me well above the 626 ug/day that was associated with reduced mortality risk, and above the 1000 ug/day needed for maximal osteocalcin activation.

my k intake

If you’re interested, please have a look at my book!


References:

Binkley NC, Krueger DC, Kawahara TN, Engelke JA, Chappell RJ, Suttie JW. A high phylloquinone intake is required to achieve maximal osteocalcin gamma-carboxylation. Am J Clin Nutr. 2002 Nov;76(5):1055-60.

Juanola-Falgarona M, Salas-Salvadó J, Martínez-González MÁ, Corella D, Ostrich R, Ros E, Fitó M, Arós F, Gómez-Gracia E, Fiol M, Lapetra J, Basora J, Lamuela-Raventós RM, Serra-Majem L, Pintó X, Muñoz MÁ, Ruiz-Gutiérrez V, Fernández-Ballart J, Bulló M. Dietary intake of vitamin K is inversely associated with mortality risk. J Nutr. 2014 May;144(5):743-50.

Karsenty G, Ferron M. The contribution of bone to whole-organism physiologyNature. 2012 Jan 18;481(7381):314-20.

Is coffee associated with reduced mortality risk?

Data from large epidemiological studies can be used to guide decisions about health. There’s a lot of confusion about coffee consumption in terms of health…What does the epidemiological data say?

Crippa et al. (2014) pooled the results from 21 studies that included almost 1 million subjects (997,464 to be exact). As shown below, 4 cups of coffee per day (~32 oz, about 1 Liter) is associated with ~15% reduced risk of death from all causes.

Screen Shot 2015-04-28 at 7.36.09 PM

More specifically, what about coffee consumption and risk of death from heart disease and cancer? As shown below, ~3 cups of coffee per day is associated with reduced risk of death from heart disease (CVD). Interestingly, CVD risk increases at coffee consumption >3 cups per day:

Screen Shot 2015-04-28 at 7.38.13 PM

What about coffee consumption and cancer risk? As shown below, although the association between coffee and cancer was not statistically significant, it looks like ~3 cups of coffee is associated with reduced cancer risk, whereas risk begins to increase in amounts greater than 3 cups.

Screen Shot 2015-04-28 at 7.40.41 PM

I hope this clears up some of the confusion that exists about coffee consumption and health!

If you’re interested, please have a look at my book!

Reference

Crippa A, Discacciati A, Larsson SC, Wolk A, Orsini N. Coffee consumption and mortality from all causes, cardiovascular disease, and cancer: a dose-response meta-analysis. Am J Epidemiol. 2014 Oct 15;180(8):763-75.

Does the Hack-a-DeAndre Jordan approach work?

The Clippers averaged 1.28 points per FG attempt during the regular season. Last night, they averaged 1.16. Had DeAndre made all 11 of his missed FTs, the Clippers would’ve averaged 1.28 points per FG attempt. In other words, the Spurs held the Clippers below their average value by exploiting DeAndre Jordan’s inability to make FT’s at a high percentage.

In game 1, the Clips averaged 1.31 points per FG attempt, with Jordan making 5-12 FTs. Maybe 17 FTs is the magic number for the Spurs to win?

Kyle Schwarber may be the next big-time Cubs prospect to be promoted

Update: Schwarber is still doing well at AA. Through 31 games, he has 7 HR and 20 RBI’s, and is also showing great plate discipline, with 22 BBs. However, he probably shouldn’t be promoted as a catcher-he has only stopped 7 base runners from stealing, while 34 have succeeded!

4/23/2015 Although he only has 4 RBI’s through 10 games in AA, Kyle Schwarber is playing well (.345/.513/1.030), and in my opinion will be promoted to AAA soon, and to MLB sometime this year. Here’s his MILB page: http://www.milb.com/player/index.jsp?sid=milb&player_id=656941#/career/R/hitting/2015/ALL

Leucine inhibits myostatin-which foods are rich in leucine?

In a previous article I wrote about the effect of epicatechin on reducing myostatin, which may increase muscle mass (https://atomic-temporary-71218033.wpcomstaging.com/2015/02/02/inhibit-myostatin-with-chocolate-increase-muscle-mass/). Are there any other ways to inhibit myostatin with the goal of increasing muscle mass?

10 grams of essential amino acids have been shown to reduce myostatin levels in skeletal muscle (Drummond et al. 2009). Because essential amino acids are found in high amounts in animal protein-containing foods, the answer to decrease myostatin would be to eat more protein, right?

Not so fast, because high protein diets (~20% of total calories), especially from animal sources are associated with an increased all-cause mortality risk in people younger than 65 years when compared with those eating a low protein diet (~10% of total calories; Levine et al. 2014). Fortunately, it isn’t just a bolus of essential amino acids that inhibits myostatin. Addition of the essential amino acid leucine to muscle cells inhibits myostatin expression, causing them to grow (Chen et al. 2013). If your goal is to maximize muscle mass but also, optimal health, what daily intake of leucine should you aim for while keeping your total protein intake low?

It has been reported that a leucine intake of 45 mg/kg/day (or more) may be required by athletes to maximize muscle protein synthesis (Mero 1999). For a 70 kg person, this translates into 3.15g of leucine per day (45 mg*70kg=3150mg, = 3.15g). Shown below is my 7-day average (5/21/2015-5/28/2015) protein intake. From the chart, my average daily leucine intake is 3.2 g. However, the nutrient tracking software that I use for some reason includes the total protein amount from my daily can of sardines but not its constituent amino acids. I used ndb.nal.usda.gov to get that info: 1 can of sardines has 1.6 g of leucine. In total, my daily leucine intake is 4.8 g/day. My body weight is currently at 69.1 kgs. These values put me at 70 mg leucine/kg body weight/day (70 * 69.1kg = 4837 mg, = 4.8 g), which is well above the 45 mg/kg/day value above.

leu

So which foods are rich in leucine? Below I’ve ranked foods based on their leucine content (in grams) divided by total calories. Egg whites and cod fish are the all-stars for leucine content per calorie. Chicken and beef are relatively good sources of leucine. Although spinach is better than skim milk when comparing its leucine/calorie content, none of the vegetables or beans come close to the leucine/calorie content found in egg whites or cod fish.

leucine calorie

If you’re interested, please have a look at my book!

References:

Chen X, Huang Z, Chen D, Yang T, Liu G.MicroRNA-27a is induced by leucine and contributes to leucine-induced proliferation promotion in C2C12 cells. Int J Mol Sci. 2013 Jul 8;14(7):14076-84.

Drummond MJ, Glynn EL, Fry CS, Dhanani S, Volpi E, Rasmussen BB. Essential amino acids increase microRNA-499, -208b, and -23a and downregulate myostatin and myocyte enhancer factor 2C mRNA expression in human skeletal muscle. J Nutr. 2009 Dec;139(12):2279-84.

Levine ME, Suarez JA, Brandhorst S, Balasubramanian P, Cheng CW, Madia F, Fontana L, Mirisola MG, Guevara-Aguirre J, Wan J, Passarino G, Kennedy BK, Wei M, Cohen P, Crimmins EM, Longo VD. Low protein intake is associated with a major reduction in IGF-1, cancer, and overall mortality in the 65 and younger but not older population. Cell Metab. 2014 Mar 4;19(3):407-17.

Mero A. Leucine supplementation and intensive training. Sports Med. 1999 Jun;27(6):347-58

Homemade peanut butter and berry jelly!

Here’s my recipe for homemade peanut butter and jelly!

Homemade PB&J

Whole wheat bread: 600g whole wheat flour, 1.5g yeast, 80g brown sugar, 350 mL water. Put all ingredients into the bread machine for 90 minutes.

56 g shelled raw peanuts, ground in the food processor. Add 1 teaspoon of peanut oil after the peanuts are ground.

1 large cup of mixed berries, cooked until the water is boiled off (~20 minutes).

Why eat it from the store, as you’re probably also eating the chemicals and preservatives that are added to increase shelf life? Enjoy!

If you’re interested, please have a look at my book!

Inhibit myostatin with chocolate, increase muscle mass?

Mice that don’t have myostatin have dramatically increased muscle mass:

MyostatinMs

Myostatin levels increase during aging, a finding that may (at least partially) explain age-related decreases in muscle mass (Basaria and Bhasin 2012). Is there anything that we can do besides strength-training (Snijders et. al 2014) to decrease myostatin levels?

To address this question, Gutierrez-Salmean and colleagues (2014) supplemented young and old mice and humans (29 vs. 62y) with epicatechin, which is found in may foods (see the Table below). They found that in both mice and humans, myostatin increased during aging. However, epicatechin supplementation decreased muscle myostatin levels in both young and old mice and humans! Although they did not report how muscle mass changed as a result of epicatechin supplementation, grip strength significantly improved after only 7 days of supplementation in the older adults. Although this study had a relatively small sample size (20 total subjects), that a food component can reduce myostatin levels is an interesting finding.

So, which foods are rich in epicatechin?

Atop the list are cocoa containing products. It is important to note that 50mg/day of epicatechin were provided to the human volunteers of the Gutierrez-Salmean study. Obtaining 50mg of epicatechin may be relatively easy, if one chooses wisely from the foods listed in the Table, which are listed in mg/gram food, but should be listed as mg/100 grams of food (sorry about the mistake!). For example, drinking 20 ounces of white, black or green tea would yield 10-46mg of epicatechin. Homemade chocolate (https://atomic-temporary-71218033.wpcomstaging.com/2014/09/21/homemade-chocolate-in-2-minutes/) containing 1 ounce of cacao beans yields ~27 mg of epicatechin.

epicatechin foods table

If you’re interested, please have a look at my book!

References:

Epicatechin data: http://www.ars.usda.gov/SP2UserFiles/Place/80400525/Data/Flav/Flav_R03.pdf

Basaria S, Bhasin S. Targeting the skeletal muscle-metabolism axis in prostate-cancer therapy. N Engl J Med. 2012; 367:965–967.

Gutierrez-Salmean G, Ciaraldi TP, Nogueira L, Barboza J, Taub PR, Hogan MC, Henry RR, Meaney E, Villarreal F, Ceballos G, Ramirez-Sanchez I. Effects of (-)-epicatechin on molecular modulators of skeletal muscle growth and differentiation. J Nutr Biochem. 2014 Jan;25(1):91-4.

Snijders T, Verdijk LB, Smeets JS, McKay BR, Senden JM, Hartgens F, Parise G, Greenhaff P, van Loon LJ. The skeletal muscle satellite cell response to a single bout of resistance-type exercise is delayed with aging in men. Age (Dordr). 2014;36(4):9699.

Dietary fiber from whole grains is associated with reduced mortality risk-which grains are highest in fiber?

In an earlier post I reported that dietary fiber from whole grains is associated with reduced mortality risk for all causes, cardiovascular disease, cancer, respiratory and infectious disease in both men and women (https://atomic-temporary-71218033.wpcomstaging.com/2014/08/02/is-dietary-fiber-associated-with-reduced-mortality/).

More specifically, which whole grains are highest in fiber?

Shown below are grams of dietary fiber per 100 grams (uncooked) for each respective grain.

grain fiber

It should be clear from the table that barley (16.6g) and rye (15.1g) are the all-stars for grains with the highest amounts of dietary fiber per 100g. Wheat (12.2g) and oats (10.6g) are also excellent sources. Because of the association between dietary fiber from grains and reduced mortality risk, it might be a good idea to add these foods to your diet!

If you’re interested, please have a look at my book!