Tag Archives: aging

Interpreting Blood Test Results (Serum Bicarbonate, Anion Gap): What’s Optimal For Health?

My approach to optimizing health and potentially lifespan includes daily nutrient tracking and yearly blood testing. Once you get your blood test results back from the doctor, are your values optimal if you’re within the reference range? This article will examine the “optimal range” for 2 of these measurements, serum bicarbonate and the anion gap.

What does serum bicarbonate measure? The amount of bicarbonate in the blood is indicative of dietary acid load (Adeva and Souto 2011), systemic metabolism, lung and kidney function. First, a diet rich in animal products and grains (acid-forming), and poor in fruits and vegetables (base-forming) can induce a state of metabolic acidosis (Sebastian et al. 2001). Similarly, cellular metabolism produces carbon dioxide (CO2), a gas that is an acid. The lungs and kidneys act to remove systemic increases in acid load: CO2 reacts with water to form bicarbonate (H2CO3-), where it travels to the lung for excretion by exhaling it as CO2. The kidneys decrease acid (whether from the diet or metabolism) by removing protons (H+) from the blood, followed by urinating the acid out of the body, and also by producing bicarbonate. In sum, serum bicarbonate is a measure of acid load: from the diet, by your body’s ability to produce it, by your kidney’s ability to buffer it, and by your lungs ability to remove it.

Low serum bicarbonate is indicative of increased systemic acidity, whereas a high serum bicarbonate indicates systemic alkalinity. If systemic acidity is high, bicarbonate will be consumed to neutralize the acid, thereby decreasing serum bicarbonate. Assuming that bicarbonate is not being consumed in the diet (via fruits and vegetables), the kidney would have to then produce bicarbonate to make up for the increase in bicarbonate consumption.

The anion gap is a second indicator of systemic acid/base balance. It is a measure of the positively and negatively charged ions in blood, and includes serum bicarbonate. It is calculated by adding the serum concentrations of sodium (Na) and potassium (K), while subtracting chloride (Cl-) and bicarbonate (HCO3-):

Anion gap = ( [Na+] + [K+] ) − ( [Cl−] + [HCO3−] )

A high anion gap is indicative of systemic acidity whereas a low value is indicative of alkalinity.

The reference range for serum bicarbonate and the anion gap are 20-30 and 5-18 mEq/L. On my latest blood test (8/2015) my values were 31 and 6, respectively…Are these values optimal for health?

First, as shown below, decreased serum bicarbonate values are associated with increased risk for future physical function limitation (Yenchek et al. 2014). In a study of 1544 overweight (BMI ~27 kg/m2) older adults (average age, ~75 years) with a median follow-up of ~4 years, acidic serum bicarbonate values (less than 25.9) had an increased risk for future functional limitation, when compared with subjects with more alkaline values (greater than 26). It is important to note that age-related decreased kidney function leads to an inability to produce bicarbonate, thereby decreasing serum bicarbonate. However, after adjusting for the presence or absence of subjects with chronic kidney disease (CKD), the association between a more acidic serum bicarbonate value with future functional limitation remained. In other words, poor kidney function was not driving the effect of acidosis on risk for future functional limitation.

funct lim

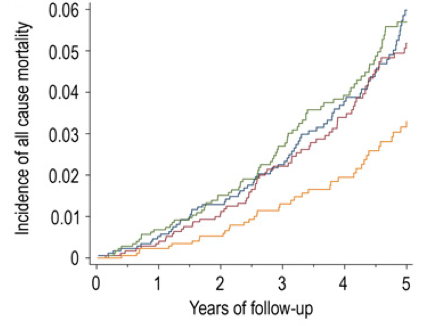
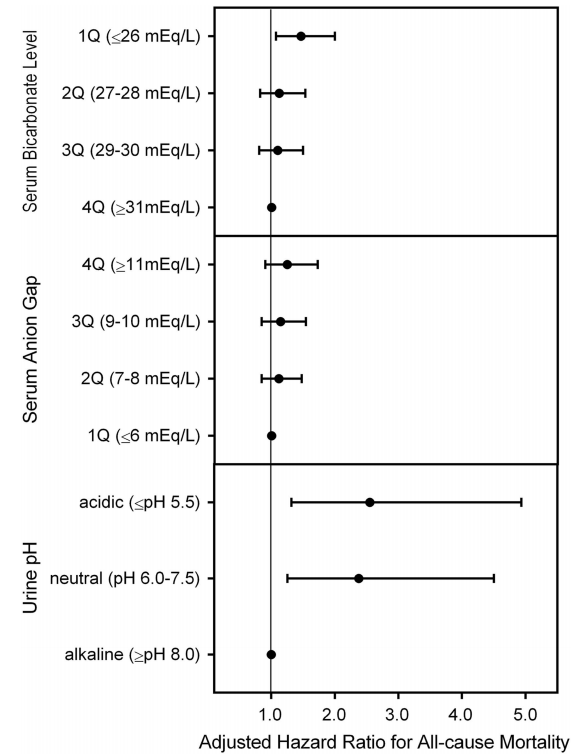
In a larger study that included 31,590 subjects with average age of ~50 years, an average BMI <25 kg/m2, and a median follow up ~8 years, a serum bicarbonate value < 26, compared with 31, had a 46% significantly increased all-cause mortality risk (see below; Park et al. 2015). For the anion gap, although mortality risk was increased at values > 11, compared with less than 6, this finding was not statistically significant. Nonetheless a trend for increased mortality risk with a more acidic value for the anion gap was present. In addition, although urine pH is not generally measured when you get a yearly physical, it’s an easy (just pee in a cup!) and inexpensive way to see if you’re peeing out more acid or base. In the figure below, we see that with urinating out more base (pH >8.0) as the reference, peeing out more acid (pH <7.5) is associated with a ~250% increased mortality risk! Assuming you have properly functioning kidneys, urinating more base will happen if your diet is rich in alkaline-rich foods, like vegetables. In contrast, a high meat and grains-based diet will lead to urinating out more acid.

bicarb anion gap urine ph

In contrast to these data, shown below are the findings of Raphael et al. 2013, who found no association between serum bicarbonate with mortality risk. In that study, 15,836 overweight (the BMI range average was from 26-29) subjects with an average age ~43 years were followed for ~9 years. Although an acidic serum bicarbonate value (<22, compared with 26-30 as the reference) was associated with a 75% increased all-cause mortality risk, when excluding subjects with CKD from the analysis, that association was no longer statistically significant. However, it is important to note a similar trend (albeit non-significant) of association between acidic serum bicarbonate values with an increased mortality risk was present in those that did not have CKD.

stud2

Further support for alkaline values for serum bicarbonate or the anion gap being beneficial for health is shown below. A low anion gap (after adjusting for serum albumin) was associated with better survival with a more alkaline value (<10.5), when compared with acidic values (>10.5) in 862 normal weight (BMI ~24) elderly (average age ~74y), during a 5-year follow up (Ahn et al. 2014). Included in the improved survival rate were decreases in cardiovascular disease and infection-related mortality.

ag mort

One criticism of this data is that these associations are in older adults, and that age-related decreases in kidney function may lead to an inability to produce bicarbonate, thereby increasing the anion gap. In disagreement with that critique, young subjects (age range, 20-49 years) with low serum bicarbonate and an elevated anion gap (which together suggest systemic acidosis) were significantly more likely to have decreased cardiorespiratory fitness (VO2 max) (Abramowitz et al. 2012).

Collectively, based on these data it looks like my serum bicarbonate (31) and anion gap (6) values are close to optimal for health and longevity. If your values are not close to optimal, can they be improved? Yes! Increasing fruit and vegetable (F&V) intake has been shown to increase serum bicarbonate (Goraya et al. 2013). Because bicarbonate is a component of calculating the anion gap, an increase in fruit and vegetable intake would be expected to also decrease the anion gap (although I couldn’t find any studies that have tried to use F&V to reduce it).

If you’re interested, please have a look at my book!

References

Abramowitz MK, Hostetter TH, Melamed ML. Lower serum bicarbonate and a higher anion gap are associated with lower cardiorespiratory fitness in young adults. Kidney Int. 2012 May;81(10):1033-42.

Adeva MM, Souto G. Diet-induced metabolic acidosis. Clin Nutr. 2011 Aug;30(4):416-21.

Ahn SY, Ryu J, Baek SH, Han JW, Lee JH, Ahn S, Kim KI, Chin HJ, Na KY, Chae DW, Kim KW, Kim S. Serum anion gap is predictive of mortality in an elderly population. Exp Gerontol. 2014 Feb;50:122-7.

Goraya N, Simoni J, Jo CH, Wesson DE. A comparison of treating metabolic acidosis in CKD stage 4 hypertensive kidney disease with fruits and vegetables or sodium bicarbonate. Clin J Am Soc Nephrol. 2013 Mar;8(3):371-81.

Park M, Jung SJ, Yoon S, Yun JM, Yoon HJ. Association between the markers of metabolic acid load and higher all-cause and cardiovascular mortality in a general population with preserved renal function. Hypertens Res. 2015 Jun;38(6):433-8.

Raphael KL, Zhang Y, Wei G, Greene T, Cheung AK, Beddhu S. Serum bicarbonate and mortality in adults in NHANES III. Nephrol Dial Transplant. 2013 May;28(5):1207-13.

Sebastian A, Frassetto LA, Sellmeyer DE, Merriam RL, Morris RC Jr. Estimation of the net acid load of the diet of ancestral preagricultural Homo sapiens and their hominid ancestors. Am J Clin Nutr. 2002 Dec;76(6):1308-16.

Circulating Liver Enzymes: AST and ALT, What’s Optimal For Health?

Two blood markers of liver health are aspartate aminotransaminase (AST) and alanine aminotransaminase (ALT). AST and ALT are proteins that are usually found inside liver cells, but when there is liver cell damage, they’re released into the blood. It’s important to note that these proteins can also be elevated in the blood because of muscle damage. The reference range for AST is 10-40 U/L, and 7-56 U/Lfor ALT, but are these values optimal for health and longevity?

In a meta-analysis that included ~9 million adults (average age, 51y) that were followed for up to 20 years, Kunutsor et al. (2014) reported the association between AST and ALT with all-cause mortality risk. For AST (4 studies, 9,046,609 subjects), 10-15 U/L was associated with maximally reduced all-cause mortality risk:

ast acm.png

For ALT (8 studies, 9,087,436 subjects), 12-15 U/L was associated with maximally reduced all-cause mortality risk:

alt acm

While these studies are relevant for middle-aged adults between ~50-70y, what about at older ages? Shown below are the AST and ALT values for adults older than 100 years (centenarians):

ast alt cent.png

Interestingly, the centenarians’ AST and ALT values are not far from the meta-analysis data for middle-aged adults. For example, the centenarians’ AST values range from 17-23, and their ALT values from 9-14.

What are my my AST and ALT values? As shown below, I’ve measured them 9 times in the past 10 years. Based on the all-cause mortality and centenarian data my AST and ALT values are too high!

my ast alt

What am I doing to reduce my AST and ALT? Fructose is metabolized by the liver, where high amounts can increase liver cell damage, resulting in increased circulating AST and ALT (Le et al. 2009, Perez-Pozo et al. 2010). Therefore, I’ve reduced my total dietary fructose intake from ~16-18% during the 3 months prior to my last blood test (August, 2015), to ~11-14%. I plan on retesting within the next 2 months, to see if this approach works!

3/23/2016 Update: My average daily fructose intake, expressed as a percentage of total calories, for the 3-month period before my August 2015 blood test was 15.9%. During the 3-month period before my latest blood test (3/2016), my average daily fructose intake was 12.9%. Although a 3% decrease doesn’t seem like much, the difference between these 2 values is highly statistically significant (p value = 7.5E-12). Nonetheless, my liver enzymes didn’t change, with AST and ALT values of 28 and 30, respectively.

My next attempt to reduce my liver enzymes involves reducing my daily green tea intake.  High doses of green tea have been shown to negatively affect the liver (Mazzanti et al. 2009). I currently drink ~6 cups of green tea per day, which may be too much. To test that hypothesis, I’ll reduce my daily green tea to 4 cups/day, and retest my liver enzymes in a few months.

12/8/2017 Update: Since 3/2016, I’ve tested my blood 7 times, and on each measurement, my ALT and AST were both still in the mid 30’s (or higher!). The green tea reduction experiment didn’t work, nor did ~30g of milk thistle seeds/day for 30+ days, nor did reducing my fructose intake to ~9% of total calories. Because I’ve tracked my nutrition in concordance with blood testing, I can look at which nutrients correlate with my liver enzymes, and reduce/increase certain foods that may impact them. Interestingly, my dietary niacin levels (x-axis), which average 41 mg/day (including all data since 2015) were strongly correlated with ALT (y-axis; r = 0.7, R^2=0.50):

Screen Shot 2018-01-06 at 1.21.59 PM

Note that the RDA for niacin is ~15 mg/day for males, and my average niacin intake in more than 2-fold higher than that! This may be a case where higher than the RDA is not optimal for health. Niacin in high doses, albeit in grams, not milligrams, is well known to induce liver damage, so isn’t it possible that my 2-fold higher than the RDA niacin intake is inducing liver damage? Sometime in January, I’ll retest my liver enzymes (and everything else, of course) while reducing my dietary niacin intake from the low 40’s to the low 30’s. As I’ve mentioned in previous posts, I eat lots of mushrooms, around 300 grams at a time, which supply around 11 mg of niacin. That’s atop the list to reduce my niacin intake. Stay tuned for the data!

1/6/2018 Update: Finally, progress! On my 1/3/2018 blood test, I was able to reduce my ALT from my average 37 U/L (over 9 different tests) value to 29! To reduce it, I tried two main things: reducing my dietary niacin intake, and increasing my selenium intake.

First, as noted above, the moderately strong correlation between my dietary niacin intake with ALT suggested that reducing it may also reduce my ALT. From 12/6/2017 to 1/2/2018, I reduced my average daily niacin intake from 41 mg/day to 33.1 mg. Interestingly, in adding that data to my 9 other blood test measurements over the last 27 months, the correlation between my niacin intake with my ALT remained strong (r = 0.75, R^2 = 0.58).

Second, I also increased my dietary selenium intake, which may be involved in affecting my ALT levels. Superficially, when examining the correlation between my average selenium intake (186 mcg/day; x-axis) with ALT (y-axis), we see a very weak negative correlation (r = -0.24, R^2 = 0.06):
Screen Shot 2018-01-06 at 1.43.33 PM.png

Then why did I increase my daily selenium intake from an average value of 186 mg/day to 207 mg/day for the 1-month period that preceded my latest blood test? I discovered that the correlation between dietary selenium density (selenium intake/100 calories) with ALT was strong (= -0.69, R^2 = 0.47):

Screen Shot 2018-01-06 at 1.37.32 PM

Why did I look at dietary selenium density instead of its absolute value? If I eat more calories, one would expect higher levels of selenium (or other nutrients), assuming I’m not eating junk. By accounting for my calorie intake, I may be better able to see how dietary nutrients affect my circulating biochemistry, rather that only looking at the absolute values for each nutrient. Also note that the correlation between niacin density (mg niacin/100 calories) was not as strong (= 0.53, R^2 = 0.28) as the correlation between selenium density with ALT.

Is my ALT sensitive to changes in niacin, selenium, or both? Alternatively, maybe it wasn’t niacin or selenium, but an aberrant reading? I’ll keep my niacin relatively low, and my selenium relatively high, so let’s see on my next test at the end of the month.

If you’re interested, please have a look at my book!


References

Arai Y, Takayama M, Gondo Y, Inagaki H, Yamamura K, Nakazawa S, Kojima T, Ebihara Y, Shimizu K, Masui Y, Kitagawa K, Takebayashi T, Hirose N. Adipose endocrine function, insulin-like growth factor-1 axis, and exceptional survival beyond 100 years of age. J Gerontol A Biol Sci Med Sci. 2008 Nov;63(11):1209-18.

Davey A, Lele U, Elias MF, Dore GA, Siegler IC, Johnson MA, Hausman DB, Tenover JL, Poon LW; Georgia Centenarian Study. Diabetes mellitus in centenarians. J Am Geriatr Soc. 2012 Mar;60(3):468-73.

Kunutsor SK, Apekey TA, Seddoh D, Walley J. Liver enzymes and risk of all-cause mortality in general populations: a systematic review and meta-analysis. Int J Epidemiol. 2014 Feb;43(1):187-201.

Lê KA, Ith M, Kreis R, Faeh D, Bortolotti M, Tran C, Boesch C, Tappy L. Fructose overconsumption causes dyslipidemia and ectopic lipid deposition in healthy subjects with and without a family history of type 2 diabetes. Am J Clin Nutr. 2009 Jun;89(6):1760-5.

Lio D, Malaguarnera M, Maugeri D, Ferlito L, Bennati E, Scola L, Motta M, Caruso C. Laboratory parameters in centenarians of Italian ancestry. Exp Gerontol. 2008 Feb;43(2):119-22.

Mazzanti G, Menniti-Ippolito F, Moro PA, Cassetti F, Raschetti R, Santuccio C, Mastrangelo S. Hepatotoxicity from green tea: a review of the literature and two unpublished cases. Eur J Clin Pharmacol. 2009 Apr;65(4):331-41.

Perez-Pozo SE, Schold J, Nakagawa T, Sánchez-Lozada LG, Johnson RJ, Lillo JL. Excessive fructose intake induces the features of metabolic syndrome in healthy adult men: role of uric acid in the hypertensive response. Int J Obes (Lond). 2010 Mar;34(3):454-61.

Willcox DC, Willcox BJ, Wang NC, He Q, Rosenbaum M, Suzuki M. Life at the extreme limit: phenotypic characteristics of supercentenarians in OkinawaJ Gerontol A Biol Sci Med Sci. 2008 Nov;63(11):1201-8.

Vasto S, Scapagnini G, Rizzo C, Monastero R, Marchese A, Caruso C. Mediterranean diet and longevity in Sicily: survey in a Sicani Mountains population. Rejuvenation Res. 2012 Apr;15(2):184-8.

Blood testing: What’s optimal for WBC levels?

My approach towards optimal health involves yearly blood testing and tracking my results to catch changes before they become problematic. In this article, I will evaluate the published literature to propose an optimal range for circulating white blood cells (WBC).

Why is measuring WBCs important? Briefly, circulating WBCs are correlated with inflammation- inflammation increases during aging, is associated with decreased function of multiple organ systems, and is associated with an increased chronic disease risk (Cevenini et al. 2013).

As shown below, Huang et al. (2007) reported significant correlations between circulating WBCs with a marker of inflammation, C-reactive protein (CRP). This correlation was statistically significant in the whole population (14,114 subjects), in subjects older than or less than 50 years, and separately in men and women.

crp wbc

Based on that data, Huang et al. (2007) suggested changing the reference range (8 years ago!) for WBCs from 4-11 to 3.11-8.83 K/mm3. But within that range, what’s optimal for health and longevity? Because WBC are elevated in association with inflammation, the hypothesis would be that the lower end of the range is better, with values ~4 being optimal. Is this true?

Several studies have reported that WBC values greater than 5 are associated with an increased all-cause mortality risk (Ahmadi-Abhari et al. 2013, Samet et al. 2005, Weijenberg et al. 1996). However, the best evidence for the association between WBCs with mortality risk comes from the Baltimore Longitudinal Study on Aging (BLSA), which studied 2803 men and women over a period of 44 years (Ruggiero et al. 2007). As shown below, subjects that had circulating WBC between 3.5 and 6 had decreased mortality risk, whereas below 3.5, between 6-10, and 10+ each had successively higher risk. The 0.5 point on the y-axis of the curve (survival) is defined as 50% mortality, where half of the study subjects have died. At that point, compared with subjects with WBC values between 6-10, people with values between 3.5 and 6 live ~7 years longer! So getting your WBC into that range may be a big deal for living significantly longer.

wbc ferr

How can you reduce circulating WBCs? One way to reduce WBCs is to eat less calories, thereby reducing your body weight. As shown below, eating less calories resulted in decreased BMI and decreased WBCs in the Biosphere II project (Walford et al. 2002), almost exactly in the same pattern:

cr bmi

WBC Biosphere

Because calorie restriction reduced WBCs from ~6.8 to 4.6, should 4.6 be considered optimal? In support of this idea, calorie restriction is well documented to increase lifespan in a variety of organisms, including flies, worms, and rodents. Although there isn’t any evidence on the long-term effects of calorie restriction (CR) on lifespan in people, it has been shown to be protective against age-related diseases, including abdominal obesity, diabetes, hypertension, and cardiovascular disease (Omodei and Fontana 2011). Therefore, a reduced WBC level may be related to the positive health-related effects of CR. 

As an argument against using the CR-mediated reduction in WBC as a guide for what the optimal range should be, calorically restricted mice have decreased infection-related survival (Goldberg et al. 2015):

cr survival

However, it’s important to note that infection-related survival was decreased in adult CR mice that were 40% restricted in terms of daily calories. Based on the Biosphere 2 data above, BMI was reduced from ~23 to 19, which translates into an ~18% reduction in BMI. However, whether 18% CR is better for improving infection-related survival compared with 40% CR is currently unknown.

What’s my WBC level? My lowest WBC value was in 2008, at 3.9. In 4 measurements from 2008-2013 my WBC increased to 4.4, 4.6, 5.7, and 5.9. However, in my most recent blood test, they’re back down to 4.4. I have 2 possible explanations for reducing my age-related increase in WBCs. First, my body weight weight is ~10 lbs less since last year,  and my 100g+ fiber diet may improve gut barrier function to keep bacteria and other stuff out of my blood that shouldn’t be there, thereby decreasing my systemic immune response.

wbc

My recent 4.4 WBC value puts me close to the CR-value (4.6), and within the optimal 3.5-6 range identified in the BLSA study. So far so good! Stay tuned for the data next year to see if my WBCs remain low or start to rise again.

If you’re interested, please have a look at my book!

References

Ahmadi-Abhari S, Luben RN, Wareham NJ, Khaw KT. Seventeen year risk of all-cause and cause-specific mortality associated with C-reactive proteinfibrinogen and leukocyte count in men and women: the EPIC-Norfolk studyEur J Epidemiol. 2013 Jul;28(7):541-50.

Cevenini E, Caruso C, Candore G, Capri M, Nuzzo D, Duro G, Rizzo C, Colonna-Romano G, Lio D, Di Carlo D, Palmas MG, Scurti M, Pini E, Franceschi C, Vasto S. Age-related inflammation: the contribution of different organs, tissues and systems. How to face it for therapeutic approaches. Curr Pharm Des. 2010;16(6):609-18.

Goldberg EL, Romero-Aleshire MJ, Renkema KR, Ventevogel MS, Chew WM, Uhrlaub JL, Smithey MJ, Limesand KH, Sempowski GD, Brooks HL, Nikolich-Žugich J. Lifespan-extending caloric restriction or mTOR inhibition impair adaptive immunity of old mice by distinct mechanisms. Aging Cell. 2015 Feb;14(1):130-8.

Huang ZS, Lo SC, Tsay W, Hsu KL, Chiang FT. Revision in referene ranges of peripheral total leukocyte count and differential leukocyte percentages based on a normal serum C-reactive protein level. J Formos Med Assoc. 2007 Aug;106(8):608-16.

Jee SH, Park JY, Kim HS, Lee TY, Samet JM. White blood cell count and risk for all-causecardiovascular, and cancer mortality in a cohort of KoreansAm J Epidemiol. 2005 Dec 1;162(11):1062-9.

Omodei D, Fontana L. Calorie restriction and prevention of age-associated chronic diseaseFEBS Lett. 2011 Jun 6;585(11):1537-42.

Ruggiero C, Metter EJ, Cherubini A, Maggio M, Sen R, Najjar SS, Windham GB, Ble A, Senin U, Ferrucci L. White blood cell count and mortality in the Baltimore Longitudinal Study of AgingJ Am Coll Cardiol. 2007 May 8;49(18):1841-50.

Walford RL, Mock D, Verdery R, MacCallum T. Calorie restriction in biosphere 2: alterations in physiologic, hematologic, hormonal, and biochemical parameters in humans restricted for a 2-year period. J Gerontol A Biol Sci Med Sci. 2002 Jun;57(6):B211-24.

Weijenberg MP, Feskens EJ, Kromhout D. White blood cell count and the risk of coronary heart disease and all-cause mortality in elderly menArterioscler Thromb Vasc Biol. 1996 Apr;16(4):499-503.

On a Paleo Diet? Not if your fiber intake is less than…

Do you think Paleo diets involve eating mostly meat? While how much meat was eaten in that era is debatable, what is known is that they ate a lot of high-fiber fruits and vegetables. Shown below are the estimated daily fiber and energy intake (Eaton et al. 1997). On a 3000 calorie diet it’s estimated that those who lived in the Paleo era consumed 104 g fiber/day. That translates into 3.3 g fiber per 100 calories.

paleo fiber

Do you consider yourself a Paleo eater? If so, do you get that much fiber? For example, I average 2200 calories per day. Based on the estimated Paleo fiber intake of 3.3g fiber/100 calories, I should average 66g or more dietary fiber per day. As shown below, my 7-day average for fiber intake is 94g/day.

myfiber

If you’re interested, please have a look at my book!

Reference:

Eaton SB, Eaton SB 3rd, Konner MJ. Paleolithic nutrition revisited: A twelve-year retrospective on its nature and implications. Eur J Clin Nutr. 1997 Apr;51(4):207-16.

In search of optimal nutrient density: veggies or whole grains?

In previous articles I’ve written about the heath benefits of eating whole grains, which have been shown in large epidemiological studies to be associated with reduced all-cause mortality risk. Based on this data, the USDA’s MyPlate recommends a minimum of 3.5 oz, up to 7 oz. of whole grains on a 2200 calorie diet. 3.5 servings of barley yields 350 calories, whereas 7 oz. yields 700. In terms of percentage of total calories, MyPlate recommends that 16-32% of daily calories should come from whole grains.

In terms of vegetables, MyPlate’s recommendations are shown below. They recommend 3 servings of vegetables per day, with these amounts varied between green vegetables (and other vegetables), red and orange vegetables, beans and peas, and starchy vegetables. For ease of calculation I grouped ‘other vegetables’ with green vegetables. Based on the recommended weekly servings for each group and representative foods, I calculated weekly calorie amounts for each group. Average veggie calories per day = 187. Divided by 2200 calories, that equals 8.5% of total calories.

myplate

So clearly MyPlate wants us to eat between 2-4 fold more whole grains than veggies, in terms of total daily calories, but why is that? In a meta-analysis of 7 studies including 660,186 subjects, increased vegetable consumption is also associated with reduced mortality risk, as shown below:

veg mortality

Maybe whole grains are superior to veggies in terms of nutrient density? To see if that’s true, in the Table below I compared the nutrient composition of broccoli, spinach and romaine lettuce against barley (the king of grains for fiber), whole wheat spaghetti and oats. How do they compare in terms of macronutrients, when each has 100 calories? First, it should be obvious that to get 100 calories of veggies (see the serving column), you will eat significantly more food. To most, this will seem like a bad thing. But more chewing for the same amount of calories may end up in eating less, an important fact because of the worldwide explosion in obesity rates. Second, each of these veggies have 2-3 fold more protein and 3-4 fold more fiber than than whole grains. So far, veggies are far superior to whole grains.

vegc1

What about vitamin content? As shown below, veggies crush whole grains for vitamin content. Whole grains are not better than veggies in terms of vitamin content for any category.

vegc vitamins

Maybe mineral content is better in whole grains? As shown below, they’re not. Veggies are much better in 9/10 mineral categories, with whole grains having marginally more selenium than veggies.

vegc miner

Based on these data, I have now dramatically increased my daily vegetable intake, while reducing my whole grain intake. Shown below is a snapshot of today’s veggie (and some other foods, too) intake, and it’s also important to mention that this amount is now representative of my daily vegetable intake. I haven’t eliminated whole grains, only minimized them.

veggies cal

My total veggie intake between carrots, beets, green peas, corn, asparagus and 1 pickle spear is 50.6 oz, or 1416 grams. Considering that 1 serving of vegetables = 80g, I ate 17.7 servings of veggies today. That amount is almost equal to what MyPlate recommends to eat in 1 week!

If you’re interested, please have a look at my book!

References:

Nutrition data from ndb.nal.usda.gov

Wang X, Ouyang Y, Liu J, Zhu M, Zhao G, Bao W, Hu FB. Fruit and vegetable consumption and mortality from all causescardiovascular disease, and cancersystematic review and dose-response meta-analysis of prospective cohort studiesBMJ. 2014 Jul 29;349:g4490.

Selenium: Dietary Intake And Plasma Values, What’s Optimal For Health?

How much selenium is optimal for health? To address this question, I’ll examine the association between circulating levels of selenium with all-cause mortality risk. Then, I’ll identify a dietary selenium intake that corresponds to optimal plasma selenium levels. Let’s have a look!

A variety of studies have investigated associations between plasma (or serum) selenium with risk of death from all causes:

In a 9-year study of 1,389 older adults (average age, 65y) plasma selenium values less than 1.09 micromolar (uM) were associated with significantly increased all-cause mortality risk, when compared with values greater than 1.22 uM (Akbaraly et al 2005):

se mort2

In a 6-year study of 1,042 older adults (average age, 76y), plasma selenium values less than 0.83 um were associated with significantly increased all-cause mortality risk, when compared with values greater than 1.0 uM (Lauretani et al. 2008):

semort3

In a 5-year study of 632 older women (average age, 74y), serum selenium values less than 1.38 uM were associated with significantly increased all-cause mortality risk, when compared with the other 3 quartiles (1.38 to 1.52, 1.53 to 1.67, and >1.68 uM; Ray et al. 2006):

se mort ray

In a 12-year study of 13,887 middle aged adults (average age, 45y), serum selenium values between 130-150 ng/mL (equivalent to 1.65-1.9 uM) were  associated with reduced all-cause mortality risk (Bleys et al. 2006). Increased mortality risk was associated with serum selenium values less than 1.3 uM (~102 ng/mL):

sel bayes

These data were confirmed in the same cohort (16,008 adults) that were followed for an additional 2 years (14 years total; Goyal  et al. 2013). Baseline serum selenium values greater than 1.4 uM were associated with significantly reduced all-cause mortality risk, compared with values less than1.38 uM.

Finally, in a 13-year study of 1,054 older adults (average age ~76y), elevated plasma levels of selenium (risk ratios were reported without the corresponding selenium concentration) were associated with significantly decreased all-cause mortality risk (Bates et al. 2011).

Studies that show weaker or no association between circulating values of selenium with all-cause mortality risk include Gonzalez et al. (2007) and Wei et al. (2004). In Gonzalez et al. (2007), serum selenium values greater than 1.26 uM were associated with decreased all-cause mortality risk for older women (average age, 76y), but not men, during a 4-year follow-up. However, Gonzalez et al. (2007) may have been underpowered to detect significant associations with mortality risk because of the small study size (215 total subjects). In Wei et al. (2004), a younger cohort (average age, 56y) of 1,115 subjects were followed for 15 years, and no association between serum selenium with all-cause mortality was found. However, only 4% of the population (~46 subjects) had serum selenium values greater than 1.19 uM, a finding that suggests that this study was additionally  under-sized to detect significant associations.

Collectively, these studies suggest that circulating selenium values greater than at least 1.0 uM (and up to ~1.9 uM) are optimal for reducing all-cause mortality risk. What dietary intake of selenium can achieve these circulating values?

Shown below is the correlation between dietary selenium with serum selenium in 205 older adults (average age ~75y; González et al. 2006). Let’s start with the RDA selenium value for adults older than 19 years, 55 micrograms (mcg; Institute of Medicine, 2000). 55 mcg of dietary selenium is correlated with a serum selenium value of ~80 ug/L (~1 uM). In support of this correlation, a dietary selenium intake of ~47 ug/day has been shown to correlate with a circulating selenium concentration of 0.95 uM (Navarro et al. 1995). Based on the evidence already presented, eating only the RDA for selenium and achieving circulating selenium values less 1 uM would be associated with increased risk of death from all causes in 6 of the 7 studies! Based on its association with all-cause mortality risk, the RDA selenium value of 55 mcg/day is too low.

dietary se and ser

Determining which dietary selenium intake is optimal for maximally reduced all-cause mortality risk depends on how you interpret the literature. Four of previously mentioned studies showed circulating selenium values greater than 1.2 uM (95 ug/L) to be associated with reduced all-cause mortality risk. Based on the plot of González et al. (2006), ~130 ug of dietary selenium is necessary to achieve a circulating selenium concentration of 1.2 uM. Three studies showed decreased all-cause mortality risk at circulating selenium levels > 1.38 uM (110 ug/L). The dietary selenium intake that corresponds to that concentration is ~180 ug of selenium/day. Accordingly, a dietary selenium intake between 130-180 ug/day may be optimal for reducing all-cause mortality risk.

Which foods are selenium rich? Brazil nuts are the best dietary source of selenium, as 1 Brazil nut (4 g) contains 77 mcg of selenium (http://ndb.nal.usda.gov/ndb/foods/show/3641?fg=&man=&lfacet=&count=&max=&qlookup=&offset=&sort=&format=Full&reportfmt=other&rptfrm=&ndbno=&nutrient1=&nutrient2=&nutrient3=&subset=&totCount=&measureby=&_action_show=Apply+Changes&Qv=.04&Q6825=1&Q6826=1&Q6827=1). To achieve a dietary selenium intake between 130-180 mcg/day, every day I eat 1 or 2 Brazil nuts. It’s important to note that selenium toxicity can occur at intakes ~400 mcg (Food and Nutrition Board 2000), so keeping an eye on Brazil nut intake is probably a good idea.

If you’re interested, please have a look at my book!

References:

Akbaraly NT, Arnaud J, Hininger-Favier I, Gourlet V, Roussel AM, Berr C. Selenium and mortality in the elderly: results from the EVA study. Clin Chem. 2005 Nov;51(11):2117-23.

Bates CJ, Hamer M, Mishra GD. Redox-modulatory vitamins and minerals that prospectively predict mortality in older British people: the National Diet and Nutrition Survey of people aged 65 years and over. Br J Nutr. 2011 Jan;105(1):123-32.

Bleys J, Navas-Acien A, Guallar E.Serum selenium levels and all-cause, cancer, and cardiovascular mortality among US adults. Arch Intern Med. 2008 Feb 25;168(4):404-10.

Broome CS, McArdle F, Kyle JA, Andrews F, Lowe NM, Hart CA, Arthur JR, Jackson MJ. An increase in selenium intake improves immune function and poliovirus handling inadults with marginal selenium statusAm J Clin Nutr. 2004 Jul;80(1):154-62.

Food and Nutrition Board, Institute of Medicine. Selenium. Dietary reference intakes for vitamin C, vitamin E, selenium, and carotenoids. Washington, D.C.: National Academy Press; 2000:284-324.

González S, Huerta JM, Fernández S, Patterson EM, Lasheras C. Food intake and serum selenium concentration in elderly people.Ann Nutr Metab. 2006;50(2):126-31.

González S, Huerta JM, Fernández S, Patterson AM, Lasheras C. Homocysteine increases the risk of mortality in elderly individuals. Br J Nutr. 2007; 97:1138–1143.

Goyal A, Terry MB, Siegel AB. Serum antioxidant nutrients, vitamin A, and mortality in U.S. adults. Cancer Epidemiol Biomarkers Prev. 2013 Dec;22(12):2202-11.

Hurst R, Armah CN, Dainty JR, Hart DJ, Teucher B, Goldson AJ, Broadley MR, Motley AK, Fairweather-Tait SJ. Establishing optimal selenium status: results of a randomized, double-blind, placebo-controlled trialAm J Clin Nutr. 2010 Apr;91(4):923-31.

Institute of Medicine. Food and Nutrition Board. Dietary Reference Intakes for Vitamin C, Vitamin E, Selenium, and Carotenoids. Washington, DC: National Academy Press, 2000.

Lauretani F, Semba RD, Bandinelli S, Ray AL, Ruggiero C, Cherubini A, Guralnik JM, Ferrucci L. Low plasma selenium concentrations and mortality among older community-dwelling adults: the InCHIANTI Study. Aging Clin Exp Res. 2008 Apr;20(2):153-8.

Navarro M, López H, Ruiz ML, González S, Pérez V, López MC. Determination of selenium in serum by hydride generation atomic absorption spectrometry for calculation of daily dietary intake. Sci Total Environ. 1995 Dec 15;175(3):245-52.

Ray AL, Semba RD, Walston J, Ferrucci L, Cappola AR, Ricks MO, Xue QL, Fried LP. Low serum selenium and total carotenoids predict mortality among older women living in the community: the women’s health and aging studies. J Nutr. 2006 Jan;136(1):172-6.

Swanson CA, Longnecker MP, Veillon C, Howe M, Levander OA, Taylor PR, McAdam PA, Brown CC, Stampfer MJ, Willett WC. Selenium intake, age, gender, and smoking in relation to indices of selenium status of adults residing in a seleniferous area. Am J Clin Nutr. 1990 Nov;52(5):858-62.

Wei WQ, Abnet CC, Qiao YL, Dawsey SM, Dong ZW, Sun XD, Fan JH, Gunter EW, Taylor PR, Mark SD. Prospective study of serum selenium concentrations and esophageal and gastric cardia cancer, heart disease, stroke, and total death. Am J Clin Nutr. 2004 Jan;79(1):80-5.

BMI: What’s Optimal For Longevity?

Is there a BMI that is associated with maximally reduced risk of death from all causes? Let’s have a look at the data!

In a meta-analysis of 19 studies that included 1,460,000 adults (median age, 58 years) a BMI between 20-25 kg/m2 was associated with maximally reduced all-cause mortality risk (Berrington de Gonzalez et al. 2010):

both gend nonsmok bmi mort

However, in a meta-analysis of 32 studies that included 197,140 older adults (65 years+), a BMI between 24 and 31 kg/m2 was associated with maximally reduced all-cause mortality risk (Winter et al. 2014). More specifically, a BMI between 26-26.9 kg/m2 was associated with maximally reduced all-cause mortality risk for never-smokers (Winter et al. 2014):

acm 65

So what’s optimal for longevity in terms of BMI, is it 20-25 kg/m2, or potentially higher, as reported in older adults? For additional insight about the association between BMI with all-cause mortality, I looked up the published BMI data for centenarians:

bmi cent

In these 11 studies that included 1075 centenarians, the BMI range was between 19.3-24.4 kg/m2, with an average BMI of 21.8. Shouldn’t that be the BMI reference range for those interested in living past 100?

If you’re interested, please have a look at my book!


References

Arai Y, Hirose N, Yamamura K, Shimizu K, Takayama M, Ebihara Y, Osono Y. Serum insulin-like growth factor-1 in centenarians: implications of IGF-1 as a rapid turnover protein. J Gerontol A Biol Sci Med Sci. 2001 Feb;56(2):M79-82.

Arai Y, Takayama M, Gondo Y, Inagaki H, Yamamura K, Nakazawa S, Kojima T, Ebihara Y, Shimizu K, Masui Y, Kitagawa K, Takebayashi T, Hirose N. Adipose endocrine function, insulin-like growth factor-1 axis, and exceptional survival beyond 100 years of age. J Gerontol A Biol Sci Med Sci. 2008 Nov;63(11):1209-18.

Baranowska B, Bik W, Baranowska-Bik A, Wolinska-Witort E, Szybinska A, Martynska L, Chmielowska M. Neuroendocrine control of metabolic homeostasis in Polish centenarians. J Physiol Pharmacol. 2006 Nov;57 Suppl 6:55-61.

Barzilai N, Atzmon G, Schechter C, Schaefer EJ, Cupples AL, Lipton R, Cheng S, Shuldiner AR. Unique lipoprotein phenotype and genotype associated with exceptional longevity. JAMA 2003;290:2030–40.

Berrington de Gonzalez A, Hartge P, Cerhan JR, Flint AJ, Hannan L, MacInnis RJ, Moore SC, Tobias GS, Anton-Culver H, Freeman LB, Beeson WL, Clipp SL, English DR, Folsom AR, Freedman DM, Giles G, Hakansson N, Henderson KD, Hoffman-Bolton J, Hoppin JA, Koenig KL, Lee IM, Linet MS, Park Y, Pocobelli G, Schatzkin A, Sesso HD, Weiderpass E, Willcox BJ, Wolk A, Zeleniuch-Jacquotte A, Willett WC, Thun MJ. Body-mass index and mortality among 1.46 million white adults. N Engl J Med. 2010 Dec 2;363(23):2211-9. doi: 10.1056/NEJMoa1000367. Erratum in: N Engl J Med. 2011 Sep 1;365(9):869.

Bik W, Baranowska-Bik A, Wolinska-Witort E, Kalisz M, Broczek K, Mossakowska M, Baranowska B. Assessment of adiponectin and its isoforms in Polish centenarians. Exp Gerontol. 2013 Apr;48(4):401-7.

Chan YC, Suzuki M, Yamamoto S. Dietary, anthropometric, hematological and biochemical assessment of the nutritional status of centenarians and elderly people in Okinawa, Japan. J Am Coll Nutr. 1997 Jun;16(3):229-35.

Hausman DB, Johnson MA, Davey A, Poon LW. Body mass index is associated with dietary patterns and health conditions in georgia centenarians. J Aging Res. 2011;2011:138015.

Magri F, Muzzoni B, Cravello L, Fioravanti M, Busconi L, Camozzi D, Vignati G, Ferrari E. Thyroid function in physiological aging and in centenarians: possible relationships with some nutritional markers. Metabolism. 2002 Jan;51(1):105-9.

Montoliu I, Scherer M, Beguelin F, DaSilva L, Mari D, Salvioli S, Martin FP, Capri M, Bucci L, Ostan R, Garagnani P, Monti D, Biagi E, Brigidi P, Kussmann M, Rezzi S, Franceschi C, Collino S. Serum profiling of healthy aging identifies phospho- and sphingolipid species as markers of human longevity. Aging (Albany NY). 2014 Jan;6(1):9-25.

Paolisso G, Ammendola S, Del Buono A, Gambardella A, Riondino M, Tagliamonte MR, Rizzo MR, Carella C, Varricchio M. Serum levels of insulin-like growth factor-I (IGF-I) and IGF-binding protein-3 in healthy centenarians: relationship with plasma leptin and lipid concentrations, insulin action, and cognitive function. J Clin Endocrinol Metab. 1997 Jul;82(7):2204-9.

Vasto S, Scapagnini G, Rizzo C, Monastero R, Marchese A, Caruso C. Mediterranean diet and longevity in Sicily: survey in a Sicani Mountains population. Rejuvenation Res. 2012 Apr;15(2):184-8.

Winter JE, MacInnis RJ, Wattanapenpaiboon N, Nowson CA. BMI and all-cause mortality in older adults: a meta-analysisAm J Clin Nutr. 2014 Apr;99(4):875-90.

Eat more green leafy vegetables, reduce mortality risk?

Vitamin K is found in 2 predominant forms, Vitamin K1 (phylloquinone), found almost exclusively in green leafy vegetables, and Vitamin K2 (Menaquinone), found in fermented foods, organ meats, meat, butter and eggs. In the data below (Juanola-Falgarona et al. 2014), we see that Vitamin K1 (phylloquinone) is negatively associated with death from all causes:

all cause mortl phylo

Death from all causes was assessed based on the average value for four groups of Vitamin K1 intake: 171 ug/day = blue line, 276 ug/day =red line, 349 ug/day = green line and 626 ug/day = the yellow line. In the data above, Vitamin K1 values less than 349 ug/day are about the same in terms of all-cause mortality risk. However, those who ate 626 ug/day of Vitamin K1 had about half of the mortality risk compared to the lower K1 intake groups! Interestingly, the RDA for Vitamin K, at 90 ug/day seems to be outdated, based on the data above. Also, Vitamin K2 was not associated with all-cause mortality risk, as shown below:

k2 all cause

Based on the K1 mortality data, 626 ug/day seems like a good goal. However, osteocalcin is a Vitamin K-dependent protein that has been shown to be maximally active in the presence of 1000 ug of Vitamin K1 (Binkley et al. 2002)! Osteocalcin is involved in pathways that decline with aging: insulin secretion and β-cell proliferation in the pancreas, energy expenditure by muscle, insulin sensitivity in adipose tissue, muscle and liver, and increased testosterone production (Karsenty and Ferron 2012). Therefore, getting 1000 ug+ per day of Vitamin K1 may optimize all of these functions and, decrease mortality risk!

What’s the take home from these data? Eat more leafy greens! How much is needed to get 1000 ug  per day? Shown below is a short list of foods rich in Vitamin K and the serving size needed to reach 1000 ug. Approximately 4 ounces of cooked kale or 7 oz. of raw spinach will suffice, and at a low calorie yield. Other foods, like broccoli, brussel sprouts or romaine lettuce would need to be consumed in far greater amounts to reach 1000 ug.

k osteo

What’s my daily K1 intake? Shown below is my 7-day average (7/16/2015 – 7/22/2015) for K intake, derived almost exclusively from plant sources. 1379 ug/day puts me well above the 626 ug/day that was associated with reduced mortality risk, and above the 1000 ug/day needed for maximal osteocalcin activation.

my k intake

If you’re interested, please have a look at my book!


References:

Binkley NC, Krueger DC, Kawahara TN, Engelke JA, Chappell RJ, Suttie JW. A high phylloquinone intake is required to achieve maximal osteocalcin gamma-carboxylation. Am J Clin Nutr. 2002 Nov;76(5):1055-60.

Juanola-Falgarona M, Salas-Salvadó J, Martínez-González MÁ, Corella D, Ostrich R, Ros E, Fitó M, Arós F, Gómez-Gracia E, Fiol M, Lapetra J, Basora J, Lamuela-Raventós RM, Serra-Majem L, Pintó X, Muñoz MÁ, Ruiz-Gutiérrez V, Fernández-Ballart J, Bulló M. Dietary intake of vitamin K is inversely associated with mortality risk. J Nutr. 2014 May;144(5):743-50.

Karsenty G, Ferron M. The contribution of bone to whole-organism physiologyNature. 2012 Jan 18;481(7381):314-20.

Inhibit myostatin with chocolate, increase muscle mass?

Mice that don’t have myostatin have dramatically increased muscle mass:

MyostatinMs

Myostatin levels increase during aging, a finding that may (at least partially) explain age-related decreases in muscle mass (Basaria and Bhasin 2012). Is there anything that we can do besides strength-training (Snijders et. al 2014) to decrease myostatin levels?

To address this question, Gutierrez-Salmean and colleagues (2014) supplemented young and old mice and humans (29 vs. 62y) with epicatechin, which is found in may foods (see the Table below). They found that in both mice and humans, myostatin increased during aging. However, epicatechin supplementation decreased muscle myostatin levels in both young and old mice and humans! Although they did not report how muscle mass changed as a result of epicatechin supplementation, grip strength significantly improved after only 7 days of supplementation in the older adults. Although this study had a relatively small sample size (20 total subjects), that a food component can reduce myostatin levels is an interesting finding.

So, which foods are rich in epicatechin?

Atop the list are cocoa containing products. It is important to note that 50mg/day of epicatechin were provided to the human volunteers of the Gutierrez-Salmean study. Obtaining 50mg of epicatechin may be relatively easy, if one chooses wisely from the foods listed in the Table, which are listed in mg/gram food, but should be listed as mg/100 grams of food (sorry about the mistake!). For example, drinking 20 ounces of white, black or green tea would yield 10-46mg of epicatechin. Homemade chocolate (https://atomic-temporary-71218033.wpcomstaging.com/2014/09/21/homemade-chocolate-in-2-minutes/) containing 1 ounce of cacao beans yields ~27 mg of epicatechin.

epicatechin foods table

If you’re interested, please have a look at my book!

References:

Epicatechin data: http://www.ars.usda.gov/SP2UserFiles/Place/80400525/Data/Flav/Flav_R03.pdf

Basaria S, Bhasin S. Targeting the skeletal muscle-metabolism axis in prostate-cancer therapy. N Engl J Med. 2012; 367:965–967.

Gutierrez-Salmean G, Ciaraldi TP, Nogueira L, Barboza J, Taub PR, Hogan MC, Henry RR, Meaney E, Villarreal F, Ceballos G, Ramirez-Sanchez I. Effects of (-)-epicatechin on molecular modulators of skeletal muscle growth and differentiation. J Nutr Biochem. 2014 Jan;25(1):91-4.

Snijders T, Verdijk LB, Smeets JS, McKay BR, Senden JM, Hartgens F, Parise G, Greenhaff P, van Loon LJ. The skeletal muscle satellite cell response to a single bout of resistance-type exercise is delayed with aging in men. Age (Dordr). 2014;36(4):9699.