Tag Archives: mortality

Selenium: Dietary Intake And Plasma Values, What’s Optimal For Health?

How much selenium is optimal for health? To address this question, I’ll examine the association between circulating levels of selenium with all-cause mortality risk. Then, I’ll identify a dietary selenium intake that corresponds to optimal plasma selenium levels. Let’s have a look!

A variety of studies have investigated associations between plasma (or serum) selenium with risk of death from all causes:

In a 9-year study of 1,389 older adults (average age, 65y) plasma selenium values less than 1.09 micromolar (uM) were associated with significantly increased all-cause mortality risk, when compared with values greater than 1.22 uM (Akbaraly et al 2005):

se mort2

In a 6-year study of 1,042 older adults (average age, 76y), plasma selenium values less than 0.83 um were associated with significantly increased all-cause mortality risk, when compared with values greater than 1.0 uM (Lauretani et al. 2008):

semort3

In a 5-year study of 632 older women (average age, 74y), serum selenium values less than 1.38 uM were associated with significantly increased all-cause mortality risk, when compared with the other 3 quartiles (1.38 to 1.52, 1.53 to 1.67, and >1.68 uM; Ray et al. 2006):

se mort ray

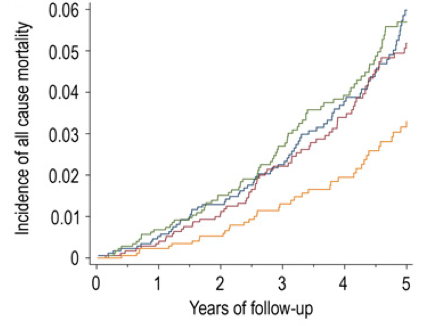
In a 12-year study of 13,887 middle aged adults (average age, 45y), serum selenium values between 130-150 ng/mL (equivalent to 1.65-1.9 uM) were  associated with reduced all-cause mortality risk (Bleys et al. 2006). Increased mortality risk was associated with serum selenium values less than 1.3 uM (~102 ng/mL):

sel bayes

These data were confirmed in the same cohort (16,008 adults) that were followed for an additional 2 years (14 years total; Goyal  et al. 2013). Baseline serum selenium values greater than 1.4 uM were associated with significantly reduced all-cause mortality risk, compared with values less than1.38 uM.

Finally, in a 13-year study of 1,054 older adults (average age ~76y), elevated plasma levels of selenium (risk ratios were reported without the corresponding selenium concentration) were associated with significantly decreased all-cause mortality risk (Bates et al. 2011).

Studies that show weaker or no association between circulating values of selenium with all-cause mortality risk include Gonzalez et al. (2007) and Wei et al. (2004). In Gonzalez et al. (2007), serum selenium values greater than 1.26 uM were associated with decreased all-cause mortality risk for older women (average age, 76y), but not men, during a 4-year follow-up. However, Gonzalez et al. (2007) may have been underpowered to detect significant associations with mortality risk because of the small study size (215 total subjects). In Wei et al. (2004), a younger cohort (average age, 56y) of 1,115 subjects were followed for 15 years, and no association between serum selenium with all-cause mortality was found. However, only 4% of the population (~46 subjects) had serum selenium values greater than 1.19 uM, a finding that suggests that this study was additionally  under-sized to detect significant associations.

Collectively, these studies suggest that circulating selenium values greater than at least 1.0 uM (and up to ~1.9 uM) are optimal for reducing all-cause mortality risk. What dietary intake of selenium can achieve these circulating values?

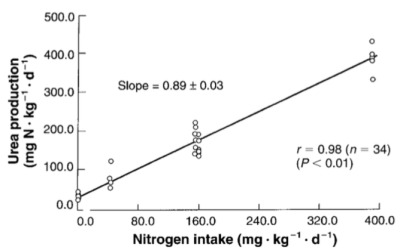
Shown below is the correlation between dietary selenium with serum selenium in 205 older adults (average age ~75y; González et al. 2006). Let’s start with the RDA selenium value for adults older than 19 years, 55 micrograms (mcg; Institute of Medicine, 2000). 55 mcg of dietary selenium is correlated with a serum selenium value of ~80 ug/L (~1 uM). In support of this correlation, a dietary selenium intake of ~47 ug/day has been shown to correlate with a circulating selenium concentration of 0.95 uM (Navarro et al. 1995). Based on the evidence already presented, eating only the RDA for selenium and achieving circulating selenium values less 1 uM would be associated with increased risk of death from all causes in 6 of the 7 studies! Based on its association with all-cause mortality risk, the RDA selenium value of 55 mcg/day is too low.

dietary se and ser

Determining which dietary selenium intake is optimal for maximally reduced all-cause mortality risk depends on how you interpret the literature. Four of previously mentioned studies showed circulating selenium values greater than 1.2 uM (95 ug/L) to be associated with reduced all-cause mortality risk. Based on the plot of González et al. (2006), ~130 ug of dietary selenium is necessary to achieve a circulating selenium concentration of 1.2 uM. Three studies showed decreased all-cause mortality risk at circulating selenium levels > 1.38 uM (110 ug/L). The dietary selenium intake that corresponds to that concentration is ~180 ug of selenium/day. Accordingly, a dietary selenium intake between 130-180 ug/day may be optimal for reducing all-cause mortality risk.

Which foods are selenium rich? Brazil nuts are the best dietary source of selenium, as 1 Brazil nut (4 g) contains 77 mcg of selenium (http://ndb.nal.usda.gov/ndb/foods/show/3641?fg=&man=&lfacet=&count=&max=&qlookup=&offset=&sort=&format=Full&reportfmt=other&rptfrm=&ndbno=&nutrient1=&nutrient2=&nutrient3=&subset=&totCount=&measureby=&_action_show=Apply+Changes&Qv=.04&Q6825=1&Q6826=1&Q6827=1). To achieve a dietary selenium intake between 130-180 mcg/day, every day I eat 1 or 2 Brazil nuts. It’s important to note that selenium toxicity can occur at intakes ~400 mcg (Food and Nutrition Board 2000), so keeping an eye on Brazil nut intake is probably a good idea.

If you’re interested, please have a look at my book!

References:

Akbaraly NT, Arnaud J, Hininger-Favier I, Gourlet V, Roussel AM, Berr C. Selenium and mortality in the elderly: results from the EVA study. Clin Chem. 2005 Nov;51(11):2117-23.

Bates CJ, Hamer M, Mishra GD. Redox-modulatory vitamins and minerals that prospectively predict mortality in older British people: the National Diet and Nutrition Survey of people aged 65 years and over. Br J Nutr. 2011 Jan;105(1):123-32.

Bleys J, Navas-Acien A, Guallar E.Serum selenium levels and all-cause, cancer, and cardiovascular mortality among US adults. Arch Intern Med. 2008 Feb 25;168(4):404-10.

Broome CS, McArdle F, Kyle JA, Andrews F, Lowe NM, Hart CA, Arthur JR, Jackson MJ. An increase in selenium intake improves immune function and poliovirus handling inadults with marginal selenium statusAm J Clin Nutr. 2004 Jul;80(1):154-62.

Food and Nutrition Board, Institute of Medicine. Selenium. Dietary reference intakes for vitamin C, vitamin E, selenium, and carotenoids. Washington, D.C.: National Academy Press; 2000:284-324.

González S, Huerta JM, Fernández S, Patterson EM, Lasheras C. Food intake and serum selenium concentration in elderly people.Ann Nutr Metab. 2006;50(2):126-31.

González S, Huerta JM, Fernández S, Patterson AM, Lasheras C. Homocysteine increases the risk of mortality in elderly individuals. Br J Nutr. 2007; 97:1138–1143.

Goyal A, Terry MB, Siegel AB. Serum antioxidant nutrients, vitamin A, and mortality in U.S. adults. Cancer Epidemiol Biomarkers Prev. 2013 Dec;22(12):2202-11.

Hurst R, Armah CN, Dainty JR, Hart DJ, Teucher B, Goldson AJ, Broadley MR, Motley AK, Fairweather-Tait SJ. Establishing optimal selenium status: results of a randomized, double-blind, placebo-controlled trialAm J Clin Nutr. 2010 Apr;91(4):923-31.

Institute of Medicine. Food and Nutrition Board. Dietary Reference Intakes for Vitamin C, Vitamin E, Selenium, and Carotenoids. Washington, DC: National Academy Press, 2000.

Lauretani F, Semba RD, Bandinelli S, Ray AL, Ruggiero C, Cherubini A, Guralnik JM, Ferrucci L. Low plasma selenium concentrations and mortality among older community-dwelling adults: the InCHIANTI Study. Aging Clin Exp Res. 2008 Apr;20(2):153-8.

Navarro M, López H, Ruiz ML, González S, Pérez V, López MC. Determination of selenium in serum by hydride generation atomic absorption spectrometry for calculation of daily dietary intake. Sci Total Environ. 1995 Dec 15;175(3):245-52.

Ray AL, Semba RD, Walston J, Ferrucci L, Cappola AR, Ricks MO, Xue QL, Fried LP. Low serum selenium and total carotenoids predict mortality among older women living in the community: the women’s health and aging studies. J Nutr. 2006 Jan;136(1):172-6.

Swanson CA, Longnecker MP, Veillon C, Howe M, Levander OA, Taylor PR, McAdam PA, Brown CC, Stampfer MJ, Willett WC. Selenium intake, age, gender, and smoking in relation to indices of selenium status of adults residing in a seleniferous area. Am J Clin Nutr. 1990 Nov;52(5):858-62.

Wei WQ, Abnet CC, Qiao YL, Dawsey SM, Dong ZW, Sun XD, Fan JH, Gunter EW, Taylor PR, Mark SD. Prospective study of serum selenium concentrations and esophageal and gastric cardia cancer, heart disease, stroke, and total death. Am J Clin Nutr. 2004 Jan;79(1):80-5.

Eat more green leafy vegetables, reduce mortality risk?

Vitamin K is found in 2 predominant forms, Vitamin K1 (phylloquinone), found almost exclusively in green leafy vegetables, and Vitamin K2 (Menaquinone), found in fermented foods, organ meats, meat, butter and eggs. In the data below (Juanola-Falgarona et al. 2014), we see that Vitamin K1 (phylloquinone) is negatively associated with death from all causes:

all cause mortl phylo

Death from all causes was assessed based on the average value for four groups of Vitamin K1 intake: 171 ug/day = blue line, 276 ug/day =red line, 349 ug/day = green line and 626 ug/day = the yellow line. In the data above, Vitamin K1 values less than 349 ug/day are about the same in terms of all-cause mortality risk. However, those who ate 626 ug/day of Vitamin K1 had about half of the mortality risk compared to the lower K1 intake groups! Interestingly, the RDA for Vitamin K, at 90 ug/day seems to be outdated, based on the data above. Also, Vitamin K2 was not associated with all-cause mortality risk, as shown below:

k2 all cause

Based on the K1 mortality data, 626 ug/day seems like a good goal. However, osteocalcin is a Vitamin K-dependent protein that has been shown to be maximally active in the presence of 1000 ug of Vitamin K1 (Binkley et al. 2002)! Osteocalcin is involved in pathways that decline with aging: insulin secretion and β-cell proliferation in the pancreas, energy expenditure by muscle, insulin sensitivity in adipose tissue, muscle and liver, and increased testosterone production (Karsenty and Ferron 2012). Therefore, getting 1000 ug+ per day of Vitamin K1 may optimize all of these functions and, decrease mortality risk!

What’s the take home from these data? Eat more leafy greens! How much is needed to get 1000 ug  per day? Shown below is a short list of foods rich in Vitamin K and the serving size needed to reach 1000 ug. Approximately 4 ounces of cooked kale or 7 oz. of raw spinach will suffice, and at a low calorie yield. Other foods, like broccoli, brussel sprouts or romaine lettuce would need to be consumed in far greater amounts to reach 1000 ug.

k osteo

What’s my daily K1 intake? Shown below is my 7-day average (7/16/2015 – 7/22/2015) for K intake, derived almost exclusively from plant sources. 1379 ug/day puts me well above the 626 ug/day that was associated with reduced mortality risk, and above the 1000 ug/day needed for maximal osteocalcin activation.

my k intake

If you’re interested, please have a look at my book!


References:

Binkley NC, Krueger DC, Kawahara TN, Engelke JA, Chappell RJ, Suttie JW. A high phylloquinone intake is required to achieve maximal osteocalcin gamma-carboxylation. Am J Clin Nutr. 2002 Nov;76(5):1055-60.

Juanola-Falgarona M, Salas-Salvadó J, Martínez-González MÁ, Corella D, Ostrich R, Ros E, Fitó M, Arós F, Gómez-Gracia E, Fiol M, Lapetra J, Basora J, Lamuela-Raventós RM, Serra-Majem L, Pintó X, Muñoz MÁ, Ruiz-Gutiérrez V, Fernández-Ballart J, Bulló M. Dietary intake of vitamin K is inversely associated with mortality risk. J Nutr. 2014 May;144(5):743-50.

Karsenty G, Ferron M. The contribution of bone to whole-organism physiologyNature. 2012 Jan 18;481(7381):314-20.

Is coffee associated with reduced mortality risk?

Data from large epidemiological studies can be used to guide decisions about health. There’s a lot of confusion about coffee consumption in terms of health…What does the epidemiological data say?

Crippa et al. (2014) pooled the results from 21 studies that included almost 1 million subjects (997,464 to be exact). As shown below, 4 cups of coffee per day (~32 oz, about 1 Liter) is associated with ~15% reduced risk of death from all causes.

Screen Shot 2015-04-28 at 7.36.09 PM

More specifically, what about coffee consumption and risk of death from heart disease and cancer? As shown below, ~3 cups of coffee per day is associated with reduced risk of death from heart disease (CVD). Interestingly, CVD risk increases at coffee consumption >3 cups per day:

Screen Shot 2015-04-28 at 7.38.13 PM

What about coffee consumption and cancer risk? As shown below, although the association between coffee and cancer was not statistically significant, it looks like ~3 cups of coffee is associated with reduced cancer risk, whereas risk begins to increase in amounts greater than 3 cups.

Screen Shot 2015-04-28 at 7.40.41 PM

I hope this clears up some of the confusion that exists about coffee consumption and health!

If you’re interested, please have a look at my book!

Reference

Crippa A, Discacciati A, Larsson SC, Wolk A, Orsini N. Coffee consumption and mortality from all causes, cardiovascular disease, and cancer: a dose-response meta-analysis. Am J Epidemiol. 2014 Oct 15;180(8):763-75.

Dietary fiber from whole grains is associated with reduced mortality risk-which grains are highest in fiber?

In an earlier post I reported that dietary fiber from whole grains is associated with reduced mortality risk for all causes, cardiovascular disease, cancer, respiratory and infectious disease in both men and women (https://atomic-temporary-71218033.wpcomstaging.com/2014/08/02/is-dietary-fiber-associated-with-reduced-mortality/).

More specifically, which whole grains are highest in fiber?

Shown below are grams of dietary fiber per 100 grams (uncooked) for each respective grain.

grain fiber

It should be clear from the table that barley (16.6g) and rye (15.1g) are the all-stars for grains with the highest amounts of dietary fiber per 100g. Wheat (12.2g) and oats (10.6g) are also excellent sources. Because of the association between dietary fiber from grains and reduced mortality risk, it might be a good idea to add these foods to your diet!

If you’re interested, please have a look at my book!

Is Dietary Fiber Associated with Reduced Mortality?

In an earlier I post I hypothesized that gut bacteria may be involved in mechanisms that affect lifespan. Because gut bacteria ferment dietary fiber to make short chain fatty acids such as butyrate, which may be involved in processes that mediate lifespan, investigation of large-scale epidemiological studies about the association between dietary fiber intake with all-cause mortality would be a good way to test this hypothesis. While this post won’t summarize all of the studies that relate fiber intake to mortality risk, in future posts I will sequentially investigate all the studies that have examined this association.

The Dietary National Institutes of Health-AARP Diet and Health Study (Park et al. 2011) included 567,169 men and women, aged 50–71 years who provided dietary intake data for a 9-year period. Dietary intakes were assessed with a self-administered 124 item food frequency questionnaire.

Compared with the lowest dietary fiber intake (13g in men, 11g in women), death from all causes was reduced by 22%, when compared with those with the highest intake (29g in men, 26g in women). So, the answer is to eat more fiber! I should say it’s easy to get 30 grams of fiber/day. That’s pretty close to my breakfast, which includes 100g of flaxseed, 35g yacon and ~90g of medjool dates.

Which dietary component was associated with this reduced risk, fiber from grains, fruits, vegetables or beans? Relative risk (including 95% confidence intervals) for men is shown in Table 1.

Grains Fiber Mortality Table 1

In comparison with the lowest grain fiber intake, those with the highest intake had significantly reduced risk of 23%, 23%, 17%, 52% and 26% death from all causes, cardiovascular disease, cancer, infectious diseases and, respiratory diseases, respectively. In women, fiber from grains significantly reduced mortality risk for each of these categories by 17-28%, with the exception of deaths from infectious disease. So, for the Paleo types who say don’t eat whole grains, the evidence doesn’t support that idea!

In Table 2 we see that fiber from fruits was not significantly associated with reduced mortality risk for any outcome. Does that mean don’t eat fruit? No. Fruit intake is well documented to be associated with improved health, so other components besides fruit fiber are likely involved.

Fruit Fiber Mortality Table 2

What about mortality risk for fiber from vegetables (Table 3)?

Vegetable Fiber Mortality Table 3

In men, compared with the lowest vegetable fiber intake, those with the highest vegetable fiber intake had 5% and 8% significantly reduced all-cause mortality risk and, cancer deaths, respectively. In women, all-cause mortality was significanty reduced by 5%, whereas respiratory disease deaths were reduced by 28%.

The association between fiber from beans with mortality risk is shown in Table 4.

Beans Fiber Mortality Table 4

Fiber from beans was not associated with reduced mortality risk for any outcome in men, but, all-cause, CVD, cancer and infectious disease deaths were significantly reduced by 13%, 17%, 3% and 41%, respectively in women.

The take home message? Eat more fiber!

If you’re interested, please have a look at my book!

References:

Park Y, Subar AF, Hollenbeck A, Schatzkin A. Dietary fiber intake and mortality in the NIH-AARP diet and health study. Arch Intern Med. 2011 Jun 27;171(12):1061-8.


Vegans, Vegetarians, Fish and Meat eaters: Which diet is best for minimizing risk of disease and death?

To answer the question proposed in the title, today I’ll look at the results of the Oxford Vegetarian study, in which risk for all-cause mortality, ischemic heart disease and malignant neoplasms was determined (Appelby et al.  1999). 6000 vegetarians and 5000 non-vegetarians were recruited, and, all participants were further divided into 4 groups: vegans, defined as those who never ate animal products; vegetarians, who never ate meat or fish but did eat dairy products, eggs, or both; fish eaters, who ate fish but no meat; and meat eaters (who ate meat more than once per week).

All groups consumed the same amount of total calories. However, when comparing individual macronutrients, vegans had the lowest protein (3.3% of total calories less than meat eaters) and fat intake (4.6 % less), but they made up for this difference by having a higher carbohydrate intake (9.5%), relative to all other groups. A similar dietary pattern was found in vegetarians, when compared with both fish and meat eaters.

A decreased total cholesterol/HDL ratio (TC/HDL) was found in vegans, when compared with vegetarians, fish and meat eaters  The TC/HDL ratio has been shown to be a strong independent predictor for the development of peripheral arterial disease (PAD, Ridker et al.  2001), a disease in which plaque builds up in the arteries that carry blood to the head, organs, and limbs. In vegans, TC/HDL = 2.88; in vegetarians, 3.25; fish eaters, 3.21; meat eaters 3.56. Based on these results, the incidence of ischemic heart disease was predicted to be 57% lower in lifelong vegans and 24% in lifelong vegetarians than in meat eaters.

When considered as a whole group (11,000 subjects), significant associations between individual dietary components and mortality risk for ischemic heart disease were determined. For example, eating up to 5 eggs per week did not significantly increase mortality risk, but eating 6+ eggs per week increased risk by 270%. Eating cheese (excluding cottage) up to 4 times per week did not increase mortality risk, but eating cheese more than 5 times per week increased mortality risk by 247%.  Relative to the lowest intake of animal and saturated fat, mortality risk was increased by 329% and 277%, in the highest intake, respectively. Similarly, those that ate the most cholesterol had a 353% increased mortality risk, relative to the lowest intake. In other words, high amounts of eggs cheese, animal and saturated fat were found to be associated with increased risk for ischemic heart disease.

Death rates, risk of ischemic heart disease and the risk of malignant cancer were 20%, 28% and 39% reduced in in non-meat-eaters when compared with meat eaters.Cumulatively, these results provide yet another reason to reduce meat consumption! (Also see http://atomic-temporary-71218033.wpcomstaging.com/2014/07/25/methionine-restriction-extends-lifespan-another-reason-to-reduce-meatprotein-intake/).

If you’re interested, please have a look at my book!

References:

Appleby PN, Thorogood M, Mann JI, Key TJ. The Oxford Vegetarian Study: an overview. Am J Clin Nutr. 1999 Sep;70(3 Suppl):525S-531S.

Ridker PM, Stampfer MJ, Rifai N. Novel risk factors for systemic atherosclerosis: a comparison of C-reactive protein, fibrinogen, homocysteine, lipoprotein(a), and standard cholesterol screening as predictors of peripheral arterial disease. JAMA. 2001 May 16;285(19):2481-5

Blood Urea Nitrogen: A Simple Blood Test For Determining Optimal Protein Intake

How much protein is optimal for health? In this article I’ll explain how to use a simple blood test to answer that question.

Blood urea nitrogen (BUN) is a blood test that you can get at a yearly checkup. It measures the amount of nitrogen, as contained in urea, in your blood. Independent of poor kidney function (where BUN levels are elevated because of an inability to excrete it), urea production is almost perfectly correlated (r = 0.98) to dietary protein intake (Young et al. 2000):
urea nitrog

The main source of dietary nitrogen is protein, so if you eat a lot of protein, you’ll make a lot of urea. Circulating levels of urea can be easily calculated by measuring BUN, via:
Urea [mg/dL]= BUN [mg/dL] * 2.14). Therefore, measuring BUN can then be used to determine if your protein intake is too high or too low.

How much should BUN levels be, with the goal of optimizing health? The reference range for BUN is 5-20 mg/dL. Are BUN values of 5 equal to 20 in terms of mortality risk? What’s optimal? As shown below, BUN levels less than 15 mg/dL are associated with maximally reduced risk of death from all causes. As BUN increases above 15 mg/dL, mortality risk increases. For example, a person with a BUN of 20 would have ~50% higher mortality risk than someone with a value of 15 mg/dL:

BUN

Why would elevated circulating urea be associated with reduced health? Urea (42 mg/dL, light grey bars; 72 mg/dL, dark grey bars below) can diffuse into the gastrointestinal tract, where it’s involved in decreasing expression of the tight junction proteins, zonulin-1 (ZO-1), occludin, and claudin-1 (Vaziri et al. 2013):

urea tj proteins

Decreased levels of ZO-1, occludin, and claudin-1 would be expected to increase gut leakiness, the process where bacteria and/or their metabolic products (i.e. lipopolysaccharide; LPS) move from the intestine into the blood. In support of this, tight junction protein expression decreases during aging (Tran and Greenwood-Van Meerveld, 2013) in parallel with increased circulating LPS (Ghosh et al. 2015). Elevated circulating LPS increases oxidative stress, inflammation, and insulin resistance (for more details see: https://www.amazon.com/dp/B01G48A88A), three major theories of aging!

It’s important to mention that the data of Vaziri et al. (2013) showed decreased tight junction protein expression at urea concentrations of 42 and 72 mg/dL. How does that translate into BUN values? Urea concentrations of 42 and 72 mg/dL correspond to BUN values of 19.6 and 33.6 mg/dL, respectively (42/2.14, 72/2.14). Interestingly, from the all-cause mortality data, a BUN value of 20 is associated with increased risk, compared with values less than 15, and this suggests that the effect of urea on gut leakiness may be one reason why!

What’s my BUN? As shown below, I’ve measured BUN 10 times since 2006. At that time (and before), my diet was protein heavy, consuming 150+ grams of protein per day. This is reflected in my relatively high (greater than 15) BUN values until 2008, which is when I started to reduce my protein intake. In 2012, I tried a fruititarian diet for 1 year-the corresponding low protein intake (~40g protein/day) resulted in my lowest BUN value of 4. In 2013, I tried a vegan diet rich in whole grains for 1 year (~60g protein/day), and that small increase in protein compared with the fruititarian diet increased my BUN to 6. Since then, I’ve settled on a vegetable dominant, pesco-vegetarian dietary pattern that yields an average of ~85 grams of protein per day. Using that approach, my BUN is 8, well under the 15 threshold.

BUN

If you’re interested, please have a look at my book!

References

Ghosh S, Lertwattanarak R, Garduño Jde J, Galeana JJ, Li J, Zamarripa F, Lancaster JL, Mohan S, Hussey S, Musi N. Elevated muscle TLR4 expression and metabolic endotoxemia in human aging. J Gerontol A Biol Sci Med Sci. 2015 Feb;70(2):232-46.

Lustgarten M. Infectious Burden: The Cause Of Aging And Age-Related Disease. 2016. https://www.amazon.com/dp/B01G48A88A

Solinger AB, Rothman SI. Risks of mortality associated with common laboratory tests: a novel, simple and meaningful way to set decision limits from data available in the Electronic Medical Record. Clin Chem Lab Med. 2013 Sep;51(9):1803-13.

Tran L, Greenwood-Van Meerveld B. Age-associated remodeling of the intestinal epithelial barrier. J Gerontol A Biol Sci Med Sci. 2013 Sep;68(9):1045-56.

Vaziri ND, Yuan J, Norris K. Role of urea in intestinal barrier dysfunction and disruption of epithelial tight junction in chronic kidney disease. Am J Nephrol. 2013;37(1):1-6.

Young VR, El-Khoury AE, Raguso CA, Forslund AH, Hambraeus L. Rates of urea production and hydrolysis and leucine oxidation change linearly over widely varying protein intakes in healthy adults. J Nutr. 2000 Apr;130(4):761-6.

Dental Floss, Cancer And Mortality: Is There An Association?

Usually, my focus on optimal health involves proper diet and exercise. But, are there other factors that can reduce mortality risk? More specifically, does how often I brush my teeth or floss have an impact on cancer and all-cause mortality?

Tooth brushing at night before bed and using dental floss every day were found to be significant risk factors for reducing mortality risk in 5611 older adults (median age 81, Paganini-Hill et al. 2011). Tooth brushing at night was found to be the most important time for reducing mortality risk, compared with the morning and during the day, as those who never brushed at night had a 20–35% (men and women, respectively) increased mortality risk. In addition, not brushing your teeth at all was associated with a 41–91% (men and women, respectively) increased mortality risk compared with those who brushed three times daily.

What about flossing? Never flossing increased mortality risk by 30%, compared with those who flossed everyday. And, to illustrate the importance of both tooth brushing and flossing at night, people who brushed their teeth at night every day but never flossed had an increased mortality risk of ~25% , when compared with those who flossed everyday.

One possible explanation for the decreased mortality risk found in those who floss daily is a reduced risk of cancer. For example, those who never floss were found to have ~3-fold more gastric precancerous lesions, when compared with controls (Salazar et al. 2012).

So, if you’re interested in optimal health and lifespan, flossing and tooth brushing every day, especially at night seems to be a must!

If you’re interested, please have a look at my book!

References

Paganini-Hill A, White SC, Atchison KA. Dental Health Behaviors, Dentition, and Mortality in the Elderly: The Leisure World Cohort Study. J Aging Res. 2011;2011:156061.

Salazar CR, Francois F, Li Y, Corby P, Hays R, Leung C, Bedi S, Segers S, Queiroz E, Sun J, Wang B, Ho H, Craig R, Cruz GD, Blaser MJ, Perez-Perez G, Hayes RB, Dasanayake A, Pei Z, Chen Y. Association between oral health and gastric precancerous lesions. Carcinogenesis. 2012 Feb;33(2):399-403.

Gut Bacteria and Lifespan-Is there a Connection?

Our story begins with Michael Rose, who used an experimental evolution approach to breed flies that live more than 2-fold longer than controls (Rose 1999). In contrast with the one gene at a time knockout or overexpression strategy that is ubiquitous in modern biology, Rose separated initially genetically homogeneous flies into two groups-one with delayed and the other with normal reproduction. As shown below, after 80 generations, the group with continually delayed reproduction had ~2-fold increased average and maximal lifespan.

rose mort

While this suggests that continually delaying reproduction may extend lifespan in people, the time it would take to do that makes it an unreasonable strategy. In 2010, the average age at first reproduction in the US was 25.4 years (http://www.cdc.gov/nchs/data/nvsr/nvsr61/nvsr61_01.pdf). Therefore, to replicate the doubling of lifespan found in Drosophila, 80 generations * 25.4y would take more than 2000 years! In contrast, a more reasonable approach towards extending life in people may involve stimulation of some of the pathways involved in the extended fly lifespan.

What genetic mechanisms underlie this 2-fold increase in Drosophila lifespan? Kurapati et al. 2000) found that levels of the mitochondrially located heat shock protein 22 (Hsp22) were between two and ten-fold higher in long-lived Drospohila, relative to the shorter-lived controls. In 2004 Morrow et al. identified the causative role of Hsp22 overexpression, as average lifespan increased by ~30%, thereby implicating mechanisms related to upregulation of Hsp22 on increasing lifespan.

Unfortunately, the role of Hsp22 on influencing lifespan in mammals is unknown. But, can we learn something about the underlying mechanism of the Hsp22-induced increase in lifespan and apply that to mammalian aging?

Hsp22 expression is regulated by histone deacetylase (HDAC) inhibitors (Zhou et al. 2005). In other words, when certain HDAC’s are inhibited, histone acetylation increases, resulting in elevated Hsp22 expression. Interestingly, histone acetylation has also been shown to be involved in lifespan determination in yeast and worms (Kaeberlein et al. 1999, Kang et al. 2002, Kim et al. 1999, Tissenbaum and Guarente, 2001). In contrast, the HDAC’s that have been popularized by the resveratrol-sirtuin story results in histone deacetylation, or the removal of acetyl groups from histones.

Identification of compounds that inhibit the HDAC’s that control Hsp22 expression would seem to be a good method for potentially increasing mammalian lifespan. Supplementation with sodium butyrate increases Hsp22 expression in Drosophila (Zhao et al. 2005), resulting in increased Drosophila lifespan (McDonald et al. 2013). Interestingly, sodium butyrate is a class I, II, IV HDAC inhibitor, whereas the sirtuins are class III inhibitors (Witt et al. 2009), evidence that suggests differing roles for the HDACs on lifespan extension.

Unfortunately, the causative role of butyrate-producing bacteria on mammalian lifespan has yet to be directly tested. However, butyrate stimulates expression of fibroblast growth factor 21 (Li et al. 2012), a protein whose overexpression extends both average and maximal lifespan in mice (shown below; Zhang et al. 2012).

fgf

Furthermore, acarbose supplementation extends median and maximal lifespan in genetically heterogeneous mice (Harrison et al. 2013), an important finding because acarbose supplementation has been shown to elevate serum butyrate in human subjects (Wolever and Chiasson 2000).

How can we get butyrate into our diet? Although butter contains small amounts of butyrate, a butter-rich diet has been shown to be obesogenic (Hariri et al. 2010). Fortunately, there is another way we can increase levels of butyrate, and that’s by stimulating our intestinal bacteria to produce it! The most abundant butyrate-producing gut bacterial species are Faecalibacterium prausnitziiEubacterium rectaleEubacterium hallii and Anaerostipes hadrus (Tap et al. 2009, Walker et al. 2011).

Interestingly, butyrate-producing bacteria decrease during aging, which, in my opinion makes colonizing our intestines with these beneficial bacteria all the more important. For example, Faecalibacterium prausnitziiEubacterium hallii and Eubacterium rectale are significantly reduced in centenarians when compared with elderly and young subjects (Biagi et al. 2010). Several other gut bacterial butyrate producers are also reduced in centenarians when compared with the other age groups, including Ruminococcus obeumRoseburia intestinalisE. ventriosum, and, Papillibacter cinnamovorans.

Collectively, these data suggest that increasing gut bacterial species that produce butyrate may be important for increasing lifespan in both lower organisms and, in mammals. How can we boost butyrate-producing bacteria? Prebiotics, food ingredients that stimulate the growth and/or activity of bacteria in the digestive system may be the best option. Two such food components are inulin and fructooligosaccharides (FOS), which in vitro, stimulate growth of the butyrate producers F. prausnitzii, E.rectale, E. hallii and R. intestinalis 4-15 fold above basal levels (Scott et al. 2014). In vivo, consumption of 10g/day of inulin for 16 days in healthy, middle aged humans (BMI 25 kg*m-2, avg. age 38) significantly stimulated growth of F. prausnitzii (Ramirez-Farias et al. 2009). Therefore, consumption of foods rich in inulin and FOS may be a valid strategy for boosting levels of butyrate-producing bacteria in our intestines.

Foods containing inulin and fructoligosaccharides are shown in Table 1.

fos inulin

First, it’s important to mention that average intake for inulin and FOS is only ~2.5 grams/day (5g total) (Moshfegh et al. 1999). This is because relatively few foods contain high amounts of these prebiotic fibers. For example, whereas 100g of bananas (equivalent to 1 small banana) contains 1 gram total of combined inulin and FOS, in contrast, chicory root and Jerusalem artichoke contain 64.5 and 31.5 grams, respectively. In addition, although not shown in the table, most fruits contain limited amounts of FOS. Bananas contain more FOS/g than apple, blackberry, blueberry, cantaloupe, grapes, orange, peach, pear, raspberry, rhubarb, strawberry and watermelon (Dumitiriu 2005). This is an important finding because one would expect fruits to be rich in inulin and FOS, as both of these fibers contain long chain fructose polymers. Furthermore, based on values for asparagus, chicory, onion, loss of inulin and FOS upon boiling is ~30%, so eating these foods raw is not the only strategy for increasing dietary amounts of FOS and inulin.

Can increasing consumption of FOS and inulin improve health and lifespan? To date, dietary supplementation with inulin has been shown to improve cognitive performance (Messaoudi et al. 2005), and, to reduce cholesterol, triglycerides and body weight, and, improved survival in rats (Rozan et al. 2008). Although randomized controlled trials examining the effect of increasing butyrate-producing bacteria on health and mortality risk in older adults has yet to be performed, collectively, the evidence presented here suggests that if you’re interested in a low risk, potentially high reward approach towards improving health and lifespan, consuming more foods containing FOS and inulin may be a valid strategy!

If you’re interested, please have a look at my book!


References
Biagi E, Nylund L, Candela M, Ostan R, Bucci L, Pini E, Nikkïla J, Monti D, Satokari R, Franceschi C, Brigidi P, De Vos W. Through ageing, and beyond: gut microbiota and inflammatory status in seniors and centenarians. PLoS One. 2010 May 17;5(5):e10667.

Dumitiriu S. Polysaccharides: Structural Diversity and Functional Versatility. 2005. CRC Press. p854-855.

Hariri N, Gougeon R, Thibault L. A highly saturated fat-rich diet is more obesogenic than diets with lower saturated fat content. Nutr Res. 2010 Sep;30(9):632-43.

Harrison DE, Strong R, Allison DB, Ames BN, Astle CM, Atamna H, Fernandez E, Flurkey K, Javors MA, Nadon NL, Nelson JF, Pletcher S, Simpkins JW, Smith D, Wilkinson JE, Miller RA. Acarbose, 17-α-estradiol, and nordihydroguaiaretic acid extend mouse lifespan preferentially in males. Aging Cell. 2013 Oct 26.

Kaeberlein, M., McVey, M. and Guarente, L. (1999). The SIR2/3/4 complex and SIR2 alone promote longevity in Saccharomyces cerevisiae by two different mechanisms. Genes Dev. 13, 2570-2580.

Kang, H. L., Benzer, S. and Min, K. T. (2002). Life extension in Drosophila by feeding a drug. Genetics 99, 838-843. Kim, S., Benguria, A., Lai, C. and Jazwinski, S. M. (1999). Modulation of lifespan by histone deacetylase genes in Saccharomyces cerevisiae. Mol. Biol. Cell 10, 3125-3156.

Kurapati R, Passananti HB, Rose MR, Tower J. Increased hsp22 RNA levels in Drosophila lines genetically selected for increased longevity. J Gerontol A Biol Sci Med Sci. 2000 Nov;55(11):B552-9.

Li H, Gao Z, Zhang J, Ye X, Xu A, Ye J, Jia W. Sodium butyrate stimulates expression of fibroblast growth factor 21 in liver by inhibition of histone deacetylase 3. Diabetes. 2012 Apr;61(4):797-806.

McDonald P, Maizi BM, Arking R. Chemical regulation of mid- and late-life longevities in Drosophila. Exp Gerontol. 2013 Feb;48(2):240-9.

Messaoudi M, Rozan P, Nejdi A, Hidalgo S, Desor D. Behavioural and cognitive effects of oligofructose-enriched inulin in rats. Br J Nutr. 2005 Apr;93 Suppl 1:S27-30.

Moshfegh AJ, Friday JE, Goldman JP, Ahuja JK. Presence of inulin and oligofructose in the diets of Americans. J Nutr. 1999 Jul;129(7 Suppl):1407S-11S.

Morrow G, Samson M, Michaud S, Tanguay RM. Overexpression of the small mitochondrial Hsp22 extends Drosophila life span and increases resistance to oxidative stress. FASEB J. 2004 Mar;18(3):598-9.

Ramirez-Farias C, Slezak K, Fuller Z, Duncan A, Holtrop G & Louis P (2009) Effect of inulin on the human gut microbiota: stimulation of Bifidobacterium adolescentis and Faecalibacterium prausnitzii. Brit J Nutr 101: 533-542.

Rose MR. Can human aging be postponed? Sci Am. 1999 Dec;281(6):106-11.

Rozan P, Nejdi A, Hidalgo S, Bisson JF, Desor D, Messaoudi M. Effects of lifelong intervention with an oligofructose-enriched inulin in rats on general health and lifespan. Br J Nutr. 2008 Dec;100(6):1192-9.

Scott KP, Martin JC, Duncan SH, Flint HJ. Prebiotic stimulation of human colonic butyrate-producing bacteria and bifidobacteria, in vitro. FEMS Microbiol Ecol. 2014 Jan;87(1):30-40.

Tap J, Mondot S, Levenez F et al. (2009) Towards the human intestinal microbiota phylogenetic core. Environ Microbiol 11: 2574-2584.

Tissenbaum, H. A. and Guarente, L. (2001). Increased dosage of a sir2 gene extends lifespan in Caenorhabditis elegans. Nature 410, 227-230

Walker AW, Ince J, Duncan SH et al. (2011) Dominant and diet-responsive groups of bacteria within the human colonic microbiota. ISME J 5: 220-230.

Wolever TM, Chiasson JL. Acarbose raises serum butyrate in human subjects with impaired glucose tolerance. Br J Nutr. 2000 Jul;84(1):57-61.

Witt O, Deubzer HE, Milde T, Oehme I. HDAC family: What are the cancer relevant targets? Cancer Lett. 2009 May 8;277(1):8-21.

Zhang Y, Xie Y, Berglund ED, Coate KC, He TT, Katafuchi T, Xiao G, Potthoff MJ, Wei W, Wan Y, Yu RT, Evans RM, Kliewer SA, Mangelsdorf DJ. The starvation hormone, fibroblast growth factor-21, extends lifespan in mice. Elife. 2012;1:e00065.

Zhao Y, Sun H, Lu J, Li X, Chen X, Tao D, Huang W, Huang B. Lifespan extension and elevated hsp gene expression in Drosophila caused by histone deacetylase inhibitors. J Exp Biol. 2005 Feb;208(Pt 4):697-705.