Yearly Archives: 2015

Blood Testing: What’s An Optimal Value For Triglycerides?

In terms of all-cause mortality risk, is the reference range for circulating triglycerides (TG, <150 mg/dL) optimal?

A meta-analysis of 38 studies in 360,556 subjects with a median age of 48y and a 12-year follow-up reported lowest all-cause mortality risk for subjects with TG values less than 90 mg/dL (equivalent to ~1 mmol; Liu et al. (2013)). As shown below, each successive 90 mg/dL increase was associated with a 12% higher all-cause mortality risk. A person with a value closer to the high end of the reference range, ~150 would have a ~7% increased mortality risk compared someone with a value ~90. In other words, there would be 7 more deaths per 100 total people at a TG value of 150, compared with the death rate for people with values less than 90.

tg mortal

Added importance for the association between TG values less than 90 with all-cause mortality risk come from studies of people who have lived longer than 100 years, centenarians. As shown below, triglyceride values less than 101 mg/dL have been reported in 9 of 11 centenarian studies:

tg mort

What’s my TG value? On my latest blood test (8/2015), it was 42. I’ve measured my TGs 11 times over the past 10 years-my average value for those measurements is 62. Based on the meta-analysis and centenarian data, that would put me in the lowest risk category for all-cause mortality.

tg mort

If you’re interested, please have a look at my book!

References

Arai Y, Hirose N, Yamamura K, Shimizu K, Takayama M, Ebihara Y, Osono Y. Serum insulin-like growth factor-1 in centenarians: implications of IGF-1 as a rapid turnover protein. J Gerontol A Biol Sci Med Sci. 2001 Feb;56(2):M79-82.

Baranowska B, Bik W, Baranowska-Bik A, Wolinska-Witort E, Szybinska A, Martynska L, Chmielowska M. Neuroendocrine control of metabolic homeostasis in Polish centenarians. J Physiol Pharmacol. 2006 Nov;57 Suppl 6:55-61.

Barbagallo CM, Averna MR, Frada G, Noto D, Cavera G, Notarbartolo A. Lipoprotein profile and high-density lipoproteins: subfractions distribution in centenarians. Gerontology 1998;44(2):106–10.

Bik W, Baranowska-Bik A, Wolinska-Witort E, Kalisz M, Broczek K, Mossakowska M, Baranowska B. Assessment of adiponectin and its isoforms in Polish centenarians. Exp Gerontol. 2013 Apr;48(4):401-7.

Chan YC, Suzuki M, Yamamoto S. Dietary, anthropometric, hematological and biochemical assessment of the nutritional status of centenarians and elderly people in Okinawa, Japan. J Am Coll Nutr. 1997 Jun;16(3):229-35.

Chan YC, Suzuki M, Yamamoto S. A comparison of anthropometry, biochemical variables and plasma amino acids among centenarians, elderly and young subjects. J Am Coll Nutr. 1999 Aug;18(4):358-65.

Liu J, Zeng FF, Liu ZM, Zhang CX, Ling WH, Chen YM. Effects of blood triglycerides on cardiovascular and all-cause mortality: a systematic review and meta-analysis of 61 prospective studies. Lipids Health Dis. 2013 Oct 29;12:159.

Magri F, Muzzoni B, Cravello L, Fioravanti M, Busconi L, Camozzi D, Vignati G, Ferrari E. Thyroid function in physiological aging and in centenarians: possible relationships with some nutritional markers. Metabolism. 2002 Jan;51(1):105-9.

Paolisso G, Ammendola S, Del Buono A, Gambardella A, Riondino M, Tagliamonte MR, Rizzo MR, Carella C, Varricchio M. Serum levels of insulin-like growth factor-I (IGF-I) and IGF-binding protein-3 in healthy centenarians: relationship with plasma leptin and lipid concentrations, insulin action, and cognitive function. J Clin Endocrinol Metab. 1997 Jul;82(7):2204-9.

Thillet J, Doucet C, Chapman J, Herbeth B, Cohen D, Faure-Delanef L. Elevated lipoprotein(a) levels and small apo(a) isoforms are compatible with longevity: evidence from a large population of French centenarians. Atherosclerosis 1998;136:389–94.

Vasto S, Scapagnini G, Rizzo C, Monastero R, Marchese A, Caruso C. Mediterranean diet and longevity in Sicily: survey in a Sicani Mountains population. Rejuvenation Res. 2012 Apr;15(2):184-8.

Willcox DC, Willcox BJ, Wang NC, He Q, Rosenbaum M, Suzuki M. Life at the extreme limit: phenotypic characteristics of supercentenarians in Okinawa. J Gerontol A Biol Sci Med Sci. 2008 Nov;63(11):1201-8.

Think Your Diet Is Paleo? Not If Your Potassium Intake Is Less Than…

The stereotype about the Paleo diet is that it is meat heavy. How much meat Paleo era-eaters ate is debatable, but that they consumed large amounts of potassium rich, plant-based foods is not! When examining 159 Stone Age diets, the average daily potassium intake has been reported to be 400 meq/day (Sebastian et al. 2006), as shown below:

potass

How much is 400 meq in milligrams (mg) of potassium? 1 meq = 39.1 mg of potassium, so to figure that out we multiply 400 *39.1, thereby yielding an average daily potassium intake of 15,640 mg/day! It’s important to note that this value is based on a 3000 calorie diet (Eaton et al. 1997). Dividing 15,640/3000 yields 5.21 mg potassium/calorie.

In contrast, as studied in 12,581 US adults, the average dietary potassium intake has been reported to be only ~2600 mg/day (Cogswell et al. 2012). Furthermore, only 1.4% of all subjects had potassium values greater than 4700 mg/day!

What’s my potassium intake? Shown below is my 7-day average intake from 8/29/2015-9/4/2015. The black rectangle in the lower right corner shows my average daily potassium intake to be 10,383 mg/day.

my potass

My average daily calorie intake during that week was 2193. In terms of mg potassium/calorie, my value is 4.73 (10,383/2193), which isn’t far from the reported average Paleo value. What’s yours?

For reference, shown below is a representative day during that week (Wednesday, September 2; 2251 calories) for what I ate.

my intake

If you’re interested, please have a look at my book!

References

Cogswell ME, Zhang Z, Carriquiry AL, Gunn JP, Kuklina EV, Saydah SH, Yang Q, Moshfegh AJ. Sodium and potassium intakes among US adults: NHANES 2003-2008. Am J Clin Nutr. 2012 Sep;96(3):647-57.

Eaton SB, Eaton SB 3rd, Konner MJ. Paleolithic nutrition revisited: A twelve-year retrospective on its nature and implications. Eur J Clin Nutr. 1997 Apr;51(4):207-16.

Sebastian A, Frassetto LA, Sellmeyer DE, Morris RC Jr. The evolution-informed optimal dietary potassium intake of human beings greatly exceeds current and recommended intakesSemin Nephrol. 2006 Nov;26(6):447-53.

Interpreting Blood Test Results (Serum Bicarbonate): What’s Optimal?

My approach to optimizing health and lifespan includes daily nutrient tracking and yearly blood testing. Once you get your blood test results back from the doctor, are your values optimal if you’re within the reference range? This article will examine the “optimal range” for 1 of these measurements, serum bicarbonate.

What does serum bicarbonate measure? The amount of bicarbonate in the blood is indicative of dietary acid load (Adeva and Souto 2011), systemic metabolism, lung and kidney function. First, a diet rich in animal products and grains (acid-forming), and poor in fruits and vegetables (base-forming) can induce a state of metabolic acidosis (Sebastian et al. 2001). Similarly, cellular metabolism produces carbon dioxide (CO2), a gas that is an acid. The lungs and kidneys act to remove systemic increases in acid load: CO2 reacts with water to form bicarbonate (H2CO3-), where it travels to the lung for excretion by exhaling it as CO2. The kidneys decrease acid load (whether from the diet or metabolism) by removing protons (H+) from the blood, followed by urinating the acid out of the body, and also by producing bicarbonate. In sum, serum bicarbonate is a measure of acid load: from the diet, by your body’s ability to produce it, by your kidney’s ability to buffer it, and by your lungs ability to remove it.

Low serum bicarbonate is indicative of increased systemic acidity, whereas a high serum bicarbonate indicates systemic alkalinity. If systemic acidity is high, bicarbonate will be consumed to neutralize the acid, thereby decreasing serum bicarbonate. Assuming that bicarbonate is not being consumed in the diet (via fruits and vegetables), the kidney would have to then produce bicarbonate to make up for the increase in bicarbonate consumption.

The reference range for serum bicarbonate is 20-30 mEq/L. My average serum bicarbonate value (y-axis) in 18 blood tests from 2015-2019 is 26.7 mEq/L (red line below):

bicarb.png

Also note that there is a weak trend (black line, R2=0.077) for my serum bicarbonate values to decrease over time.

Sure, these values are within the reference range, but what’s optimal?

In a study that included 31,590 subjects with average age of ~50 years, an average BMI <25 kg/m2, and a median follow up ~8 years, a serum bicarbonate value < 26 mEq/L, compared with 31 mEq/L, had a 46% significantly increased all-cause mortality risk (see below; Park et al. 2015).

bc 2

In contrast to these data, shown below are the findings of Raphael et al. 2013, who found no association between serum bicarbonate with mortality risk. In that study, 15,836 overweight (the BMI range average was from 26-29) subjects with an average age ~43 years were followed for ~9 years. Although an acidic serum bicarbonate value (<22, compared with 26-30 mEq/Las the reference) was associated with a 75% increased all-cause mortality risk, when excluding subjects with CKD from the analysis, that association was no longer statistically significant. However, it is important to note a similar trend (albeit non-significant) of association between acidic serum bicarbonate values with an increased mortality risk was present in those that did not have CKD.

stud2

Note that these 2 studies were performed in adults that were close to middle-age (43y, 50y). What does the data look like in older adults? In a study of 2,287 older adults (average age, 76y, Raphael et al. 2016), serum bicarbonate values less than 23 mEq/L were associated with significantly worse survival over a 10-year follow-up, when compared with values between 23-27.9 mEq/L. Also note that although survival looks worse for those that had bicarbonate values > 28 mEq/L, these data were not significantly different when compared with the 23-27 mEq/L group:

Screen Shot 2019-07-14 at 11.52.55 AM

In addition, lower values for serum bicarbonate in older adults are associated with an increased risk for future physical function limitation (Yenchek et al. 2014). In a study of 1,544 overweight (BMI ~27 kg/m2) older adults (average age, ~75 years), subjects that had lower values for serum bicarbonate (< 25.9 mEq/L) had an increased risk for future functional limitation over a 4-year follow-up period, when compared with subjects with that had higher values (greater than 26 mEq/L). It is important to note that age-related decreased kidney function leads to an inability to produce bicarbonate, thereby decreasing serum bicarbonate. However, after adjusting for the presence or absence of subjects with chronic kidney disease (CKD), the association between a more acidic serum bicarbonate value with future functional limitation remained. In other words, poor kidney function was not driving the effect of acidosis on risk for future functional limitation.

Screen Shot 2019-07-14 at 12.13.49 PM.png

Collectively, these data suggest that higher values for serum bicarbonate (> 26 mEq/L) may be optimal for health and longevity. When considering this, my average bicarbonate value of 26.7 mEq/L seems ok, for now. Note that in my data above, there is a weak trend toward lower values. I’m aware of it, and it continues to decrease over time, I’ll intervene!


If you’re interested, please have a look at my book!


References

Adeva MM, Souto G. Diet-induced metabolic acidosis. Clin Nutr. 2011 Aug;30(4):416-21.

Park M, Jung SJ, Yoon S, Yun JM, Yoon HJ. Association between the markers of metabolic acid load and higher all-cause and cardiovascular mortality in a general population with preserved renal function. Hypertens Res. 2015 Jun;38(6):433-8.

Raphael KL, Zhang Y, Wei G, Greene T, Cheung AK, Beddhu S. Serum bicarbonate and mortality in adults in NHANES III. Nephrol Dial Transplant. 2013 May;28(5):1207-13.

Raphael KL, Murphy RA, Shlipak MG, Satterfield S, Huston HK, Sebastian A, Sellmeyer DE, Patel KV, Newman AB, Sarnak MJ, Ix JH, Fried LF; Health ABC Study Bicarbonate Concentration, Acid-Base Status, and Mortality in the Health, Aging, and Body Composition Study. Clin J Am Soc Nephrol. 2016 Feb 5;11(2):308-16.

Sebastian A, Frassetto LA, Sellmeyer DE, Merriam RL, Morris RC Jr. Estimation of the net acid load of the diet of ancestral preagricultural Homo sapiens and their hominid ancestors. Am J Clin Nutr. 2002 Dec;76(6):1308-16.

Yenchek R, Ix JH, Rifkin DE, Shlipak MG, Sarnak MJ, Garcia M, Patel KV, Satterfield S, Harris TB, Newman AB, Fried LF; Health, Aging, and Body Composition Study. Association of serum bicarbonate with incident functional limitation in older adults. Clin J Am Soc Nephrol. 2014 Dec 5;9(12):2111-6.

Interpreting Blood Test Results (Serum Bicarbonate, Anion Gap): What’s Optimal For Health?

My approach to optimizing health and potentially lifespan includes daily nutrient tracking and yearly blood testing. Once you get your blood test results back from the doctor, are your values optimal if you’re within the reference range? This article will examine the “optimal range” for 2 of these measurements, serum bicarbonate and the anion gap.

What does serum bicarbonate measure? The amount of bicarbonate in the blood is indicative of dietary acid load (Adeva and Souto 2011), systemic metabolism, lung and kidney function. First, a diet rich in animal products and grains (acid-forming), and poor in fruits and vegetables (base-forming) can induce a state of metabolic acidosis (Sebastian et al. 2001). Similarly, cellular metabolism produces carbon dioxide (CO2), a gas that is an acid. The lungs and kidneys act to remove systemic increases in acid load: CO2 reacts with water to form bicarbonate (H2CO3-), where it travels to the lung for excretion by exhaling it as CO2. The kidneys decrease acid (whether from the diet or metabolism) by removing protons (H+) from the blood, followed by urinating the acid out of the body, and also by producing bicarbonate. In sum, serum bicarbonate is a measure of acid load: from the diet, by your body’s ability to produce it, by your kidney’s ability to buffer it, and by your lungs ability to remove it.

Low serum bicarbonate is indicative of increased systemic acidity, whereas a high serum bicarbonate indicates systemic alkalinity. If systemic acidity is high, bicarbonate will be consumed to neutralize the acid, thereby decreasing serum bicarbonate. Assuming that bicarbonate is not being consumed in the diet (via fruits and vegetables), the kidney would have to then produce bicarbonate to make up for the increase in bicarbonate consumption.

The anion gap is a second indicator of systemic acid/base balance. It is a measure of the positively and negatively charged ions in blood, and includes serum bicarbonate. It is calculated by adding the serum concentrations of sodium (Na) and potassium (K), while subtracting chloride (Cl-) and bicarbonate (HCO3-):

Anion gap = ( [Na+] + [K+] ) − ( [Cl−] + [HCO3−] )

A high anion gap is indicative of systemic acidity whereas a low value is indicative of alkalinity.

The reference range for serum bicarbonate and the anion gap are 20-30 and 5-18 mEq/L. On my latest blood test (8/2015) my values were 31 and 6, respectively…Are these values optimal for health?

First, as shown below, decreased serum bicarbonate values are associated with increased risk for future physical function limitation (Yenchek et al. 2014). In a study of 1544 overweight (BMI ~27 kg/m2) older adults (average age, ~75 years) with a median follow-up of ~4 years, acidic serum bicarbonate values (less than 25.9) had an increased risk for future functional limitation, when compared with subjects with more alkaline values (greater than 26). It is important to note that age-related decreased kidney function leads to an inability to produce bicarbonate, thereby decreasing serum bicarbonate. However, after adjusting for the presence or absence of subjects with chronic kidney disease (CKD), the association between a more acidic serum bicarbonate value with future functional limitation remained. In other words, poor kidney function was not driving the effect of acidosis on risk for future functional limitation.

funct lim

In a larger study that included 31,590 subjects with average age of ~50 years, an average BMI <25 kg/m2, and a median follow up ~8 years, a serum bicarbonate value < 26, compared with 31, had a 46% significantly increased all-cause mortality risk (see below; Park et al. 2015). For the anion gap, although mortality risk was increased at values > 11, compared with less than 6, this finding was not statistically significant. Nonetheless a trend for increased mortality risk with a more acidic value for the anion gap was present. In addition, although urine pH is not generally measured when you get a yearly physical, it’s an easy (just pee in a cup!) and inexpensive way to see if you’re peeing out more acid or base. In the figure below, we see that with urinating out more base (pH >8.0) as the reference, peeing out more acid (pH <7.5) is associated with a ~250% increased mortality risk! Assuming you have properly functioning kidneys, urinating more base will happen if your diet is rich in alkaline-rich foods, like vegetables. In contrast, a high meat and grains-based diet will lead to urinating out more acid.

bicarb anion gap urine ph

In contrast to these data, shown below are the findings of Raphael et al. 2013, who found no association between serum bicarbonate with mortality risk. In that study, 15,836 overweight (the BMI range average was from 26-29) subjects with an average age ~43 years were followed for ~9 years. Although an acidic serum bicarbonate value (<22, compared with 26-30 as the reference) was associated with a 75% increased all-cause mortality risk, when excluding subjects with CKD from the analysis, that association was no longer statistically significant. However, it is important to note a similar trend (albeit non-significant) of association between acidic serum bicarbonate values with an increased mortality risk was present in those that did not have CKD.

stud2

Further support for alkaline values for serum bicarbonate or the anion gap being beneficial for health is shown below. A low anion gap (after adjusting for serum albumin) was associated with better survival with a more alkaline value (<10.5), when compared with acidic values (>10.5) in 862 normal weight (BMI ~24) elderly (average age ~74y), during a 5-year follow up (Ahn et al. 2014). Included in the improved survival rate were decreases in cardiovascular disease and infection-related mortality.

ag mort

One criticism of this data is that these associations are in older adults, and that age-related decreases in kidney function may lead to an inability to produce bicarbonate, thereby increasing the anion gap. In disagreement with that critique, young subjects (age range, 20-49 years) with low serum bicarbonate and an elevated anion gap (which together suggest systemic acidosis) were significantly more likely to have decreased cardiorespiratory fitness (VO2 max) (Abramowitz et al. 2012).

Collectively, based on these data it looks like my serum bicarbonate (31) and anion gap (6) values are close to optimal for health and longevity. If your values are not close to optimal, can they be improved? Yes! Increasing fruit and vegetable (F&V) intake has been shown to increase serum bicarbonate (Goraya et al. 2013). Because bicarbonate is a component of calculating the anion gap, an increase in fruit and vegetable intake would be expected to also decrease the anion gap (although I couldn’t find any studies that have tried to use F&V to reduce it).

If you’re interested, please have a look at my book!

References

Abramowitz MK, Hostetter TH, Melamed ML. Lower serum bicarbonate and a higher anion gap are associated with lower cardiorespiratory fitness in young adults. Kidney Int. 2012 May;81(10):1033-42.

Adeva MM, Souto G. Diet-induced metabolic acidosis. Clin Nutr. 2011 Aug;30(4):416-21.

Ahn SY, Ryu J, Baek SH, Han JW, Lee JH, Ahn S, Kim KI, Chin HJ, Na KY, Chae DW, Kim KW, Kim S. Serum anion gap is predictive of mortality in an elderly population. Exp Gerontol. 2014 Feb;50:122-7.

Goraya N, Simoni J, Jo CH, Wesson DE. A comparison of treating metabolic acidosis in CKD stage 4 hypertensive kidney disease with fruits and vegetables or sodium bicarbonate. Clin J Am Soc Nephrol. 2013 Mar;8(3):371-81.

Park M, Jung SJ, Yoon S, Yun JM, Yoon HJ. Association between the markers of metabolic acid load and higher all-cause and cardiovascular mortality in a general population with preserved renal function. Hypertens Res. 2015 Jun;38(6):433-8.

Raphael KL, Zhang Y, Wei G, Greene T, Cheung AK, Beddhu S. Serum bicarbonate and mortality in adults in NHANES III. Nephrol Dial Transplant. 2013 May;28(5):1207-13.

Sebastian A, Frassetto LA, Sellmeyer DE, Merriam RL, Morris RC Jr. Estimation of the net acid load of the diet of ancestral preagricultural Homo sapiens and their hominid ancestors. Am J Clin Nutr. 2002 Dec;76(6):1308-16.

If Your Goal Is Optimal Nutrition, Which Is Better, Carrots Or Sweet (Orange) Potatoes?

If your goal is optimal nutrition, which orange root vegetable would you choose, carrots or sweet potatoes? 100 calories from carrots vs. 100 calories from sweet potatoes, let’s have a look!

First, to get 100 calories you can eat almost double the amount of carrots, 245g compared with 111g of a baked sweet potato. Protein and carbohydrate are about the same, whereas there is marginally more fat in carrots. However, for the same amount of calories, carrots have almost double the fiber! Fiber feed gut bacteria, which may be involved in lifespan (https://atomic-temporary-71218033.wpcomstaging.com/2014/07/16/are-the-bacteria-in-our-intestines-involved-in-mechanisms-underlying-health-and-lifespan/), so I’m all for that!

carr pot1

What about vitamin content? For the 17 Vitamins below, carrots have higher values for 10 of them, whereas sweet potatoes have higher values for only 3 vitamins. It’s important to note that for the same amount of calories, carrots have almost double the Vitamin A and beta-carotene,  17+ fold more alpha-carotene, and contain lutein+xeaxanthin (whereas sweet potatoes don’t have any!).

vitam

What about mineral content? For the 10 minerals shown in the below, raw carrots are better than sweet potato for 5 minerals, whereas sweet potato leads for 4 mineral categories. However, sweet potato is barely better for some, like magnesium, iron and copper, by 1 milligram, 0.1 and 0.1 milligrams, respectively.

miner

Carrots also contain flavanoids, including flavones (luteolin) and flavanols (kaempferol, myricetin, quercetin), whereas these metabolites are absent in sweet potatoes. An increased flavanoid intake in older adults is associated with reduced all-cause mortality risk (Ivey et al. 2015):

flav mort

So, based on energy and nutrient density (you can eat more carrots, and carrots have far more nutrition than sweet potatoes, for the same amount of calories), I would choose carrots over sweet potatoes. However, as an argument against this, Okinawans, who have one of the highest life expectancies in the world (shown below) consume more than half of the their calories from sweet potatoes (Wilcox and Wilcox 2014). Maybe carrots being better than sweet potatoes doesn’t matter? Or maybe the Okinawans would have slightly better health if they got a similar amount of calories from carrots instead?

okin

Interestingly, vegetables and fruits comprise the base of the Okinawan food pyramid (shown below; Wilcox et al. 2009), which I’ve suggested is both evolutionary accurate (https://atomic-temporary-71218033.wpcomstaging.com/2015/07/17/on-a-paleo-diet-not-if-you-fiber-intake-is-less-than/) and is optimal for maximizing nutrient density (https://atomic-temporary-71218033.wpcomstaging.com/2015/06/03/in-search-of-optimal-nutrient-density-veggies-or-whole-grains/).

okinawan food pyramid

So the take home here is that while carrots are better, it looks like you can’t go wrong eating either carrots or sweet potatoes!

If you’re interested, please have a look at my book!

References

Nutrition info (including flavanoid content) via ndb.nal.usda.gov

Ivey KL, Hodgson JM, Croft KD, Lewis JR, Prince RL. Flavonoid intake and all-cause mortality. Am J Clin Nutr. 2015 May;101(5):1012-20.

Murphy MM, Douglass JS, Birkett A. Resistant starch intakes in the United States. J Am Diet Assoc. 2008 Jan;108(1):67-78. Erratum in: J Am Diet Assoc. 2008 May;108(5):890.

Willcox DC, Willcox BJ, Todoriki H, Suzuki M. The Okinawan diet: health implications of a low-calorie, nutrient-dense, antioxidant-rich dietary pattern low in glycemic load. J Am Coll Nutr. 2009 Aug;28 Suppl:500S-516S.

Willcox BJ, Willcox DC. Caloric restriction, caloric restriction mimetics, and healthy aging in Okinawa: controversies and clinical implications. Curr Opin Clin Nutr Metab Care. 2014 Jan;17(1):51-8.

Circulating Liver Enzymes: AST and ALT, What’s Optimal For Health?

Two blood markers of liver health are aspartate aminotransaminase (AST) and alanine aminotransaminase (ALT). AST and ALT are proteins that are usually found inside liver cells, but when there is liver cell damage, they’re released into the blood. It’s important to note that these proteins can also be elevated in the blood because of muscle damage. The reference range for AST is 10-40 U/L, and 7-56 U/Lfor ALT, but are these values optimal for health and longevity?

In a meta-analysis that included ~9 million adults (average age, 51y) that were followed for up to 20 years, Kunutsor et al. (2014) reported the association between AST and ALT with all-cause mortality risk. For AST (4 studies, 9,046,609 subjects), 10-15 U/L was associated with maximally reduced all-cause mortality risk:

ast acm.png

For ALT (8 studies, 9,087,436 subjects), 12-15 U/L was associated with maximally reduced all-cause mortality risk:

alt acm

While these studies are relevant for middle-aged adults between ~50-70y, what about at older ages? Shown below are the AST and ALT values for adults older than 100 years (centenarians):

ast alt cent.png

Interestingly, the centenarians’ AST and ALT values are not far from the meta-analysis data for middle-aged adults. For example, the centenarians’ AST values range from 17-23, and their ALT values from 9-14.

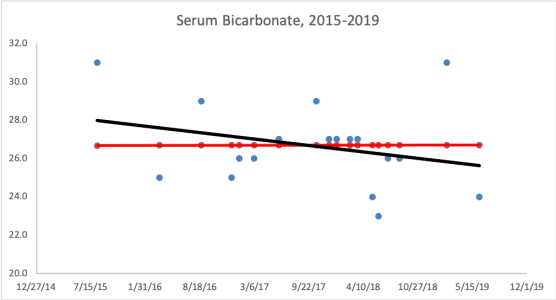
What are my my AST and ALT values? As shown below, I’ve measured them 9 times in the past 10 years. Based on the all-cause mortality and centenarian data my AST and ALT values are too high!

my ast alt

What am I doing to reduce my AST and ALT? Fructose is metabolized by the liver, where high amounts can increase liver cell damage, resulting in increased circulating AST and ALT (Le et al. 2009, Perez-Pozo et al. 2010). Therefore, I’ve reduced my total dietary fructose intake from ~16-18% during the 3 months prior to my last blood test (August, 2015), to ~11-14%. I plan on retesting within the next 2 months, to see if this approach works!

3/23/2016 Update: My average daily fructose intake, expressed as a percentage of total calories, for the 3-month period before my August 2015 blood test was 15.9%. During the 3-month period before my latest blood test (3/2016), my average daily fructose intake was 12.9%. Although a 3% decrease doesn’t seem like much, the difference between these 2 values is highly statistically significant (p value = 7.5E-12). Nonetheless, my liver enzymes didn’t change, with AST and ALT values of 28 and 30, respectively.

My next attempt to reduce my liver enzymes involves reducing my daily green tea intake.  High doses of green tea have been shown to negatively affect the liver (Mazzanti et al. 2009). I currently drink ~6 cups of green tea per day, which may be too much. To test that hypothesis, I’ll reduce my daily green tea to 4 cups/day, and retest my liver enzymes in a few months.

12/8/2017 Update: Since 3/2016, I’ve tested my blood 7 times, and on each measurement, my ALT and AST were both still in the mid 30’s (or higher!). The green tea reduction experiment didn’t work, nor did ~30g of milk thistle seeds/day for 30+ days, nor did reducing my fructose intake to ~9% of total calories. Because I’ve tracked my nutrition in concordance with blood testing, I can look at which nutrients correlate with my liver enzymes, and reduce/increase certain foods that may impact them. Interestingly, my dietary niacin levels (x-axis), which average 41 mg/day (including all data since 2015) were strongly correlated with ALT (y-axis; r = 0.7, R^2=0.50):

Screen Shot 2018-01-06 at 1.21.59 PM

Note that the RDA for niacin is ~15 mg/day for males, and my average niacin intake in more than 2-fold higher than that! This may be a case where higher than the RDA is not optimal for health. Niacin in high doses, albeit in grams, not milligrams, is well known to induce liver damage, so isn’t it possible that my 2-fold higher than the RDA niacin intake is inducing liver damage? Sometime in January, I’ll retest my liver enzymes (and everything else, of course) while reducing my dietary niacin intake from the low 40’s to the low 30’s. As I’ve mentioned in previous posts, I eat lots of mushrooms, around 300 grams at a time, which supply around 11 mg of niacin. That’s atop the list to reduce my niacin intake. Stay tuned for the data!

1/6/2018 Update: Finally, progress! On my 1/3/2018 blood test, I was able to reduce my ALT from my average 37 U/L (over 9 different tests) value to 29! To reduce it, I tried two main things: reducing my dietary niacin intake, and increasing my selenium intake.

First, as noted above, the moderately strong correlation between my dietary niacin intake with ALT suggested that reducing it may also reduce my ALT. From 12/6/2017 to 1/2/2018, I reduced my average daily niacin intake from 41 mg/day to 33.1 mg. Interestingly, in adding that data to my 9 other blood test measurements over the last 27 months, the correlation between my niacin intake with my ALT remained strong (r = 0.75, R^2 = 0.58).

Second, I also increased my dietary selenium intake, which may be involved in affecting my ALT levels. Superficially, when examining the correlation between my average selenium intake (186 mcg/day; x-axis) with ALT (y-axis), we see a very weak negative correlation (r = -0.24, R^2 = 0.06):
Screen Shot 2018-01-06 at 1.43.33 PM.png

Then why did I increase my daily selenium intake from an average value of 186 mg/day to 207 mg/day for the 1-month period that preceded my latest blood test? I discovered that the correlation between dietary selenium density (selenium intake/100 calories) with ALT was strong (= -0.69, R^2 = 0.47):

Screen Shot 2018-01-06 at 1.37.32 PM

Why did I look at dietary selenium density instead of its absolute value? If I eat more calories, one would expect higher levels of selenium (or other nutrients), assuming I’m not eating junk. By accounting for my calorie intake, I may be better able to see how dietary nutrients affect my circulating biochemistry, rather that only looking at the absolute values for each nutrient. Also note that the correlation between niacin density (mg niacin/100 calories) was not as strong (= 0.53, R^2 = 0.28) as the correlation between selenium density with ALT.

Is my ALT sensitive to changes in niacin, selenium, or both? Alternatively, maybe it wasn’t niacin or selenium, but an aberrant reading? I’ll keep my niacin relatively low, and my selenium relatively high, so let’s see on my next test at the end of the month.

If you’re interested, please have a look at my book!


References

Arai Y, Takayama M, Gondo Y, Inagaki H, Yamamura K, Nakazawa S, Kojima T, Ebihara Y, Shimizu K, Masui Y, Kitagawa K, Takebayashi T, Hirose N. Adipose endocrine function, insulin-like growth factor-1 axis, and exceptional survival beyond 100 years of age. J Gerontol A Biol Sci Med Sci. 2008 Nov;63(11):1209-18.

Davey A, Lele U, Elias MF, Dore GA, Siegler IC, Johnson MA, Hausman DB, Tenover JL, Poon LW; Georgia Centenarian Study. Diabetes mellitus in centenarians. J Am Geriatr Soc. 2012 Mar;60(3):468-73.

Kunutsor SK, Apekey TA, Seddoh D, Walley J. Liver enzymes and risk of all-cause mortality in general populations: a systematic review and meta-analysis. Int J Epidemiol. 2014 Feb;43(1):187-201.

Lê KA, Ith M, Kreis R, Faeh D, Bortolotti M, Tran C, Boesch C, Tappy L. Fructose overconsumption causes dyslipidemia and ectopic lipid deposition in healthy subjects with and without a family history of type 2 diabetes. Am J Clin Nutr. 2009 Jun;89(6):1760-5.

Lio D, Malaguarnera M, Maugeri D, Ferlito L, Bennati E, Scola L, Motta M, Caruso C. Laboratory parameters in centenarians of Italian ancestry. Exp Gerontol. 2008 Feb;43(2):119-22.

Mazzanti G, Menniti-Ippolito F, Moro PA, Cassetti F, Raschetti R, Santuccio C, Mastrangelo S. Hepatotoxicity from green tea: a review of the literature and two unpublished cases. Eur J Clin Pharmacol. 2009 Apr;65(4):331-41.

Perez-Pozo SE, Schold J, Nakagawa T, Sánchez-Lozada LG, Johnson RJ, Lillo JL. Excessive fructose intake induces the features of metabolic syndrome in healthy adult men: role of uric acid in the hypertensive response. Int J Obes (Lond). 2010 Mar;34(3):454-61.

Willcox DC, Willcox BJ, Wang NC, He Q, Rosenbaum M, Suzuki M. Life at the extreme limit: phenotypic characteristics of supercentenarians in OkinawaJ Gerontol A Biol Sci Med Sci. 2008 Nov;63(11):1201-8.

Vasto S, Scapagnini G, Rizzo C, Monastero R, Marchese A, Caruso C. Mediterranean diet and longevity in Sicily: survey in a Sicani Mountains population. Rejuvenation Res. 2012 Apr;15(2):184-8.

Blood testing: What’s optimal for WBC levels?

My approach towards optimal health involves yearly blood testing and tracking my results to catch changes before they become problematic. In this article, I will evaluate the published literature to propose an optimal range for circulating white blood cells (WBC).

Why is measuring WBCs important? Briefly, circulating WBCs are correlated with inflammation- inflammation increases during aging, is associated with decreased function of multiple organ systems, and is associated with an increased chronic disease risk (Cevenini et al. 2013).

As shown below, Huang et al. (2007) reported significant correlations between circulating WBCs with a marker of inflammation, C-reactive protein (CRP). This correlation was statistically significant in the whole population (14,114 subjects), in subjects older than or less than 50 years, and separately in men and women.

crp wbc

Based on that data, Huang et al. (2007) suggested changing the reference range (8 years ago!) for WBCs from 4-11 to 3.11-8.83 K/mm3. But within that range, what’s optimal for health and longevity? Because WBC are elevated in association with inflammation, the hypothesis would be that the lower end of the range is better, with values ~4 being optimal. Is this true?

Several studies have reported that WBC values greater than 5 are associated with an increased all-cause mortality risk (Ahmadi-Abhari et al. 2013, Samet et al. 2005, Weijenberg et al. 1996). However, the best evidence for the association between WBCs with mortality risk comes from the Baltimore Longitudinal Study on Aging (BLSA), which studied 2803 men and women over a period of 44 years (Ruggiero et al. 2007). As shown below, subjects that had circulating WBC between 3.5 and 6 had decreased mortality risk, whereas below 3.5, between 6-10, and 10+ each had successively higher risk. The 0.5 point on the y-axis of the curve (survival) is defined as 50% mortality, where half of the study subjects have died. At that point, compared with subjects with WBC values between 6-10, people with values between 3.5 and 6 live ~7 years longer! So getting your WBC into that range may be a big deal for living significantly longer.

wbc ferr

How can you reduce circulating WBCs? One way to reduce WBCs is to eat less calories, thereby reducing your body weight. As shown below, eating less calories resulted in decreased BMI and decreased WBCs in the Biosphere II project (Walford et al. 2002), almost exactly in the same pattern:

cr bmi

WBC Biosphere

Because calorie restriction reduced WBCs from ~6.8 to 4.6, should 4.6 be considered optimal? In support of this idea, calorie restriction is well documented to increase lifespan in a variety of organisms, including flies, worms, and rodents. Although there isn’t any evidence on the long-term effects of calorie restriction (CR) on lifespan in people, it has been shown to be protective against age-related diseases, including abdominal obesity, diabetes, hypertension, and cardiovascular disease (Omodei and Fontana 2011). Therefore, a reduced WBC level may be related to the positive health-related effects of CR. 

As an argument against using the CR-mediated reduction in WBC as a guide for what the optimal range should be, calorically restricted mice have decreased infection-related survival (Goldberg et al. 2015):

cr survival

However, it’s important to note that infection-related survival was decreased in adult CR mice that were 40% restricted in terms of daily calories. Based on the Biosphere 2 data above, BMI was reduced from ~23 to 19, which translates into an ~18% reduction in BMI. However, whether 18% CR is better for improving infection-related survival compared with 40% CR is currently unknown.

What’s my WBC level? My lowest WBC value was in 2008, at 3.9. In 4 measurements from 2008-2013 my WBC increased to 4.4, 4.6, 5.7, and 5.9. However, in my most recent blood test, they’re back down to 4.4. I have 2 possible explanations for reducing my age-related increase in WBCs. First, my body weight weight is ~10 lbs less since last year,  and my 100g+ fiber diet may improve gut barrier function to keep bacteria and other stuff out of my blood that shouldn’t be there, thereby decreasing my systemic immune response.

wbc

My recent 4.4 WBC value puts me close to the CR-value (4.6), and within the optimal 3.5-6 range identified in the BLSA study. So far so good! Stay tuned for the data next year to see if my WBCs remain low or start to rise again.

If you’re interested, please have a look at my book!

References

Ahmadi-Abhari S, Luben RN, Wareham NJ, Khaw KT. Seventeen year risk of all-cause and cause-specific mortality associated with C-reactive proteinfibrinogen and leukocyte count in men and women: the EPIC-Norfolk studyEur J Epidemiol. 2013 Jul;28(7):541-50.

Cevenini E, Caruso C, Candore G, Capri M, Nuzzo D, Duro G, Rizzo C, Colonna-Romano G, Lio D, Di Carlo D, Palmas MG, Scurti M, Pini E, Franceschi C, Vasto S. Age-related inflammation: the contribution of different organs, tissues and systems. How to face it for therapeutic approaches. Curr Pharm Des. 2010;16(6):609-18.

Goldberg EL, Romero-Aleshire MJ, Renkema KR, Ventevogel MS, Chew WM, Uhrlaub JL, Smithey MJ, Limesand KH, Sempowski GD, Brooks HL, Nikolich-Žugich J. Lifespan-extending caloric restriction or mTOR inhibition impair adaptive immunity of old mice by distinct mechanisms. Aging Cell. 2015 Feb;14(1):130-8.

Huang ZS, Lo SC, Tsay W, Hsu KL, Chiang FT. Revision in referene ranges of peripheral total leukocyte count and differential leukocyte percentages based on a normal serum C-reactive protein level. J Formos Med Assoc. 2007 Aug;106(8):608-16.

Jee SH, Park JY, Kim HS, Lee TY, Samet JM. White blood cell count and risk for all-causecardiovascular, and cancer mortality in a cohort of KoreansAm J Epidemiol. 2005 Dec 1;162(11):1062-9.

Omodei D, Fontana L. Calorie restriction and prevention of age-associated chronic diseaseFEBS Lett. 2011 Jun 6;585(11):1537-42.

Ruggiero C, Metter EJ, Cherubini A, Maggio M, Sen R, Najjar SS, Windham GB, Ble A, Senin U, Ferrucci L. White blood cell count and mortality in the Baltimore Longitudinal Study of AgingJ Am Coll Cardiol. 2007 May 8;49(18):1841-50.

Walford RL, Mock D, Verdery R, MacCallum T. Calorie restriction in biosphere 2: alterations in physiologic, hematologic, hormonal, and biochemical parameters in humans restricted for a 2-year period. J Gerontol A Biol Sci Med Sci. 2002 Jun;57(6):B211-24.

Weijenberg MP, Feskens EJ, Kromhout D. White blood cell count and the risk of coronary heart disease and all-cause mortality in elderly menArterioscler Thromb Vasc Biol. 1996 Apr;16(4):499-503.

Beet-Berry Smoothie!

Shown below is what my daily beet-berry smoothie looks like, and the recipe!

beetberry

Recipe:

1 lb of mixed frozen berries (strawberries, blueberries, cherries, raspberries, cranberries)

1 large beet  (8-13 oz.)

1 vanilla bean (2-3 grams)

Put it all in the blender with ~10 oz. of water, blend, and drink!

For an extra boost of taste and nutrition, I also mix my beet-berry smoothie with my spinach-ginger-pineapple smoothie (https://atomic-temporary-71218033.wpcomstaging.com/2015/08/09/pineapple-spinach-smoothie/). Enjoy!

If you’re interested, please have a look at my book!

Pineapple-Spinach Smoothie!

In a previous post, with the goal of reducing all-cause mortality risk I wrote about obtaining (at least) 1000 micrograms of Vitamin K per day. To do that, I’ve begun making pineapple-spinach smoothies!

pinespin

To make it, I used 8 oz of fresh pineapple, which I put in the freezer for 1 hour (because I like frozen drinks). Then, I added 6 oz of baby spinach, 15 grams of fresh ginger, ~3 oz of water, and blended it. All that adds up to 170 calories, 821 micrograms of Vitamin K, and it’s delicious!

If you’re interested, please have a look at my book!