Here’s my book, available now!

Here’s my book, available now!

If you’re interested, please have a look at my book!
Available in all sizes!

If you’re interested, please have a look at my book!
Available in all sizes!

If you’re interested, please have a look at my book!
Available in all sizes!

If you’re interested, please have a look at my book!
In an earlier post, I wrote about the association between biomarkers of systemic acid-base balance (serum bicarbonate, the anion gap, urinary pH) with all-cause mortality risk (https://atomic-temporary-71218033.wpcomstaging.com/2015/08/28/serum-bicarbonate-and-anion-gap-whats-optimal/). Based on these data, systemic acidity may not be optimal for health and longevity, when compared with more alkaline values. Can circulating acid-base biomarkers be optimized through diet?
One way to optimize serum bicarbonate is with a low dietary PRAL (potential renal acid load). For a given food, PRAL is a measure of how much acid or base that the kidney will see. In subjects with normal kidney function (or with chronic kidney disease, CKD), a low dietary PRAL (alkaline-forming) is associated with high serum bicarbonate, whereas a high dietary PRAL (acid-forming) is associated with reduced serum bicarbonate (Ikizler et al. 2015):
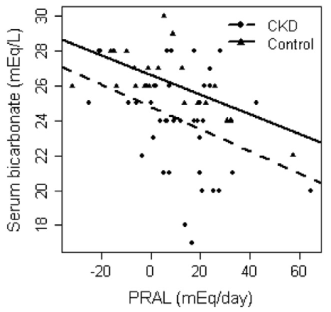
So how can we achieve a low dietary acid intake (low PRAL), with the goal of increasing serum bicarbonate? The answer is to abundantly consume foods with a low PRAL (vegetables), while minimizing foods with a high PRAL (animal products, grains). Let’s have a look at the PRAL values for several food groups (Remer and Manz, 1995):
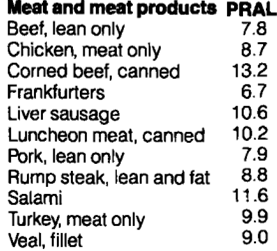
All of the meat and meat products shown below have acid-forming, positive PRAL values:
Similarly, fish have acid-forming, positive PRAL values:

While PRAL values for milk, dairy, and eggs are generally acid-forming, there is a wider range, compared with meat and fish. For example, parmesan and cheddar cheese have high PRAL values (34.2, 26.5, respectively), whereas milk and yogurt have PRAL values ~1:

Grains are similar to animal products in terms of their PRAL values:

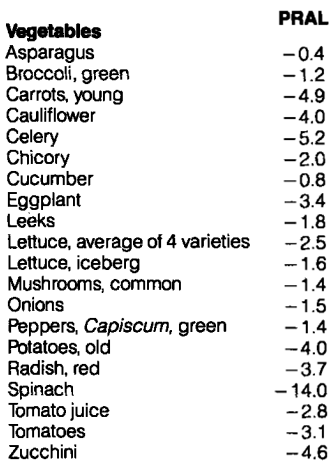
In contrast, all of the vegetables on the list below have very low, alkaline-forming PRAL values. The All-Star for a low PRAL is spinach (-14):
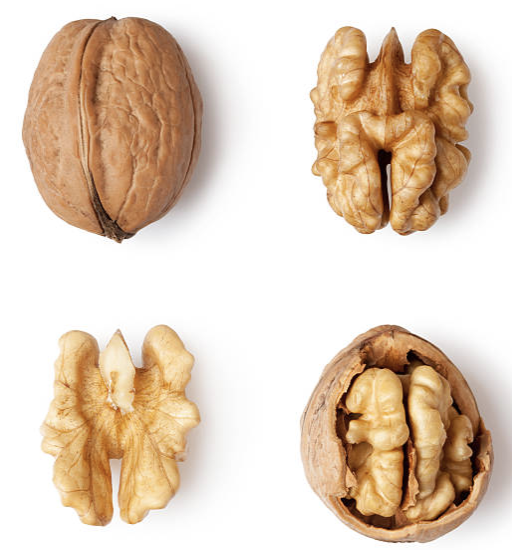
Similarly, most fruits have alkaline forming, low PRAL values. Although raisins seem to be the PRAL All-Star, their data (and all of the other foods on the list) are based on 100g (299 calories for raisins). For an equivalent amount of calories for strawberries, their PRAL equates to -20.6, which is similar to the raisin PRAL. Also included on the list are nuts, which contain a range of PRAL values from negative (hazelnuts) to positive (walnuts, peanuts):

What’s my dietary PRAL? To determine that, it’s first important to define the PRAL equation: PRAL = (0.49 * protein intake in g/day) + (0.037 * phosphorus intake in mg/day) – (0.02 * potassium intake in mg/day) – (0.013 * calcium intake in mg/day) – (0.027 * magnesium intake in mg/day; Remer and Manz, 1994). Using my latest 7-day average dietary data yields a very low, alkaline-forming PRAL, -121.9: (protein, 88g; phosphorus, 2038 mg; potassium, 9868 mg; calcium, 1421 mg; magnesium, 901 mg)! It’s important to note that the major contributor to my very low PRAL value comes from the potassium term. Because of my abundant vegetable intake, my potassium intake is very high, resulting in a highly alkaline PRAL. Considering that PRAL values of -40 were associated with serum bicarbonate values of ~28, my serum bicarbonate value of 31 on my last blood test (8/2015) may in part be explained by my very low dietary PRAL value, -121.9.
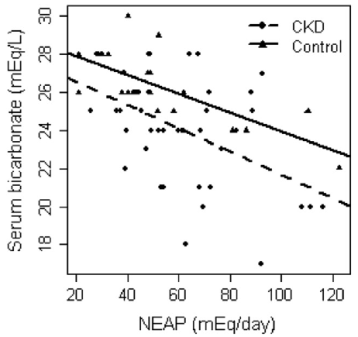
NEAP is more easily calculated than PRAL-all you need to know are your dietary protein and potassium intakes: NEAP = (54.5 * protein intake in grams/day)/(potassium intake in mEq/day) -10.2 (Frassetto et al. 1999). To convert your daily potassium intake from mg to mEq, divide by 39.1. Using my 7-day average protein and potassium intake data yields a NEAP = (54.5 * 88)/(9868/39.1) – 10.2 = 8.8. Based on the plot above for NEAP vs. serum bicarbonate, that again puts me on the far left, which is associated with serum bicarbonate values greater than 28.
Collectively, eating more potassium-rich vegetables will reduce PRAL and NEAP, which is associated with systemic alkalinity, as measured by an elevated serum bicarbonate. Because high serum bicarbonate levels are associated with reduced all-cause mortality risk, this may be an important strategy for improving health and longevity!
If you’re interested, please have a look at my book!
References
Frassetto LA, Todd KM, Morris RJC, Sebastian A. Estimation of net endogenous noncarbonic acid production in humans from diet potassium and protein contents. Am J Clin Nutr. 1998;68:576-583.
Ikizler HO, Zelnick L, Ruzinski J, Curtin L, Utzschneider KM, Kestenbaum B, Himmelfarb J, de Boer IH. Dietary Acid Load Is Associated With Serum Bicarbonate but not Insulin Sensitivity in Chronic Kidney Disease. J Ren Nutr. 2016 Mar;26(2):93-102.
Remer T, Manz F. Estimation of the renal net acid excretion by adults consuming diets containing variable amounts of protein. Am J Clin Nutr. 1994;59:1356-1361.
Remer, T. and Manz, F. Potential renal acid load of foods and its influence on urine pH. Journal of the American Dietetic Association 1995 ;95(7), 791-797.
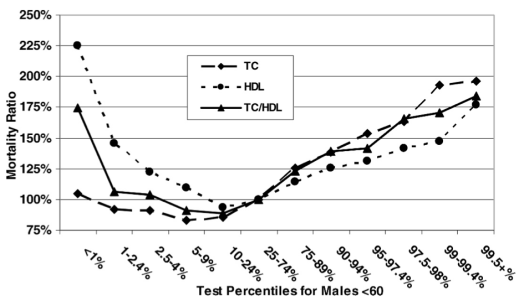
On my latest blood test (August 2015), my total cholesterol was 127 mg/dL-is that value optimal for health and longevity?
Based on data for 1,104,294 men younger than 60y (median age, 40y) that were followed for up to 14 years (Fulks et al. 2009), my 127 mg/dL value (1 – 2.4%) puts me relatively close to maximally reduced all-cause mortality risk, which occurs at 146-158 mg/dL (5-9% on the graph below):
But what about the data for men older than 60?
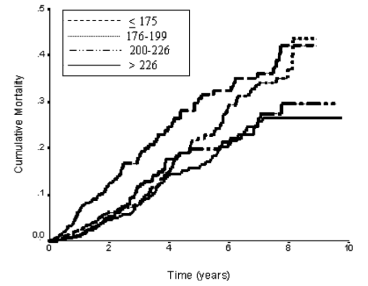
In a 10-year study of 2,277 older adults (average age, ~77y), total cholesterol levels less than 175 mg/dL were associated with ~2-fold higher risk of all-cause mortality, compared with values greater than 226 mg/dL (Schupf et al. 2005):
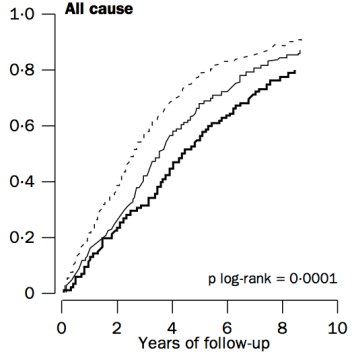
Similarly, in a 10-year study of even older adults (median age, 89y; 724 subjects), all-cause mortality risk was significantly increased in subjects with total cholesterol values less than 193 mg/dL (dark black line below), compared with values greater than 251 mg/dL (dashed line; Weverling-Rijnsburger et al. 1997). In addition, subjects with cholesterol values greater than 251 mg/dL lived ~2 years longer than those with values less than 191 mg/dL. So higher cholesterol in very old adults…increased lifespan! Does that mean I should alter my dietary approach to increase my circulating cholesterol levels after I reach 60?
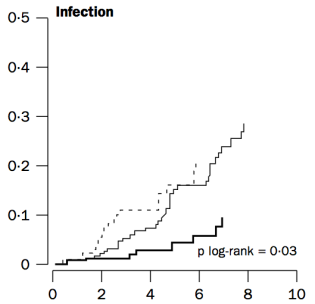
To address that issue, it’s important to understand why cholesterol increases during aging. One possible mechanism involves the role of cholesterol in immune defense against infectious agents (bacteria, viruses, parasites, etc.). Obviously, our immune system is supposed to eliminate these pathogens, but immune function decreases with age (Targonski et al. 2007). As a compensatory mechanism, cholesterol can protect against infectious agents. For example, LDL cholesterol binds to and partially inactivates Staphylococcus aureus (Bhakdi et al. 1983). Staphylococcus aureus infection increases during aging, as its incidence rate is ~3-fold higher in adults older than 60y, when compared with younger subjects (Laupland et al. 2008). In addition, LDL cholesterol inhibits bacterial endotoxin (Weinstock et al. 1992), whose presence in the blood increases during aging (Ghosh et al. 2015). In support of the link between circulating cholesterol with infectious agents, in the older adults of Weverling-Rijnsburger et al. (1997), cholesterol values greater than 251 mg/dL (solid black line) were associated with significantly decreased infectious disease-related mortality, when compared with values less than 193 mg/dL:
So if we’re better able to keep infectious agents out of our blood, that would be expected to reduce the need for elevated circulating cholesterol during aging. How can we do that?
One approach involves increased dietary fiber. Fermentation of dietary fiber by gut bacteria produces short-chain fatty acids, which improve gut barrier function (Chen et al. 2013), and decrease cholesterol synthesis (Wright et al. 1990). However, older adults do not eat high-fiber diets, as values of only ~19g/day have been reported (Lustgarten et al. 2014). In contrast, dietary fiber intakes greater than only 29g/day are associated with less infectious disease (and all-cause mortality) risk (Park et al. 2011). So definitely eating at least 29g fiber/day is important, but is that amount optimal to minimize the need for elevated cholesterol during aging?
In a 2-week study of the role of dietary fiber on circulating cholesterol, subjects that ate only 10g fiber/1000 calories did not significantly reduce their baseline total cholesterol values from ~182 mg/dL (Jenkins et al. 2001). In contrast, a dietary fiber intake of 19g/1000 calories reduced baseline total cholesterol from 185 to 150 mg/dL, and subjects that ate even more fiber than that, 55g/1000 calories reduced their total cholesterol values from ~182 to 142 mg/dL, a drop that was also significantly different compared with the 19g fiber/1000 calorie group.
Collectively, these data suggest that to maximally boost gut barrier function, thereby minimizing circulating infectious agents and the need for elevated circulating cholesterol during aging, a very-high fiber-diet may be important. Accordingly, my average daily fiber intake is ~100 g/day on a 2300 calorie diet, resulting in ~43g fiber/1000 calories. Based on this, I don’t expect for my total cholesterol values to change during aging, as my gut barrier function will be optimal, and infectious agents in my blood will be minimized.
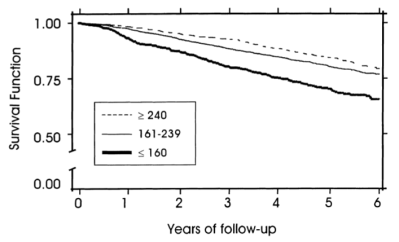
To add some specificity to this approach, 2 additional measurements may be important: serum albumin and HDL cholesterol. In agreement with the studies of Weverling-Rijnsburger et al. and Schupf et al., in a 5-year study of 4,128 older adults (average age, ~79y), those with total cholesterol values less than 160 mg/dL had significantly higher all-cause mortality risk, compared with values greater than 240 mg/dL (Volpato et al. 2001):
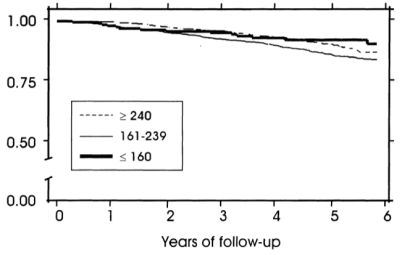
However, when considering subjects’ albumin and HDL cholesterol levels, the differential mortality risk was abolished. Subjects that had low total cholesterol but also high (within-range) albumin and HDL had improved survival compared to the higher cholesterol groups:
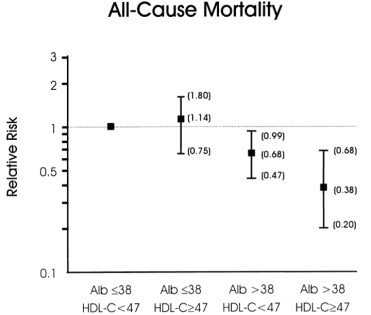
If your total cholesterol values are less than 160 mg/dL, what serum albumin and HDL values should you shoot for? As shown below, albumin levels greater than 38 g/L and HDL values greater than 47 mg/dL were associated with maximally reduced all-cause mortality risk in subjects with total cholesterol values less than 160 mg/dL (Volpato et al. 2001):
My albumin values are consistently between 46-48 g/L, but during recent measurements my HDL levels have been lower than optimal (35 mg/dL on 8/2015). The good news is that I was able to increase my HDL from 28 (7/2013 measurement) to 35 mg/dL by adding ~4 oz of fish every day! To further increase my HDL, I’ve doubled my fish oil intake (~3.3 g of combined EPA + DHA per day, from 5-9 g of cod liver oil). I’ll test the effect of this on my circulating biomarkers in a couple of months, so stay tuned!
3/23/2016 Update: Because of concerns that the pre-formed Vitamin A (that is found in cod liver oil) may negate the potential health-promoting effects of optimal Vitamin D levels (Schmutz et al. 2016), I stopped taking cod liver oil during the 3-month period that preceded my latest blood test (3/23/2016). However, I was able to increase my HDL from 35 to 53 mg/dL! I attribute this increase to the daily inclusion of ~60g/walnuts per day. In doing that, although I only replaced ~200 calories from carbohydrates with fat, lower carbohydrate diets have been shown to increase HDL (Manor et al. 2016).
Nonetheless, in terms of the all-cause mortality data that includes total cholesterol (137 mg/dL), albumin (51 g/L), and HDL (53 mg/dL), based on my latest blood test results, my risk is now maximally low!
If you’re interested, please have a look at my book!
References
Bhakdi S, Tranum-Jensen J, Utermann G, Füssle R. Binding and partial inactivation of Staphylococcus aureus alpha-toxin by human plasma low density lipoprotein. J Biol Chem. 1983 May 10;258(9):5899-904.
Chen H, Mao X, He J, Yu B, Huang Z, Yu J, Zheng P, Chen D. Dietary fibre affects intestinal mucosal barrier function and regulates intestinal bacteria in weaning piglets. Br J Nutr. 2013 Nov;110(10):1837-48.
Eaton SB, Eaton SB 3rd, Konner MJ. Paleolithic nutrition revisited: A twelve-year retrospective on its nature and implications. Eur J Clin Nutr. 1997 Apr;51(4):207-16.
Fulks M, Stout RL, Dolan VF. Association of cholesterol, LDL, HDL, cholesterol/ HDL and triglyceride with all-cause mortality in life insurance applicants. J Insur Med. 2009;41(4):244-53.
Ghosh S, Lertwattanarak R, Garduño Jde J, Galeana JJ, Li J, Zamarripa F, Lancaster JL, Mohan S, Hussey S, Musi N. Elevated muscle TLR4 expression and metabolic endotoxemia in human aging. J Gerontol A Biol Sci Med Sci. 2015 Feb;70(2):232-46.
Jenkins DJ, Kendall CW, Popovich DG, Vidgen E, Mehling CC, Vuksan V, Ransom TP, Rao AV, Rosenberg-Zand R, Tariq N, Corey P, Jones PJ, Raeini M, Story JA, Furumoto EJ, Illingworth DR, Pappu AS, Connelly PW. Effect of a very-high-fiber vegetable, fruit, and nut diet on serum lipids and colonic function. Metabolism. 2001 Apr;50(4):494-503.
Laupland KB, Ross T, Gregson DB. Staphylococcus aureus bloodstream infections: risk factors, outcomes, and the influence of methicillin resistance in Calgary, Canada, 2000-2006. J Infect Dis. 2008 Aug 1;198(3):336-43.
Lustgarten MS, Price LL, Chalé A, Fielding RA. Metabolites related to gut bacterial metabolism, peroxisome proliferator-activated receptor-alpha activation, and insulin sensitivity are associated with physical function in functionally-limited older adults. Aging Cell. 2014 Oct;13(5):918-25.
Mansoor N, Vinknes KJ, Veierød MB, Retterstøl K. Effects of low-carbohydrate diets v. low-fat diets on body weight and cardiovascular risk factors: a meta-analysis of randomised controlled trials. Br J Nutr. 2016 Feb;115(3):466-79.
Park Y, Subar AF, Hollenbeck A, Schatzkin A. Dietary fiber intake and mortality in the NIH-AARP diet and health study. Arch Intern Med. 2011 Jun 27;171(12):1061-8.
Schmutz EA, Zimmermann MB, Rohrmann S. The inverse association between serum 25-hydroxyvitamin D and mortality may be modified by vitamin A status and use of vitamin A supplements. Eur J Nutr. 2016 Feb;55(1):393-402.
Schupf N, Costa R, Luchsinger J, Tang MX, Lee JH, Mayeux R. Relationship Between Plasma Lipids and All-Cause Mortality in Nondemented Elderly. J Am Geriatr Soc. 2005 Feb;53(2):219-26.
Targonski PV, Jacobson RM, Poland GA. Immunosenescence: role and measurement in influenza vaccine response among the elderly. Vaccine. 2007 Apr 20;25(16):3066-9.
Vasto S, Scapagnini G, Rizzo C, Monastero R, Marchese A, Caruso C. Mediterranean diet and longevity in Sicily: survey in a Sicani Mountains population. Rejuvenation Res. 2012 Apr;15(2):184-8.
Volpato S, Leveille SG, Corti MC, Harris TB, Guralnik JM. The value of serum albumin and high-density lipoprotein cholesterol in defining mortality risk in older persons with low serum cholesterol. J Am Geriatr Soc. 2001 Sep;49(9):1142-7.
Weinstock C, Ullrich H, Hohe R, Berg A, Baumstark MW, Frey I, Northoff H, Flegel WA. Low density lipoproteins inhibit endotoxin activation of monocytes. Arterioscler Thromb. 1992 Mar;12(3):341-7.
Weverling-Rijnsburger AW, Blauw GJ, Lagaay AM, Knook DL, Meinders AE, Westendorp RG. Total cholesterol and risk of mortality in the oldest old. Lancet. 1997 Oct 18;350(9085):1119-23.
Wright RS, Anderson JW, Bridges SR. Propionate inhibits hepatocyte lipid synthesis. Proc Soc Exp Biol Med. 1990 Oct;195(1):26-9.
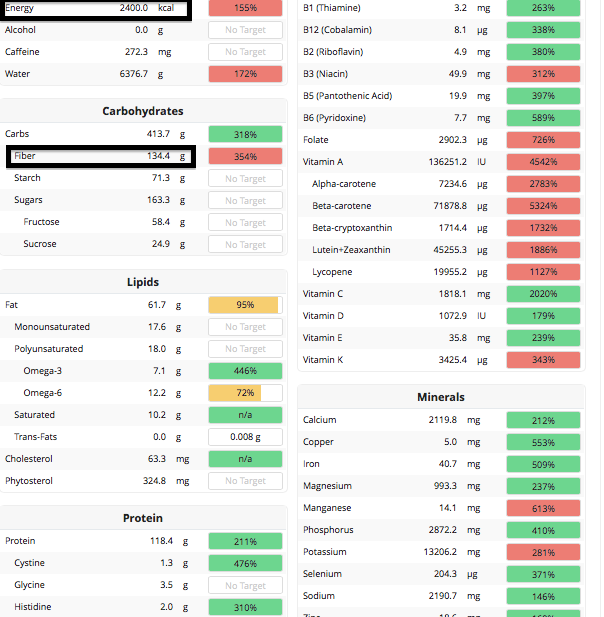
How do I eat ~100 grams of fiber, on average, every day? Here’s my full dietary breakdown from December 30, 2015:
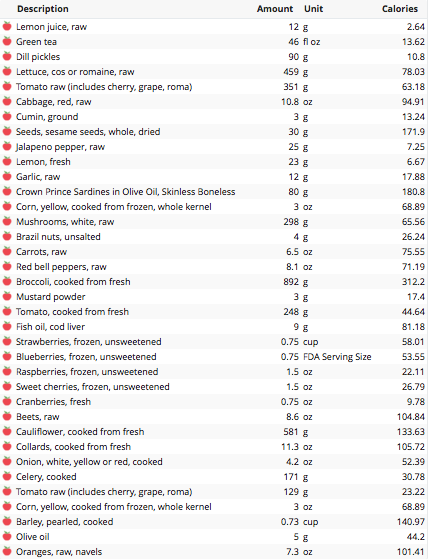
Green tea is associated with reduced all-cause mortality risk (https://michaellustgarten.wordpress.com/2015/10/20/drink-green-tea-reduce-and-all-cause-mortality-risk/), so I start every day with green tea + lemon.
Then, I ate a giant salad (https://michaellustgarten.wordpress.com/2015/10/09/what-i-eat-giant-salad/), consisting of pickles, lettuce, tomato, purple cabbage and corn, and topped with a blended dressing of fresh lemon, sesame seeds, cumin, jalapeño, and raw garlic.
Also on the list were sardines, which I eat every day. Snacks in between bigger meals were carrots, 1 whole red pepper, mushrooms, and a Brazil nut.
Then I ate a big bowl of broccoli topped with cherry tomatoes. I added mustard powder after the broccoli and tomatoes were done cooking (~10 minutes), because broccoli’s sulfurophane content decreases with cooking time (https://michaellustgarten.wordpress.com/2014/08/13/restoring-boiling-induced-sulfurophane-depletion-in-broccoli-with-mustard-powder/).
At some point after that I had cod liver oil, to get my daily dose of Vitamin D and the fish oil fatty acids, EPA and DHA. I just (last week) sent my blood for analysis of my circulating Vitamin D, so I may need to increase my vitamin D intake based on what the result shows.
Next I had my beet-berry smoothie (https://atomic-temporary-71218033.wpcomstaging.com/2015/08/09/beet-berry-smoothie/).
For dinner I had my barley-veggie mix (https://michaellustgarten.wordpress.com/2015/10/08/what-i-eat-barley-cauliflower-collard-tomato-celery-onion-corn-mix/), including barley, cauliflower, celery, tomato, corn, collards, onions and olive oil. Also, with an orange for dessert!
In sum, 2400 calories, 130 grams of dietary fiber, and maximal nutrition!
7/2017 Update: When considering the link between linoleic acid and all-cause mortality (https://michaellustgarten.wordpress.com/2015/12/20/the-essential-fatty-acid-linoleic-acid-dietary-intake-and-circulating-values-whats-optimal-for-health/), Ive increased my intake of omega-6 fats, almost exclusively from walnuts, while cutting my carbohydrate intake to try to stay calorie neutral. In doing so, this change increased my HDL from 28 to ~50, while keeping my total cholesterol < 150, and LDL < 70.
If you’re interested, please have a look at my book!

With the goal of improving health and extending lifespan, Roy Walford was a pioneer in terms of studying (and implementing) a diet that is calorie restricted but that also contains optimal nutrition (CRON). Unfortunately, Walford died at age 80 from complications related to Amyotrophic Lateral Sclerosis (ALS). Were there any factors in his nutritional approach that increased his risk for developing ALS?
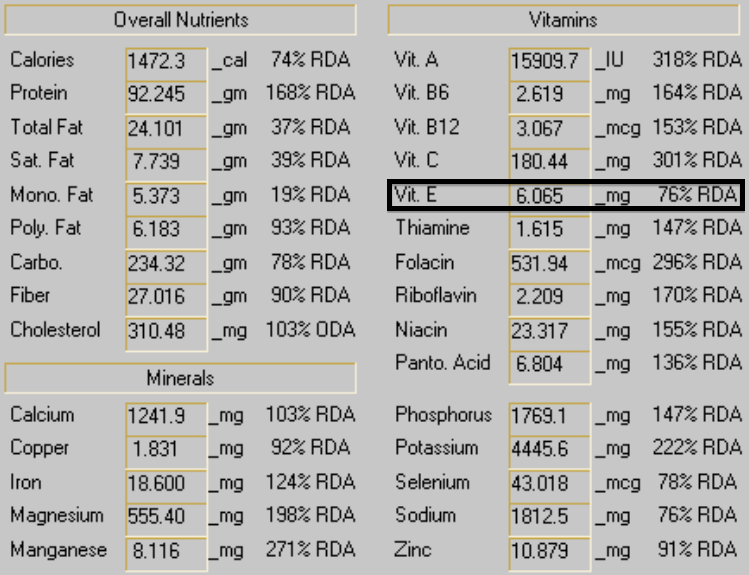
On Walford’s website, http://www.walford.com, he listed 2 sample days of both food intake and his resulting macro- and micronutrient composition:
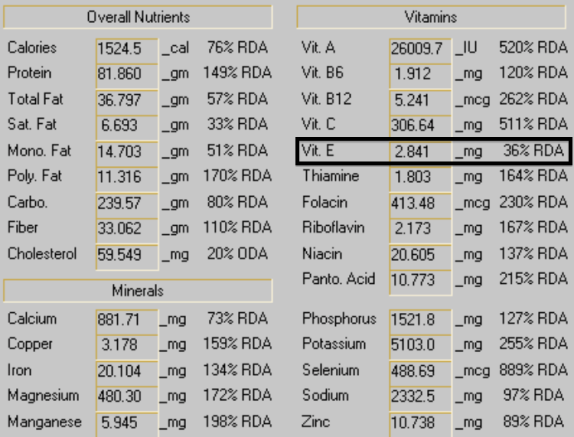
Although several micronutrients (calcium, sodium, zinc) are below the RDA on day 1, Walford’s 2-day average bring these values close to the RDA. However, his Vitamin E intake on day 1 and day 2 (shown below) are glaringly deficient. On day 1, his Vitamin E intake was only 2.8 mg. On day 2, it was 6.1 mg, for a 2-day average value of 4.5 mg. The RDA for Vitamin E was updated in 2000 (Food and Nutrition Board, 2000) from 8 mg to the current 15 mg-he wasn’t close to either value!
Dietary Vitamin E has been reported to be decreased in patients with ALS, when compared with ALS-free controls, as shown below (Veldink et al. 2007). Although the subjects of Veldink et al. had an increased calorie intake when compared with Walford (2842 and 2938 calories in controls and in ALS patients, respectively), when scaled down to Roy’s 1500 calorie intake, a dietary Vitamin E intake of 9 mg would be found in ALS patients, with 10.8 mg found in the controls. For comparison, Walford’s 2-day Vitamin E intake was only 6.1 mg! Interestingly, the only other dietary nutrient category that was significantly different between ALS patients and controls was polyunsaturated fat (PUFA) intake, which was also low (8.8g) in Walford’s 2-day diet.
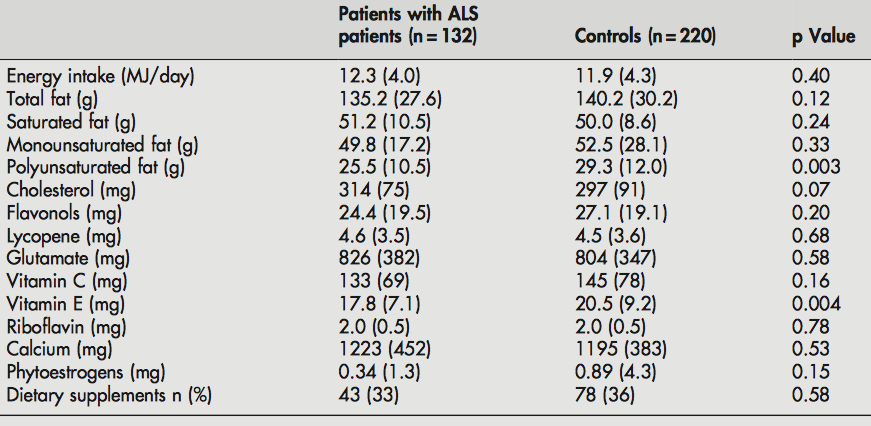
I’m not at all saying that Walford’s dietary deficiencies in Vitamin E and PUFA caused his ALS. It’s also unknown whether the 2 days that he posted on his website are representative of his overall CRON approach. But it’s an interesting observation, isn’t it?
If you’re interested, please have a look at my book!
https://www.amazon.com/dp/B01G48A88A?ref_=k4w_oembed_omIChDjq2EkggX&tag=kpembed-20&linkCode=kpd
References
Food and Nutrition Board, Institute of Medicine. Vitamin E. Dietary reference intakes for vitamin C, vitamin E, selenium, and carotenoids. Washington, D.C.: National Academy Press; 2000:186-283.
Freedman MD, Kuncl RW, Weinstein SJ, Malila N, Virtamo J, Albanes D. Vitamin E serum levels and controlled supplementation and risk of amyotrophic lateral sclerosis. Amyotroph Lateral Scler Frontotemporal Degener. 2013 May;14(4):246-51
Veldink JH, Kalmijn S, Groeneveld GJ, Wunderink W, Koster A, de Vries JH, van der Luyt J, Wokke JH, Van den Berg LH. Intake of polyunsaturated fatty acids and vitamin E reduces the risk of developing amyotrophic lateral sclerosis. J Neurol Neurosurg Psychiatry. 2007 Apr;78(4):367-71.
Linoleic acid (C18:2, n-6) is an essential fatty acid that must be obtained from the diet, because our body can’t make it. How much linoleic acid should we eat every day for optimal health? To answer this question, I’ll investigate the association between circulating levels of linoleic acid with all-cause mortality risk, followed by identification of a corresponding dietary intake. Let’s have a look!
First, are circulating levels of linoleic acid associated with all-cause mortality risk? 4 studies have investigated this issue:
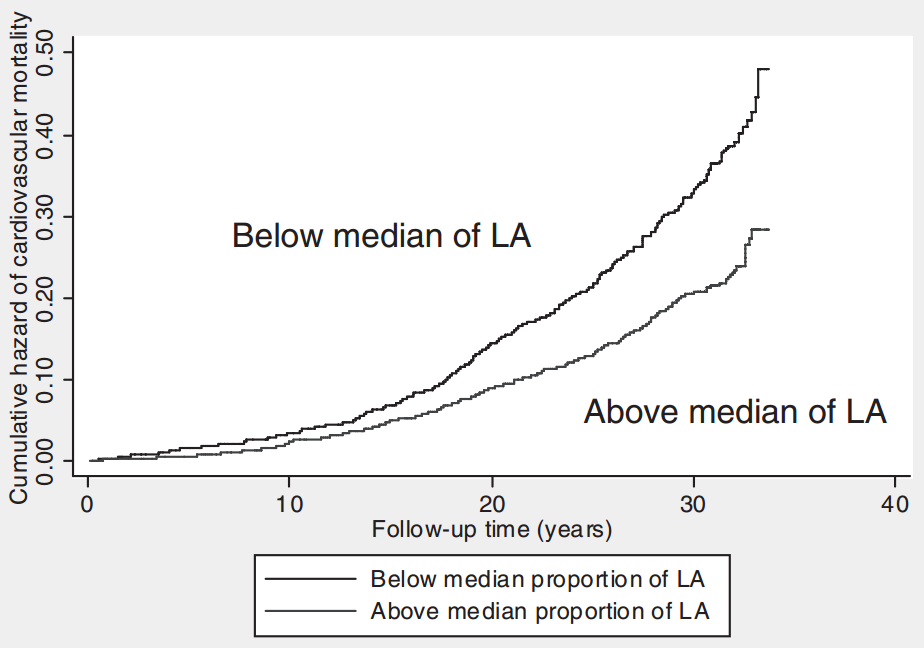
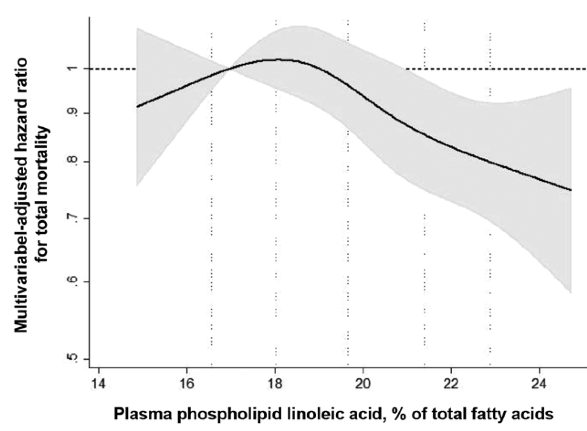
Colectively, these 4 studies show that increased circulating levels of linoleic acid are associated with reduced all-cause mortality risk. How much linoleic acid should we eat to achieve optimal circulating values? In other words, what dietary intake of linoleic acid corresponds to 21%+ of plasma phospholipid linoleic acid? Based on the data below, dietary intakes of linoleic acid that are greater than 14% of total calories are associated with circulating linoleic acid values of 21% (Wu et al. 2014).
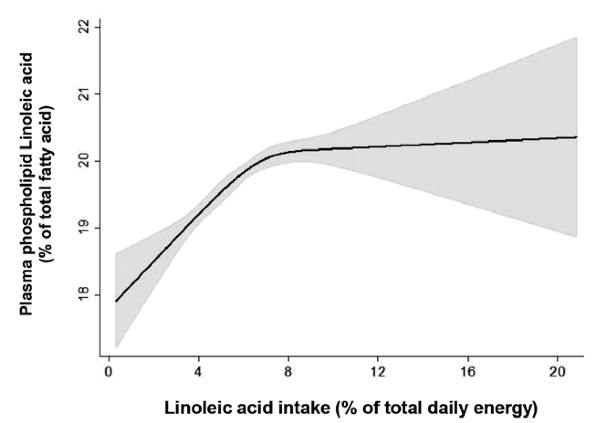
On my ~2300 calorie diet, that translates into 322 calories (36g) from linoleic acid. I get a significant amount of dietary linoleic acid from one of the best linoleic acid food sources, walnuts, which contain 5.8 grams of linoleic acid per 100 calories (see Lipids, C18:2, http://ndb.nal.usda.gov/ndb/foods/show/3690?fg=&man=&lfacet=&count=&max=&qlookup=&offset=&sort=&format=Full&reportfmt=other&rptfrm=&ndbno=&nutrient1=&nutrient2=&nutrient3=&subset=&totCount=&measureby=&_action_show=Apply+Changes&Qv=.152&Q6919=1&Q6920=1&Q6921=1&Q6922=1&Q6923=1&Q6924=1).
Just using walnuts alone, I’d need ~700 calories per day to reach 14% dietary linoleic acid! Although I’m always interested in dietary strategies that may reduce all-cause mortality risk, allocating ~30% of my daily calories to only walnuts is not ideal for my high-fiber approach to health (https://atomic-temporary-71218033.wpcomstaging.com/2015/07/17/on-a-paleo-diet-not-if-you-fiber-intake-is-less-than/), nor would it satiate me, as high-volume vegetable meals are best for that. A more reasonable dietary linoleic acid target (for now) is ~8%, the point at which plasma linoleic acid mostly plateaus (see the plot above). 8% on my 2300 calorie diet translates into 20 grams of linoleic acid per day. I should note that I also get a good amount of linoleic acid (6.4 grams) from the 30 grams of sesame seeds that goes into my giant salad’s dressing, which I eat 2-3x per week. When combined with ~300 calories from walnuts/day, that gets me to at least 8% of my daily calories from linoleic acid.
If you’re interested, please have a look at my book!
References:
Laaksonen DE, Nyyssönen K, Niskanen L, Rissanen TH, Salonen JT. Prediction of cardiovascular mortality in middle-aged men by dietary and serum linoleic and polyunsaturated fatty acids. Arch Intern Med. 2005 Jan 24;165(2):193-9.
Marklund M, Leander K, Vikström M, Laguzzi F, Gigante B, Sjögren P, Cederholm T, de Faire U, Hellénius ML, Risérus U. Polyunsaturated Fat Intake Estimated by Circulating Biomarkers and Risk of Cardiovascular Disease and All-Cause Mortality in a Population-Based Cohort of 60-Year-Old Men and Women. Circulationz 2015 Aug 18;132(7):586-94.
Warensjö E, Sundström J, Vessby B, Cederholm T, Risérus U. Markers of dietary fat quality and fatty acid desaturation as predictors of total and cardiovascular mortality: a population-based prospective study. Am J Clin Nutr. 2008 Jul;88(1):203-9.
Wu JH, Lemaitre RN, King IB, Song X, Psaty BM, Siscovick DS, Mozaffarian D. Circulating omega-6 polyunsaturated fatty acids and total and cause-specific mortality: the CardiovascularHealth Study. Circulation. 2014 Oct 7;130(15):1245-53
