Author Archives: Michael Lustgarten

Unknown's avatar

About Michael Lustgarten

Ph.D, Physiology, University of Texas Health Science Center at San Antonio, 2009 B.S., Biochemistry, Queens College, 2003 B.A, English Textual Studies, 1994, Syracuse University

Vitamin C: Dietary Intake And Plasma Values, What’s Optimal For Health?

How much Vitamin C (ascorbic acid) is optimal for health? To answer this question, I’ll examine the association between circulating levels of Vitamin C with all-cause mortality risk. Then, which dietary Vitamin C intake corresponds to optimal plasma levels? Let’s have a look!

A variety of studies have investigated associations between plasma (or serum) Vitamin C with all-cause mortality risk:

  • In a 4-year study of 1,115 older adults (average age ~79y), plasma vitamin C values greater than 66 uM (micromolar) were associated with significantly decreased all-cause mortality risk, when compared with values less than 17 uM (Fletcher et al. 2003).
  • In a 12-year study of 725 older adults (average age, 73y), plasma vitamin C values greater than 52 uM were associated with significantly reduced all-cause mortality risk (Sahyoun et al. 1996). Interestingly, the most reduced mortality risk was found in those with plasma Vitamin C values greater than 89 uM, a value that can only be attained with dietary Vitamin C intakes greater than 1000 mg/day (more on this below!).
  • In a 16-year study of 8,453 middle-aged adults (average age ~49y), serum Vitamin C values greater than 45 uM were associated with significantly reduced all-cause mortality risk, when compared with values less than 17 uM (Simon et al. 2001).
  • In a 13-year study of 1,054 older adults (average age ~76y), elevated plasma levels of Vitamin C (risk ratios were reported without the actual Vitamin C concentration) were associated with significantly decreased all-cause mortality risk (Bates et al. 2011).
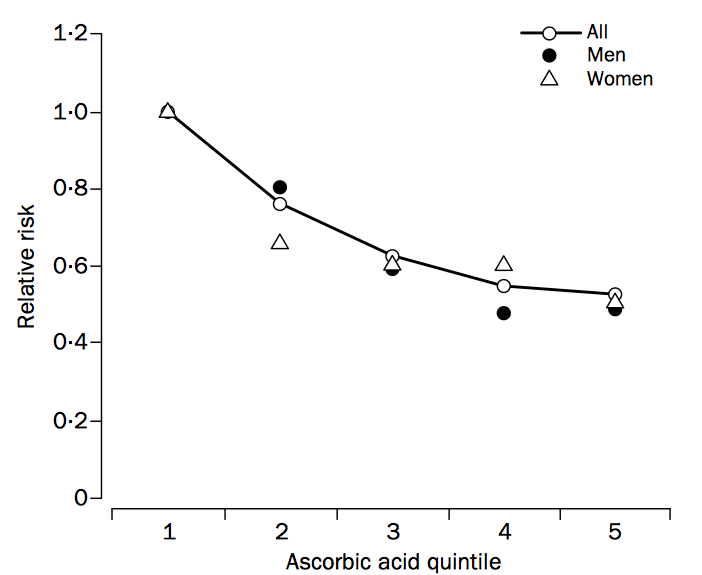
  • In a 4-year study of 19,496 older adults (average age ~59y), plasma Vitamin C values greater than 48 uM in men and 59 uM in women (both in quintile 3, shown below) were associated with significantly reduced all-cause mortality risk (Khaw et al. 2001). The most reduced all-cause mortality risk included average Vitamin C values of 73 uM for men and 85 uM for women (shown below in quintile 5), values which require greater than 500 mg of dietary Vitamin C/day (more on this also below!).

C risk

Studies that show weaker or no association between the plasma Vitamin C concentration with all-cause mortality risk include Loria et al. (2000) and Jia et al. (2007). In Loria et al. (2000), 9,450 middle aged adults (~48y) were followed for 12-16 years. Men in the highest Vitamin C quartile (> 74 uM) had significantly reduced all-cause mortality risk, when compared with men in the low plasma Vitamin C group (< 28 uM). Although a similar association was identified for women, significance was lost after multivariable adjustment. In Jia et al. (2007), although plasma Vitamin C values less than 61 uM were associated with increased all-cause mortality risk in older adults (median age, ~80y) that were studied for ~7.5 years, these data were not statistically significant (p-value = 0.18). However, the study sample size (398 subjects) may have been too small to detect significant effects.

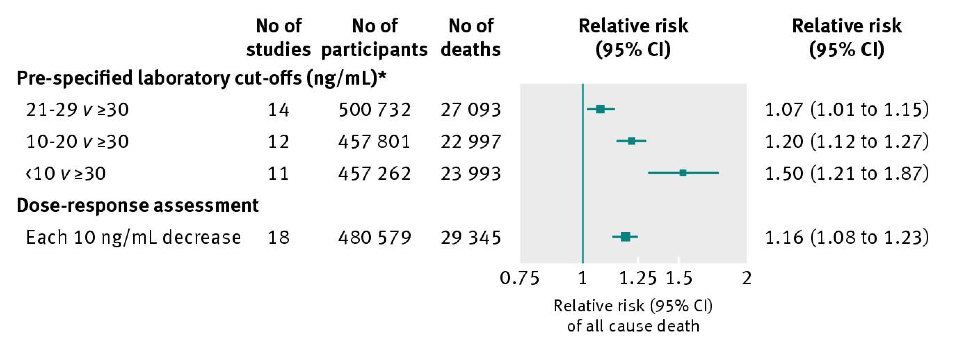
Collectively these studies show that low circulating levels of Vitamin C may be related to increased mortality risk, whereas plasma values greater than ~50 uM are consistently associated with reduced all-cause mortality risk. How much dietary vitamin C is required to attain 50 uM+?

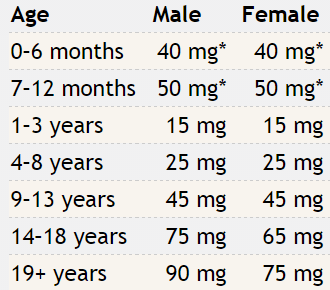
As shown below, the RDA for dietary Vitamin C is 90 mg for males and 75 mg for females older than 19 years (Institute of Medicine 2000).

C RDA

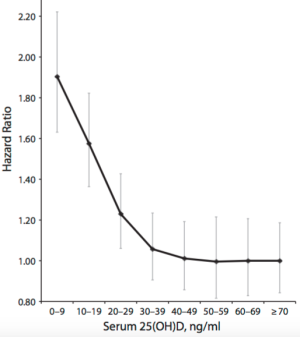
If you consume the RDA for Vitamin C, what plasma Vitamin C concentration will that yield? Shown below is how the plasma Vitamin C concentration varies according to ingested dose (Levine et al. 1996). Consuming the RDA value for Vitamin C  yields a plasma Vitamin C value of 20-30 uM. From the studies listed above, that would put you in the increased all-cause mortality risk group! How much dietary Vitamin C would be needed to achieve plasma values greater than 50 uM? From the plot, we see that a dietary Vitamin C intake at double the RDA would be necessary. Furthermore, because 2 studies have reported decreased all-cause mortality risk at plasma Vitamin C values greater than 66 uM, dietary intakes intake between 500-1000+ mg/day may be necessary:

C dose

Which foods are  Vitamin C-rich? As shown below, sweet peppers (yellow, red, and green) are the All-Stars for Vitamin C content per 100 calories:

C foods

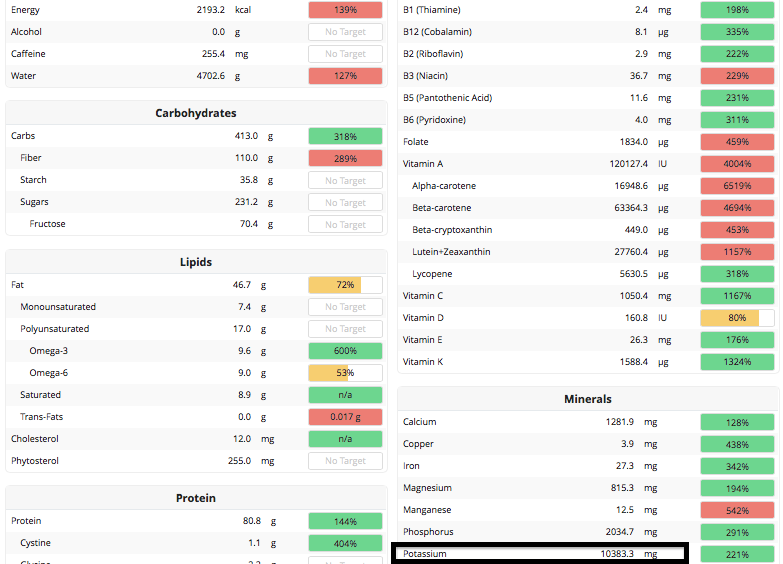
What’s my average daily Vitamin C intake? Shown below is my average daily Vitamin C intake, 875 mg/day, separated by month. Based on that value, my plasma Vitamin C concentration should be ~ 70 uM, which may be associated with maximally reduced all-cause mortality risk.

C intake

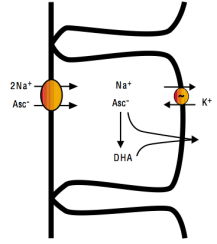
With the goal of optimizing plasma Vitamin C, it is also important to monitor dietary sodium intake. Intestinal absorption of Vitamin C requires dietary sodium (Friedman and Zeidel 1999). As shown below, 1 ascorbate ion (asc-) is absorbed from the intestinal lumen into intestinal epithelial cells in the presence of 2 sodium (Na+) ions. Vitamin C can then diffuse into the blood as Asc- or as dehydroascorbate (DHA):

na asc transport

Accordingly, based on my average dietary Vitamin C intake of 875 mg/day, to maximize absorption, a corresponding dietary sodium intake of 1750 mg would also be necessary.

If you’re interested, please have a look at my book!

References

Bates CJ, Hamer M, Mishra GD. Redox-modulatory vitamins and minerals that prospectively predict mortality in older British people:the National Diet and Nutrition Survey of people aged 65 years and overBr J Nutr. 2011 Jan;105(1):123-32.

Fletcher AE, Breeze E, Shetty PS. Antioxidant vitamins and mortality in older persons: findings from the nutrition add-on study to the Medical Research Council Trial of Assessment and Management of Older People in the Community. Am J Clin Nutr. 2003 Nov;78(5):999-1010.

Friedman PA, Zeidel ML. Victory at C. Nat Med. 1999 Jun;5(6):620-1.

Institute of Medicine. Food and Nutrition Board. Dietary Reference Intakes for Vitamin C, Vitamin E, Selenium, and Carotenoids. Washington, DC: National Academy Press, 2000.

Jia X, Aucott LS, McNeill G. Nutritional status and subsequent all-cause mortality in men and women aged 75 years or over living in the community. Br J Nutr. 2007 Sep;98(3):593-9.

Khaw KT, Bingham S, Welch A, Luben R, Wareham N, Oakes S, Day N. Relation between plasma ascorbic acid and mortality in men and women in EPIC-Norfolk prospective study: a prospective population study. European Prospective Investigation into Cancer and Nutrition. Lancet. 2001 Mar 3;357(9257):657-63.

Levine M, Conry-Cantilena C, Wang Y, Welch RW, Washko PW, Dhariwal KR, Park JB, Lazarev A, Graumlich JF, King J, Cantilena LR. Vitamin C pharmacokinetics in healthy volunteersevidence for a recommended dietary allowance. Proc Natl Acad Sci U S A. 1996 Apr 16;93(8):3704-9.

Loria CM, Klag MJ, Caulfield LE, Whelton PK. Vitamin C status and mortality in US adults. Am J Clin Nutr. 2000 Jul;72(1):139-45.

Sahyoun NR, Jacques PF, Russell RM. Carotenoids, vitamins C and E, and mortality in an elderly population. Am J Epidemiol. 1996 Sep 1;144(5):501-11.

Simon JA, Hudes ES, Tice JA. Relation of serum ascorbic acid to mortality among US adults. J Am Coll Nutr. 2001 Jun;20(3):255-63.

An evidence-based approach for minimizing tooth decay risk

I’d like to keep my teeth healthy for as long as possible. I brush my teeth in the morning and at night, and floss every night, because daily flossing is associated with reduced mortality risk (https://atomic-temporary-71218033.wpcomstaging.com/2014/07/23/dental-floss-cancer-and-mortality-is-there-an-association/). Is there anything else that I can do to optimize my oral health? To answer that question, it’s important to know how tooth decay (also known as caries) occurs. As shown below, bacteria located on our teeth (in plaque) use dietary sugars to make acid, which demineralizes tooth enamel, thereby resulting in caries (Limeback et al. 2012).

caries overview

Not all dietary sugars are equal in their ability to produce tooth decay. In the picture below, sugars with red boxes are the most cariogenic. For example, the worst offenders in terms of tooth decay are sucrose and glucose. Also note that starch is cariogenic, but less when compared with sucrose and glucose. The least cariogenic sugars are sorbitol and mannitol, and, the sugar xylitol has been shown to be protective against tooth decay (Limeback et al. 2012).

sugars cario

After eating a high sugar meal, there is an oral bacteria-induced increase in acidity that can lead to tooth demineralization. At an oral plaque pH of 5.5, tooth enamel demineralization occurs (Stephan and Miller 1943). Shown below is a graph of plaque pH vs. time for the 60 minutes following an oral glucose rinse. The green line is indicative of someone who is caries resistant: their plaque pH decreases from ~6.8 to ~5.8, followed by a relatively quick return to the starting pH value after 60 minutes. Note that at no point does the green line drop below the 5.5 threshold for enamel demineralization to occurr. The yellow line is indicative of someone at moderate tooth decay risk: their plaque pH drops from 6.8 to below 5.5, where it remains for ~ 10 minutes, and then slowly returns to baseline pH values after 60 minutes. The red line is indcative of someone that is at high risk for tooth decay: after the glucose rinse at time 0, their plaque pH rapidly drops below 5.5 and remains there for ~50 minutes, where significant teeth demineralization may occur. Note that their plaque pH doesn’t return to the baseline pH value after 60 minutes, either.

plaque ph

With these data in mind and my goal to reduce tooth decay risk I bought pH strips to test my daily oral pH. Shown below is what the pH strip looks like, without having been dipped in my saliva. Adjacent to that is the pH color scale, and to the right, my average daily fasted oral pH, ~6.5:

no samp20151015_110200pH4hr 20151015_130558

The good news is that I’ve yet to see an oral pH value below 6.5, which puts me at low risk for tooth decay. To further minimize that risk, in addition to brushing and flossing, after meals and throughout the day I gargle with a homemade 1% sodium bicarbonate (physiological saline is ~0.9%) and 10% xylitol solution. I use sodium bicarbonate to temporarily neutralize any potential oral acids. Xylitol can protect against tooth decay by reducing plaque and the level of tooth decay-causing bacteria (i.e. Streptococci mutans) in saliva and plaque (Söderling 2009). For example, fluoride-containing toothpaste in the presence of 10% xylitol reduces tooth decay more than fluoride toothpaste alone (Sintes et al. 1995; Sintes et al. 2002). However, it’s important to note that some xylitol-based studies have not been shown to reduce tooth decay risk (Riley et al. 2015). At worst, including xylitol may have no effect, whereas at best it may reduce oral Streptococci mutans, thereby decreasing tooth decay risk. 

After gargling, my normal oral ph (~6.5) changes to alkaline (~8.5), as shown in the pH strip below:

bicarb20151015_164043

Couldn’t I use a store-bought mouthwash instead?  The measured pH of several commercially available mouthwashes is shown in the table below (Sun et al. 2014). Note that some are below the critical pH for tooth demineralization, 5.5! Others aren’t too far away from 5.5, either. In contrast, the pH of my homemade mouthwash pH is ~8.0.

mwash pH

If you’re interested, please have a look at my book!

References

Limeback H et alComprehensive Preventive Dentistry, Chapter 1: “A brief introduction to oral diseases: caries, periodontal disease, and oral cancer”. page 1-24. July 2012. ISBN: 978-0-8138-2168-9.

Riley P, Moore D, Ahmed F, Sharif MO, Worthington HV. Xylitol-containing products for preventing dental caries in children and adultsCochrane Database Syst Rev. 2015 Mar 26;3:CD010743.

Sintes JL, Escalante C, Stewart B, McCool JJ, Garcia L, Volpe AR, Triol C. (1995). Enhanced anticaries efficacy of a 0.243% sodium fluoride/10% xylitol/silica dentifrice: 3-year clinical results. American Journal of Dentistry, 8, 231–235.

Sintes JL, Elías-Boneta A, Stewart B, Volpe AR, Lovett J. (2002). Anticaries efficacy of a sodium monofluorophosphate dentifrice containing xylitol in a dicalcium phosphate dihydrate base. A 30-month caries clinical study in Costa Rica. American Journal of Dentistry, 15, 215–219.

Söderling EM. (2009) Xylitol, mutans streptococci, and dental plaque. Advances in Dental Research, 21, 74–78.

Stephan RM and Miller BF. (1943) A Quantitative Method for Evaluating Physical and Chemical Agents which Modify Production of Acid in Bacterial Plaques on Human Teeth. Journal of Dental Research, 22, 45–51.

Sun FC, Engelman EE, McGuire JA, Kosmoski G, Carratello L, Ricci-Nittel D, Zhang JZ, Schemehorn BR, Gambogi RJ. Impact of an anticaries mouthrinse on in vitro remineralization and microbial control. Int J Dent. 2014;2014:982071.

Drink Green Tea, Reduce All-Cause Mortality Risk?

Is green tea consumption associated with reduced risk of death risk from all causes? To investigate this question, Tang et al. (2015) performed a meta-analysis of 5 studies, including 200,884 subjects. As shown below, drinking 5 cups (40 oz.) or less per day is associated with reduced all-cause mortality risk. Drinking 2-3 cups (16-24 oz.) of green tea per day was associated with maximally decreased all-cause mortality risk, ~10%.

green tea

If you’re interested, please have a look at my book!

Reference

Tang J, Zheng JS, Fang L, Jin Y, Cai W, Li D. Tea consumption and mortality of all cancers, CVD and all causes: a meta-analysis of eighteen prospective cohort studies. Br J Nutr. 2015 Jul 23:1-11.

What I eat: Giant Salad!

Another meal that I eat 1-2x per week is a giant (delicious!) salad.

salad2

What’s in it? Approximately 1 pound of romaine lettuce, 1 pint of cherry tomates, 6-8 ounces of purple cabbage, ~3 ounces of pickles, and occasionally, 2-4 ounces of corn.  To top it off, I make a spicy-sesame dressing that includes 1 jalapeno, ~1 ounce of lemon juice, ~1 ounce of sesame seeds, 2-4 grams of ground cumin seed, ~10 grams of raw garlic, and 4-6 oz. of water. I then blend the dressing ingredients and add it to the salad!

salad ingred

How about nutrition? For 528 calories, it’s a nutritional All-Star for many things, including protein, fiber, calcium, magnesium, zinc, and many other nutritents.

salad nutrition

7/2017 Update: To increase my folate intake from my usual 1200 mcg to ~1500 mcg/day, I’ve increased the romaine lettuce component of the salad to ~20 oz. Also, I’ve added a small habanero in addition to the jalapeno/fresno pepper for more spice. Still yum!

If you’re interested, please have a look at my book!

What I eat: Barley-Cauliflower-Collard-Tomato-Celery-Onion-Corn-Mix!

What do I eat? Here’s a picture of one of my delicious “mixes” that I eat a couple of times per week.

barl

What’s in it? As shown below, barley, collards, celery, cauliflower, olive oil, corn, onion, and tomatoes. The barley is boiled for 20-30 minutes before I add all the veggies, which I then boil for less than 10 minutes. When it’s finished cooking, I add the olive oil.

barl cals

Besides the taste, this mix is a nutritional All-Star! Within its 622 calories, it provides 29g protein, 37g fiber, 1545 ug of Vitamin K, and much more!

barl cals vitmin

If you’re interested, please have a look at my book!

Vitamin D: What’s an optimal daily intake and blood value?

How much Vitamin D is optimal for health? To answer this question, today I’ll examine the association between a circulating marker of Vitamin D, 25-hydroxyvitamin D, with all-cause mortality risk. Then, I’ll examine the literature to estimate a dietary intake that can achieve an optimal circulating 25-hydroxyvitamin D concentration.

Circulating 25-hydroxyvitamin D is the most commonly measured vitamin D metabolite because of its greater half life (~3 weeks) and up to 1000-fold higher serum levels compared with the physiologically active metabolite of vitamin D, 1,25-dihydroxyvitamin D (Zerwekh 2008). So what’s the evidence for the association between circulating 25-hydroxyvitamin D with all-cause mortality risk?

In a meta-analysis of 95 studies including 880,201 subjects, circulating 25-hydroxyvitamin D levels greater than 30 ng/mL (75 nmol/L) are associated with significantly reduced risk of death from all causes when compared with values less than 30 (<10, 20-29; Chowdhury et al. 2014):

d mort

Does the meta-analysis data for 25-hydroxyvitamin D mean that any values higher than 30 ng/mL are optimal for health? Maybe not. As shown below, although data from 11,315 subjects in the NHANES III study suggests that values between 30-40 ng/mL (75-99 nmol/L) may be optimal for decreased all-cause mortality risk (Sempos et al. 2013), 25-hydroxyvitamin D values greater than 48 ng/mL (120+ nmol/L) were associated with an increased all-cause mortality risk. Interestingly, in agreement with the Chowdhury meta-analysis data, this graph shows also increased mortality risk at values less than 30-40 ng/mL (75-99 nmol/L):

d mortality

However, whether increased circulating 25-hydroxyvitamin D is associated with increased all-cause mortality risk is debatable. In another meta-analysis (Garland et al. 2014), although circulating 25-hydroxyvitamin D values less than 30 ng/mL were again associated with increased risk, in contrast,  values greater than 48 ng/mL were not. Interestingly, values as high as 70 ng/mL (175 nmoL) were not associated with increased risk, either:

D UPDATED META

Aside from our skin making Vitamin D from sunlight during the summer months, what dietary intake can achieve the seemingly optimal 30-40 ng/mL (75-99 nmol/L) concentration for 25-hydroxyvitamin D in the winter? The RDA for Vitamin D is 600 IU for everyone older than 1 but younger than 70 (Institute of Medicine, 2010). If you’re over 70, the RDA is 800 IU. My average dietary intake is only ~170 IU-how can I increase this to at least the RDA, to achieve circulating values between 75-99 nmol/L?

Decent dietary sources of vitamin D include fish: salmon, sardines, mackerel, and tuna. Based on the table below (Holick 2007), eating ~3.5 ounces of wild salmon every day would achieve the RDA for vitamin D intake. In contrast, my daily tin of sardines puts me ~300 IU away from the RDA value! I could double my fish intake to ~8 oz./day, but I’d like to limit my animal protein intake, and, the extra ~200 calories would limit other nutrients that I’d like to enrich in my diet, like fiber.

d

Are there other, less calorie dense dietary sources of vitamin D? It’s important to note that dietary vitamin D can be found in 2 forms, D3, which is shown above, and D2. Which foods are rich in vitamin D2? Shown below is a picture of the best plant-based source of vitamin D2, maitake mushrooms:

maitake

The Vitamin D2 content of maitake mushrooms is 36 IU/calorie, whereas wild salmon only has 3.2 IU of vitamin D per calorie! Other “exotic” mushrooms (anything other than white button mushrooms is exotic to me!) like Chanterelle and Morel contain decent amounts of vitamin D2:

mush

Before adding maitake and other “exotic” mushrooms into my nutritional plan for their vitamin D content, it’s important to ask, “does D2 increase circulating 25-hydroxyvitamin D to an equal extent as D3”? Unfortunately, the answer is no: although D2 and D3 both increase circulating 25-hydroxyvitamin D levels, D2-based sources increase 25-hydroxyvitamin D level about half as effectively as D3 (Trang et al. 1998). So, instead of consuming ~35g of maitake mushrooms to add 400 IU of vitamin D into my diet (to achieve the RDA of 600 IU), I’ve added ~70g/day.

12/29/2015 Update: Because of Maitake’s relatively high cost, $5 for only 100g, and the burden of having to eat it every day, for the past ~3 months I switched to Vitamin D supplements to achieve a D intake of ~1100 IU/day. Blood testing showed that this intake yielded a circulating 25-hydroxyvitamin D winter concentration of 31 ng/mL, putting me at low risk for all cause mortality, based on the meta-analysis D data.

8/23/2016 Update: I stopped supplementing with 1000 IU of Vitamin D in June 2016, to explore the effect of 3-4 hours of weekly sun exposure on my circulating Vitamin D levels. My unsupplemented, circulating 25-hydroxyvitamin D level was 41 ng/mL in my 8/2016 blood test. Accordingly, I intend on increasing my  Vitamin D intake to 1600 IU (1400 supplemental, ~200 dietary)/day to achieve a circulating winter 25-hydroxyvitamin D level that is similar my  the summer value.

11/12/2017 Update: I’ve been supplementing with 2000 IU of D3/day, bringing my average daily total to ~2200 IU/day. Based on that, my latest circulating 25-hydroxyvitamin D level (tested in October, 2017) was 39 ng/mL .

If you’re interested, please have a look at my book!

References

Chowdhury R, Kunutsor S, Vitezova A, Oliver-Williams C, Chowdhury S, Kiefte-de-Jong JC, Khan H, Baena CP, Prabhakaran D, Hoshen MB, Feldman BS, Pan A, Johnson L, Crowe F, Hu FB, Franco OH. Vitamin D and risk of cause specific death: systematic review and meta-analysis of observational cohort and randomised intervention studies. BMJ. 2014 Apr 1;348:g1903.

Garland CF, Kim JJ, Mohr SB, Gorham ED, Grant WB, Giovannucci EL, Baggerly L, Hofflich H, Ramsdell JW, Zeng K, Heaney RP. Meta-analysis of all-cause mortality according to serum 25-hydroxyvitamin D. Am J Public Health. 2014 Aug;104(8):e43-50.

Holick MF. Vitamin D deficiency. N Engl J Med. 2007 Jul 19;357(3):266-81.

Institute of Medicine, Food and Nutrition Board. Dietary Reference Intakes for Calcium and Vitamin D. Washington, DC: National Academy Press, 2010.

Sempos CT, Durazo-Arvizu RA, Dawson-Hughes B, Yetley EA, Looker AC, Schleicher RL, Cao G, Burt V, Kramer H, Bailey RL, Dwyer JT, Zhang X, Gahche J, Coates PM, Picciano MF. Is there a reverse J-shaped association between 25-hydroxyvitamin D and all-cause mortality? Results from the U.S. nationally representative NHANES. J Clin Endocrinol Metab. 2013 Jul;98(7):3001-9.

Trang HM, Cole DE, Rubin LA, Pierratos A, Siu S, Vieth R. Evidence that vitamin D3 increases serum 25-hydroxyvitamin D more efficiently than does vitamin D2Am J Clin Nutr. 1998 Oct;68(4):854-8.

Zerwekh JE. Blood biomarkers of vitamin D status. Am J Clin Nutr 2008;87:1087S-91S.

Boiling drinking water for improved health?

I recently heard centenarian Bernando Lapallo say that he boils his drinking water (http://www.abc15.com/news/local-news/water-cooler/valley-man-celebrates-114th-birthday-shares-his-longevity-secrets). Whether this is a contributor to or is merely associated with his longevity is debatable. What will boiling your water do, prior to drinking it, and is it worth the effort?

The ability of our immune system to combat infectious agents decreases with age (Ginaldi et al. 2001). Can we counteract this? Reducing intake of infectious agents would reduce the burden that our immune systems would have to deal with. Is it possible to reduce intake of infectious agents, including bacteria, viruses, and protozoa?

Boiling water can inactivate a variety of bacteria, viruses, and protozoa (WHO, 2015) that are increased in older adults. For example, as shown below, a water temperature greater than 60C (water boils at 100C) for 5 minutes will inactivate Escherichia Coli (E. coli). Why are E. coli important? E. Coli are elevated in older adults (70­-90y), when compared with young (20­-50y; Enck et al. 2009), and are associated with insulin resistance (Vrieze et al. 2012) and frailty (Claesson et al. 2012). Below we see that boiling water for 5 minutes would thermally inactivate E. Coli, potentially resulting in decreased work for our immune system.

water bacteria

Every morning I boil ~40 oz of water for my green tea. Later in the day in drink 10-20 oz of water, but not boiled. So, ~2/3 of my water intake is boiled, potentially reducing the infectious burden that my immune system has to battle. Whether boiling water reduces this burden by 1%, 10%, or more is unknown. However, based on the ability of water boiling to inactivate pathogens that are increased during aging, it may be a low risk (only the time used!), high reward strategy for improving health during aging. I’m actively considering boiling my 10-20 oz. of water at night, too.

7/2017 Update: In addition to boiling my water for green tea, I also use a high-powered water filter, the Big Berkey. I’m not paid to say that, but that’s what I do!

If you’re interested, please have a look at my book!

Reference:

Claesson MJ, Jeffery IB, Conde S, Power SE, O’Connor EM, Cusack S, Harris HM, Coakley M, Lakshminarayanan B, O’Sullivan O, Fitzgerald GF, Deane J, O’Connor M, Harnedy N, O’Connor K, O’Mahony D, van Sinderen D, Wallace M, Brennan L, Stanton C, Marchesi JR, Fitzgerald AP, Shanahan F, Hill C, Ross RP, O’Toole PW. Gut microbiota composition correlates with diet and health in the elderly. Nature, 2012. 488(7410): p. 178‐84.

Ginaldi L, Loreto MF, Corsi MP, Modesti M, De Martinis M. Immunosenescence and infectious diseases. Microbes Infect. 2001 Aug;3(10):851-7.

Enck P, Zimmermann K, Rusch K, Schwiertz A, Klosterhalfen S, Frick JS. The effects of ageing on the colonic bacterial microflora in adults. Z Gastroenterol, 2009. 47(7): p. 653‐8.

Vrieze A, Van Nood E, Holleman F, Salojärvi J, Kootte RS, Bartelsman JF, Dallinga-Thie GM, Ackermans MT, Serlie MJ, Oozeer R, Derrien M, Druesne A, Van Hylckama Vlieg JE, Bloks VW, Groen AK, Heilig HG, Zoetendal EG, Stroes ES, de Vos WM, Hoekstra JB, Nieuwdorp M. Transfer of intestinal microbiota from lean donors increases insulin sensitivity in individuals with metabolic syndrome. Gastroenterology, 2012. 143(4): p. 913‐6 e7.

World Health Organization. Boil Water. January 2015. http://www.who.int/water_sanitation_health/dwq/Boiling_water_01_15.pdf

Blood Testing: What’s An Optimal Value For Triglycerides?

In terms of all-cause mortality risk, is the reference range for circulating triglycerides (TG, <150 mg/dL) optimal?

A meta-analysis of 38 studies in 360,556 subjects with a median age of 48y and a 12-year follow-up reported lowest all-cause mortality risk for subjects with TG values less than 90 mg/dL (equivalent to ~1 mmol; Liu et al. (2013)). As shown below, each successive 90 mg/dL increase was associated with a 12% higher all-cause mortality risk. A person with a value closer to the high end of the reference range, ~150 would have a ~7% increased mortality risk compared someone with a value ~90. In other words, there would be 7 more deaths per 100 total people at a TG value of 150, compared with the death rate for people with values less than 90.

tg mortal

Added importance for the association between TG values less than 90 with all-cause mortality risk come from studies of people who have lived longer than 100 years, centenarians. As shown below, triglyceride values less than 101 mg/dL have been reported in 9 of 11 centenarian studies:

tg mort

What’s my TG value? On my latest blood test (8/2015), it was 42. I’ve measured my TGs 11 times over the past 10 years-my average value for those measurements is 62. Based on the meta-analysis and centenarian data, that would put me in the lowest risk category for all-cause mortality.

tg mort

If you’re interested, please have a look at my book!

References

Arai Y, Hirose N, Yamamura K, Shimizu K, Takayama M, Ebihara Y, Osono Y. Serum insulin-like growth factor-1 in centenarians: implications of IGF-1 as a rapid turnover protein. J Gerontol A Biol Sci Med Sci. 2001 Feb;56(2):M79-82.

Baranowska B, Bik W, Baranowska-Bik A, Wolinska-Witort E, Szybinska A, Martynska L, Chmielowska M. Neuroendocrine control of metabolic homeostasis in Polish centenarians. J Physiol Pharmacol. 2006 Nov;57 Suppl 6:55-61.

Barbagallo CM, Averna MR, Frada G, Noto D, Cavera G, Notarbartolo A. Lipoprotein profile and high-density lipoproteins: subfractions distribution in centenarians. Gerontology 1998;44(2):106–10.

Bik W, Baranowska-Bik A, Wolinska-Witort E, Kalisz M, Broczek K, Mossakowska M, Baranowska B. Assessment of adiponectin and its isoforms in Polish centenarians. Exp Gerontol. 2013 Apr;48(4):401-7.

Chan YC, Suzuki M, Yamamoto S. Dietary, anthropometric, hematological and biochemical assessment of the nutritional status of centenarians and elderly people in Okinawa, Japan. J Am Coll Nutr. 1997 Jun;16(3):229-35.

Chan YC, Suzuki M, Yamamoto S. A comparison of anthropometry, biochemical variables and plasma amino acids among centenarians, elderly and young subjects. J Am Coll Nutr. 1999 Aug;18(4):358-65.

Liu J, Zeng FF, Liu ZM, Zhang CX, Ling WH, Chen YM. Effects of blood triglycerides on cardiovascular and all-cause mortality: a systematic review and meta-analysis of 61 prospective studies. Lipids Health Dis. 2013 Oct 29;12:159.

Magri F, Muzzoni B, Cravello L, Fioravanti M, Busconi L, Camozzi D, Vignati G, Ferrari E. Thyroid function in physiological aging and in centenarians: possible relationships with some nutritional markers. Metabolism. 2002 Jan;51(1):105-9.

Paolisso G, Ammendola S, Del Buono A, Gambardella A, Riondino M, Tagliamonte MR, Rizzo MR, Carella C, Varricchio M. Serum levels of insulin-like growth factor-I (IGF-I) and IGF-binding protein-3 in healthy centenarians: relationship with plasma leptin and lipid concentrations, insulin action, and cognitive function. J Clin Endocrinol Metab. 1997 Jul;82(7):2204-9.

Thillet J, Doucet C, Chapman J, Herbeth B, Cohen D, Faure-Delanef L. Elevated lipoprotein(a) levels and small apo(a) isoforms are compatible with longevity: evidence from a large population of French centenarians. Atherosclerosis 1998;136:389–94.

Vasto S, Scapagnini G, Rizzo C, Monastero R, Marchese A, Caruso C. Mediterranean diet and longevity in Sicily: survey in a Sicani Mountains population. Rejuvenation Res. 2012 Apr;15(2):184-8.

Willcox DC, Willcox BJ, Wang NC, He Q, Rosenbaum M, Suzuki M. Life at the extreme limit: phenotypic characteristics of supercentenarians in Okinawa. J Gerontol A Biol Sci Med Sci. 2008 Nov;63(11):1201-8.

Think Your Diet Is Paleo? Not If Your Potassium Intake Is Less Than…

The stereotype about the Paleo diet is that it is meat heavy. How much meat Paleo era-eaters ate is debatable, but that they consumed large amounts of potassium rich, plant-based foods is not! When examining 159 Stone Age diets, the average daily potassium intake has been reported to be 400 meq/day (Sebastian et al. 2006), as shown below:

potass

How much is 400 meq in milligrams (mg) of potassium? 1 meq = 39.1 mg of potassium, so to figure that out we multiply 400 *39.1, thereby yielding an average daily potassium intake of 15,640 mg/day! It’s important to note that this value is based on a 3000 calorie diet (Eaton et al. 1997). Dividing 15,640/3000 yields 5.21 mg potassium/calorie.

In contrast, as studied in 12,581 US adults, the average dietary potassium intake has been reported to be only ~2600 mg/day (Cogswell et al. 2012). Furthermore, only 1.4% of all subjects had potassium values greater than 4700 mg/day!

What’s my potassium intake? Shown below is my 7-day average intake from 8/29/2015-9/4/2015. The black rectangle in the lower right corner shows my average daily potassium intake to be 10,383 mg/day.

my potass

My average daily calorie intake during that week was 2193. In terms of mg potassium/calorie, my value is 4.73 (10,383/2193), which isn’t far from the reported average Paleo value. What’s yours?

For reference, shown below is a representative day during that week (Wednesday, September 2; 2251 calories) for what I ate.

my intake

If you’re interested, please have a look at my book!

References

Cogswell ME, Zhang Z, Carriquiry AL, Gunn JP, Kuklina EV, Saydah SH, Yang Q, Moshfegh AJ. Sodium and potassium intakes among US adults: NHANES 2003-2008. Am J Clin Nutr. 2012 Sep;96(3):647-57.

Eaton SB, Eaton SB 3rd, Konner MJ. Paleolithic nutrition revisited: A twelve-year retrospective on its nature and implications. Eur J Clin Nutr. 1997 Apr;51(4):207-16.

Sebastian A, Frassetto LA, Sellmeyer DE, Morris RC Jr. The evolution-informed optimal dietary potassium intake of human beings greatly exceeds current and recommended intakesSemin Nephrol. 2006 Nov;26(6):447-53.

Interpreting Blood Test Results (Serum Bicarbonate): What’s Optimal?

My approach to optimizing health and lifespan includes daily nutrient tracking and yearly blood testing. Once you get your blood test results back from the doctor, are your values optimal if you’re within the reference range? This article will examine the “optimal range” for 1 of these measurements, serum bicarbonate.

What does serum bicarbonate measure? The amount of bicarbonate in the blood is indicative of dietary acid load (Adeva and Souto 2011), systemic metabolism, lung and kidney function. First, a diet rich in animal products and grains (acid-forming), and poor in fruits and vegetables (base-forming) can induce a state of metabolic acidosis (Sebastian et al. 2001). Similarly, cellular metabolism produces carbon dioxide (CO2), a gas that is an acid. The lungs and kidneys act to remove systemic increases in acid load: CO2 reacts with water to form bicarbonate (H2CO3-), where it travels to the lung for excretion by exhaling it as CO2. The kidneys decrease acid load (whether from the diet or metabolism) by removing protons (H+) from the blood, followed by urinating the acid out of the body, and also by producing bicarbonate. In sum, serum bicarbonate is a measure of acid load: from the diet, by your body’s ability to produce it, by your kidney’s ability to buffer it, and by your lungs ability to remove it.

Low serum bicarbonate is indicative of increased systemic acidity, whereas a high serum bicarbonate indicates systemic alkalinity. If systemic acidity is high, bicarbonate will be consumed to neutralize the acid, thereby decreasing serum bicarbonate. Assuming that bicarbonate is not being consumed in the diet (via fruits and vegetables), the kidney would have to then produce bicarbonate to make up for the increase in bicarbonate consumption.

The reference range for serum bicarbonate is 20-30 mEq/L. My average serum bicarbonate value (y-axis) in 18 blood tests from 2015-2019 is 26.7 mEq/L (red line below):

bicarb.png

Also note that there is a weak trend (black line, R2=0.077) for my serum bicarbonate values to decrease over time.

Sure, these values are within the reference range, but what’s optimal?

In a study that included 31,590 subjects with average age of ~50 years, an average BMI <25 kg/m2, and a median follow up ~8 years, a serum bicarbonate value < 26 mEq/L, compared with 31 mEq/L, had a 46% significantly increased all-cause mortality risk (see below; Park et al. 2015).

bc 2

In contrast to these data, shown below are the findings of Raphael et al. 2013, who found no association between serum bicarbonate with mortality risk. In that study, 15,836 overweight (the BMI range average was from 26-29) subjects with an average age ~43 years were followed for ~9 years. Although an acidic serum bicarbonate value (<22, compared with 26-30 mEq/Las the reference) was associated with a 75% increased all-cause mortality risk, when excluding subjects with CKD from the analysis, that association was no longer statistically significant. However, it is important to note a similar trend (albeit non-significant) of association between acidic serum bicarbonate values with an increased mortality risk was present in those that did not have CKD.

stud2

Note that these 2 studies were performed in adults that were close to middle-age (43y, 50y). What does the data look like in older adults? In a study of 2,287 older adults (average age, 76y, Raphael et al. 2016), serum bicarbonate values less than 23 mEq/L were associated with significantly worse survival over a 10-year follow-up, when compared with values between 23-27.9 mEq/L. Also note that although survival looks worse for those that had bicarbonate values > 28 mEq/L, these data were not significantly different when compared with the 23-27 mEq/L group:

Screen Shot 2019-07-14 at 11.52.55 AM

In addition, lower values for serum bicarbonate in older adults are associated with an increased risk for future physical function limitation (Yenchek et al. 2014). In a study of 1,544 overweight (BMI ~27 kg/m2) older adults (average age, ~75 years), subjects that had lower values for serum bicarbonate (< 25.9 mEq/L) had an increased risk for future functional limitation over a 4-year follow-up period, when compared with subjects with that had higher values (greater than 26 mEq/L). It is important to note that age-related decreased kidney function leads to an inability to produce bicarbonate, thereby decreasing serum bicarbonate. However, after adjusting for the presence or absence of subjects with chronic kidney disease (CKD), the association between a more acidic serum bicarbonate value with future functional limitation remained. In other words, poor kidney function was not driving the effect of acidosis on risk for future functional limitation.

Screen Shot 2019-07-14 at 12.13.49 PM.png

Collectively, these data suggest that higher values for serum bicarbonate (> 26 mEq/L) may be optimal for health and longevity. When considering this, my average bicarbonate value of 26.7 mEq/L seems ok, for now. Note that in my data above, there is a weak trend toward lower values. I’m aware of it, and it continues to decrease over time, I’ll intervene!


If you’re interested, please have a look at my book!


References

Adeva MM, Souto G. Diet-induced metabolic acidosis. Clin Nutr. 2011 Aug;30(4):416-21.

Park M, Jung SJ, Yoon S, Yun JM, Yoon HJ. Association between the markers of metabolic acid load and higher all-cause and cardiovascular mortality in a general population with preserved renal function. Hypertens Res. 2015 Jun;38(6):433-8.

Raphael KL, Zhang Y, Wei G, Greene T, Cheung AK, Beddhu S. Serum bicarbonate and mortality in adults in NHANES III. Nephrol Dial Transplant. 2013 May;28(5):1207-13.

Raphael KL, Murphy RA, Shlipak MG, Satterfield S, Huston HK, Sebastian A, Sellmeyer DE, Patel KV, Newman AB, Sarnak MJ, Ix JH, Fried LF; Health ABC Study Bicarbonate Concentration, Acid-Base Status, and Mortality in the Health, Aging, and Body Composition Study. Clin J Am Soc Nephrol. 2016 Feb 5;11(2):308-16.

Sebastian A, Frassetto LA, Sellmeyer DE, Merriam RL, Morris RC Jr. Estimation of the net acid load of the diet of ancestral preagricultural Homo sapiens and their hominid ancestors. Am J Clin Nutr. 2002 Dec;76(6):1308-16.

Yenchek R, Ix JH, Rifkin DE, Shlipak MG, Sarnak MJ, Garcia M, Patel KV, Satterfield S, Harris TB, Newman AB, Fried LF; Health, Aging, and Body Composition Study. Association of serum bicarbonate with incident functional limitation in older adults. Clin J Am Soc Nephrol. 2014 Dec 5;9(12):2111-6.