In the first 45 minutes, discuss each of the biomarkers contained within Levine’s Biological Age calculator, Phenotypic Age.
After that, I answer questions from the audience and we discuss all things related to aging.

In the first 45 minutes, discuss each of the biomarkers contained within Levine’s Biological Age calculator, Phenotypic Age.
After that, I answer questions from the audience and we discuss all things related to aging.
Exactly 1 month ago, my first biological age measurement of 2020 was 32.75y (https://michaellustgarten.wordpress.com/2020/02/14/biological-age-32-75y-chronological-age-47y-first-2020-measurement/). When considering that my chronological age is 47y, that’s a 14 year improvement, but I wasn’t (and still aren’t) satisfied. When I sent my blood for analysis, I was battling a mild upper respiratory infection (cough, no fever), which likely raised my WBCs, thereby resulting in a higher biologic age. Also, I was experimenting with a higher intake of meat, eggs, and cheese, to see what affect that it would have on my circulating biomarkers. On that blood test in February, my creatinine levels were higher than my 2015-2020 average value, and if those foods were associated with circulating levels of creatinine, reducing them should also reduce creatinine, and accordingly, further improve my biological age. I also assumed that all other variables on Levine’s Phenotypic Age calculator would be unchanged.
On March 9 2020, I sent my blood for analysis so that I could calculate biological age with Levine’s PhenotypicAge. Almost exactly as expected, my WBCs (4.7 * 10^3 cells/microliter) were closer to my 2015-2020 average value (4.6), rather than the higher value (5.8) in my blood test last month. Similarly, reducing my intake of beef, eggs, and cheese brought creatinine from 1.08 to 0.97 mg/dL, which is closer to its 5-year average (0.94 mg/dL). As a result, I further reduced my biological age by 1.14 years to 31.61y, which is 15+ years younger than my chronological!

Because I track my diet every day, I can investigate the correlation between my meat, eggs, and cheese intake with creatinine. I now have 8 blood tests that correspond to dietary data, and interestingly, there is a moderately strong correlation between my average daily beef+egg+cheese intake with creatinine (r = 0.55). Based on these data, I’m going to continue to minimize consumption of these foods, with the goal of optimizing creatinine.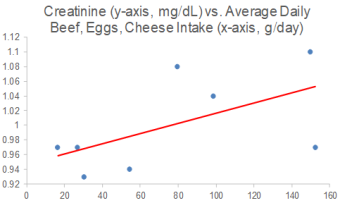
On a final note, I also expected to further reduce my CRP from 0.3 to something lower, but it slightly increased to 0.37 mg/L. While that is far from a high value, lower is better, and in future blood tests I’ll try to figure out how to further reduce it.
If you’re interested in calculating your biological age, here’s the Excel link:

Measurement of biological age with Levine’s Phenotypic Age calculator is strongly correlated with chronological age (r=0.94; see https://michaellustgarten.wordpress.com/2019/09/09/quantifying-biological-age/). In 2019, I measured all 9 of its analytes 3 times, with biological age readings of 35.39y, 35.58y, and 31.3y, for an average 2019 biological age of 34.09y (see https://michaellustgarten.wordpress.com/2019/11/01/biological-age-31-3y-chronological-age-46y/). That’s 12 years younger than my chronological age in 2019, 46y!
On Feb 12, I had my first blood test measurement of 2020. I expected to see a worse biological age, as over the past week, I’d been hit with the flu, and since my last measurement in 2019, I made a few changes to my diet that I didn’t expect to favorably affect it. In contrast, I’ve been purposefully in a mild caloric restriction in an attempt to reduce my body fat from a relatively lean 10-12% to lower values. Since my last blood test 3+ months ago, my average calorie intake was 2553, which is 5-10% less than my maintenance intake, 2700-2800 calories/day. So how did these variables affect my biologic age? Let’s have a look at the data!

My biological age was 32.75y, which is less than my 2019 average value, and better than I expected considering the factors mentioned above! Note that there is room for improvement, including my creatinine and WBC levels, which both increased when compared with my average 2015-2019 values (which included 23 blood tests). My average daily fiber intake has been ~100g/day for a few years, and over the past 3 months, I purposefully reduced that to ~70g/day. Conversely, I increased my intake of meat, eggs, and cheese intake during that period, to see if eating less fiber and more animal products would negatively impact my blood test results. For me, eating more animal protein and less total fiber may not be optimal, as my creatinine levels also rose in 2019 when I performed a similar dietary experiment. Note that creatinine levels increase with age (see https://michaellustgarten.wordpress.com/2019/11/18/optimizing-biologic-age-creatinine/), so if I can avoid that by altering my diet, I will. For the next blood test, I’ll reduce, but not eliminate my intake of meat, eggs, and cheese, and I expect that my creatinine levels will decrease back towards my average 2015-2019 value of 0.94 mg/dL.
Also note my WBCs-although they’re not higher than the 3.5-6 optimal range (see https://michaellustgarten.wordpress.com/2019/10/11/blood-testing-whats-optimal-for-wbc-levels/), they’re increased when compared with my average 2015-2019 value of 4.5. This increase is more than likely a result of the flu/infection that I’m battling. Once it passes, I expect it to return to close to my average WBC value, ~4.5.
Going forward, I expect my creatinine and WBCs to come down to their average values, which would result in a biological age that is closer to 30y on my next blood test. Stay tuned for that data!
To quantify your biological age using Levine’s Phenotypic Age calculator, here’s the Excel link! DNAmPhenoAge_gen (1)
If you’re interested, please have a look at my book!

On June 10, 2019 (for the first time) I measured all of the blood test variables that are included in the biologic age calculator, Phenotypic Age, and ended up with a biological age = 35.39y (https://michaellustgarten.wordpress.com/2019/09/09/quantifying-biological-age/).
While that value is 23% younger than my chronological age (46y), I knew that I could do better! So I tried again on September 17, 2019. Basically, the same biological age, 35.58y:

An 23% younger biological age on 2 separate dates, months apart might be good for most, but not for me. So, I tried again on October 29th, 2019, and voila, a biological age of 31.3y, which is 32% younger than my chronological age! How did I do it?

From my last blood test until my most recent blood test, I attempted a mild caloric restriction. To maintain my body weight, I require about 2800 calories per day, an amount which is based on daily body weight weighing in conjunction with daily dietary tracking. For the period of time that elapsed between my last 2 blood tests, I averaged 2657 calories/day, which is 3.2% less than the 2745 calories/day that I averaged for the dietary period that corresponded to my September blood test. That I was also in a very mild caloric restriction is confirmed by a reduction in my average body weight, which was (purposefully) down 0.7 lbs from September 17 to October 29th, when compared with the dietary period that corresponded to my September blood test (August 20 – September 17).
This is a superficial analysis of how I further reduced my biological age, but in future posts I’ll report the average dietary intake that corresponded to my relatively youthful biologic age!
If you’re interested, please have a look at my book!
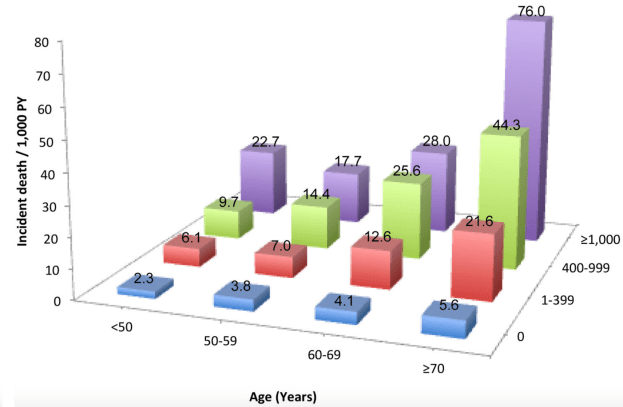
The coronary artery calcification (CAC) score is a measure of how much calcification is in the coronary arteries, and accordingly, is an in vivo measure of atherosclerosis. Why is the CAC score important? Besides its role in atherosclerosis, risk of death for all causes goes up at any age as the CAC score increases. For ex., in people younger than 50 (left side below), as the CAC score increases from 0 to 1-399, 400-999, and > 1000, risk of death for all causes increases by ~10-fold, from 2.3 per 1000 person years (PY) to 6.1/1000, 9.7/1000, and 22.7/1000. Similarly, for people older than 70y (right side below), as the CAC score increases, baseline all-cause mortality risk increases ~15-fold, from 5.6/1000 to 21.6/1000, 44.3/1000, and 76/1000, respectively (Hartaigh et al. 2016):

Are blood biomarkers associated with CAC? When the CAC score was elevated, a greater percentage of white blood cells (WBCs) that were neutrophils and the red blood cell distribution width (RDW%) were higher, whereas lower CAC scores were associated with higher levels for the fraction of lymphocytes divided by total WBCs and higher total red blood cells (den Harder et al. 2018):

In agreement with these data, CAC scores > 100 were associated with a higher RDW% (13.0%) and a higher neutrophil/lymphocyte ratio (NLR; 1.54), when compared with CAC < 100 (RDW = 12.8%; NLR = 1.39; Gürel et al. 2019).
The findings that a higher RDW% and higher levels of neutrophils, but lower levels of lymphocytes are associated with a higher CAC score is in agreement with the data for how these variables change with aging and their associations with all-cause mortality risk. First, note that I previously reported that RDW% increases during aging and is associated with an increased risk of death from all causes (https://michaellustgarten.wordpress.com/2019/09/25/optimizing-biological-age-rdw/). Similarly, neutrophils increase, whereas lymphocytes decrease, thereby leading to a higher neutrophil/lymphocyte ratio during aging, which is associated with an increased all-cause mortality risk (https://michaellustgarten.wordpress.com/2019/10/10/neutrophil-lymphocyte-ratio-and-survival/).
If you’re interested, please have a look at my book!
References
den Harder AM, de Jong PA, de Groot MCH, Wolterink JM, Budde RPJ, Iŝgum I, van Solinge WW, Ten Berg MJ, Lutgens E, Veldhuis WB, Haitjema S, Hoefer IE, Leiner T. Commonly available hematological biomarkers are associated with the extent of coronary calcifications. Atherosclerosis. 2018 Aug;275:166-173. doi: 10.1016/j.atherosclerosis.2018.06.017.
Gürel OM, Demircelik MB, Bilgic MA, Yilmaz H, Yilmaz OC, Cakmak M, Eryonucu B. Association between Red Blood Cell Distribution Width and Coronary Artery Calcification in Patients Undergoing 64-Multidetector Computed Tomography. Korean Circ J. 2015 Sep;45(5):372-7. doi: 10.4070/kcj.2015.45.5.372.
Hartaigh BÓ, Valenti V, Cho I, Schulman-Marcus J, Gransar H, Knapper J, Kelkar AA, Xie JX, Chang HJ, Shaw LJ, Callister TQ, Min JK. 15-Year prognostic utility of coronary artery calcium scoring for all-cause mortality in the elderly. Atherosclerosis. 2016 Mar;246:361-6. doi: 10.1016/j.atherosclerosis.2016.01.039.

Can biological age be optimized? The red blood cell (RBC) distribution width (RDW%) is one of the variables included in the PhenoAge biological age calculator (see https://michaellustgarten.wordpress.com/2019/09/09/quantifying-biological-age/). Although the RDW% reference range is 11.5% – 14.5%, what values are optimal in terms a youthful biological age, and minimized disease risk?
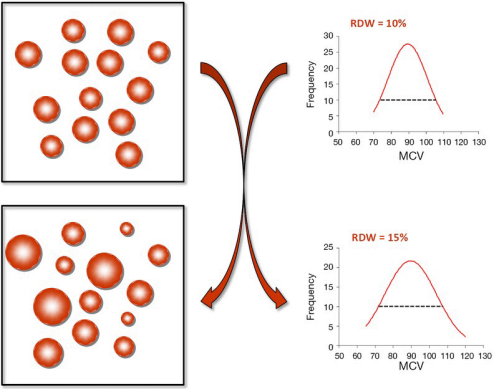
First, let’s define RDW%. RDW% is calculated by dividing the standard deviation of the average mean corpuscular volume (i.e. the average volume inside red blood cells, defined as MCV, upper right panel; image via Danese et al. 2015). When the volume inside red blood cells is approximately the same across all RBCs (upper left panel), the RDW% will be narrow, as shown by the dashed line in the upper right panel. Conversely, during aging and in many diseases, the size and volume of RBCs are altered, resulting in a more broad RDW% (bottom left and right panels):
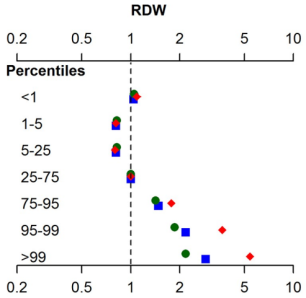
In terms of RDW%, what’s optimal for health and longevity? In the the largest study (3,156,863 subjects) that investigated the association for risk of death for all causes with RDW%, maximally reduced risk of death was observed for RDW% between 11.4 – 12.5% (percentiles 1-5, 5-25), with mortality risk increasing for values < 11.3%, and > 12.6% (Tonelli et al. 2019):
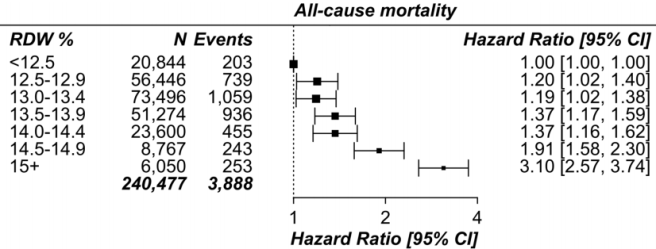
This has been confirmed in other relatively large studies (240,477 subjects), as RDW% values < 12.5% were associated with maximally reduced all-cause mortality risk, with values > 12.5 associated with an increasing all-cause mortality risk (Pilling et al. 2018):
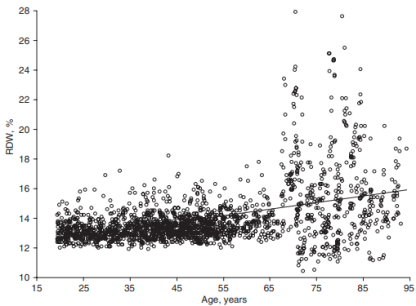
How does RDW% change during aging? For the 1,907 subjects of Lippi et al. (2014), RDW% increased during aging:
In support of this finding, RDW% also increased during aging in a larger study that included 8,089 subjects (Hoffmann et al. 2015).
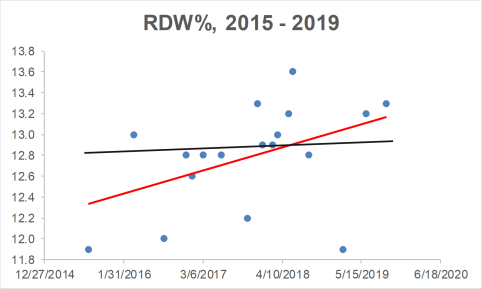
Collectively, when considering the all-cause mortality and aging data, RDW% values ~ 12.5% may be optimal for health and longevity. What are my RDW% values? Plotted below are 18 RDW% measurements since 2015 (blue circles). First, note my average RDW% during that time (black line) is 12.8%, which isn’t far from the 12.5% that may be optimal for health and longevity. However, note the trend line (red), which indicates that my RDW% values are increasing during aging!
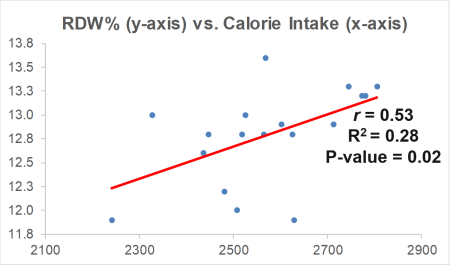
How do I plan on reducing my RDW%? A moderate strength correlation exists between my calorie intake with RDW% (r = 0.53), with a higher daily average calorie intake being associated with a higher RDW%:
My plan is to shoot for a daily calorie intake ~2600 over the next month, and then retest my RDW% (and the rest of the CBC). Hopefully that brings my RDW% down to 12.5% or less. If that doesn’t work, I’ll re-calibrate, and try something else!
If you’re interested, please have a look at my book!
References
Danese E, Lippi G, Montagnana M. Red blood cell distribution width and cardiovascular diseases. J Thorac Dis. 2015 Oct;7(10):E402-11. doi: 10.3978/j.issn.2072-1439.2015.10.04.
Hoffmann JJ, Nabbe KC, van den Broek NM. Red cell distribution width and mortality in older adults: a meta-analysis. Clin Chem Lab Med. 2015 Nov;53(12):2015-9. doi: 10.1515/cclm-2015-0155.
Lippi G, Salvagno GL, Guidi GC. Red blood cell distribution width is significantly associated with aging and gender. Clin Chem Lab Med. 2014 Sep;52(9):e197-9. doi: 10.1515/cclm-2014-0353.
Pilling LC, Atkins JL, Kuchel GA, Ferrucci L, Melzer D. Red cell distribution width and common disease onsets in 240,477 healthy volunteers followed for up to 9 years. PLoS One. 2018 Sep 13;13(9):e0203504. doi: 10.1371/journal.pone.0203504.
Tonelli M, Wiebe N, James MT, Naugler C, Manns BJ, Klarenbach SW, Hemmelgarn BR. Red cell distribution width associations with clinical outcomes: A population-based cohort study. PLoS One. 2019 Mar 13;14(3):e0212374. doi: 10.1371/journal.pone.0212374.
