Tag Archives: Neutrophils

How Much Oxalate Is Too Much? n=1 Analysis

Join us on Patreon! https://www.patreon.com/MichaelLustgartenPhD

Papers referenced in the video:

Dietary oxalate to calcium ratio and incident cardiovascular events: a 10-year follow-up among an Asian population https://pubmed.ncbi.nlm.nih.gov/35346210/

Predicting Age by Mining Electronic Medical Records with Deep Learning Characterizes Differences between Chronological and Physiological Age https://www.ncbi.nlm.nih.gov/pmc/articles/PMC5716867/

Association between low-density lipoprotein cholesterol and cardiovascular mortality in statin non-users: a prospective cohort study in 14.9 million Korean adults https://pubmed.ncbi.nlm.nih.gov/35218344/

Joint distribution of lipoprotein cholesterol classes. The Framingham study) AND abbott lipoproteins 1983 https://pubmed.ncbi.nlm.nih.gov/6573877/

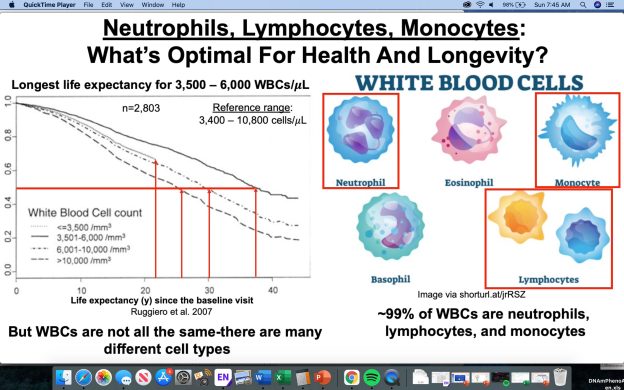
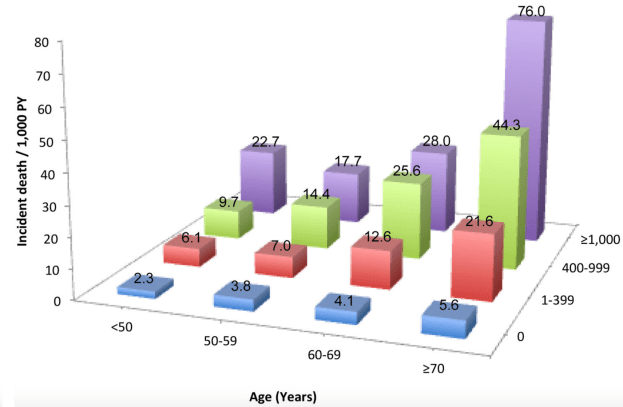
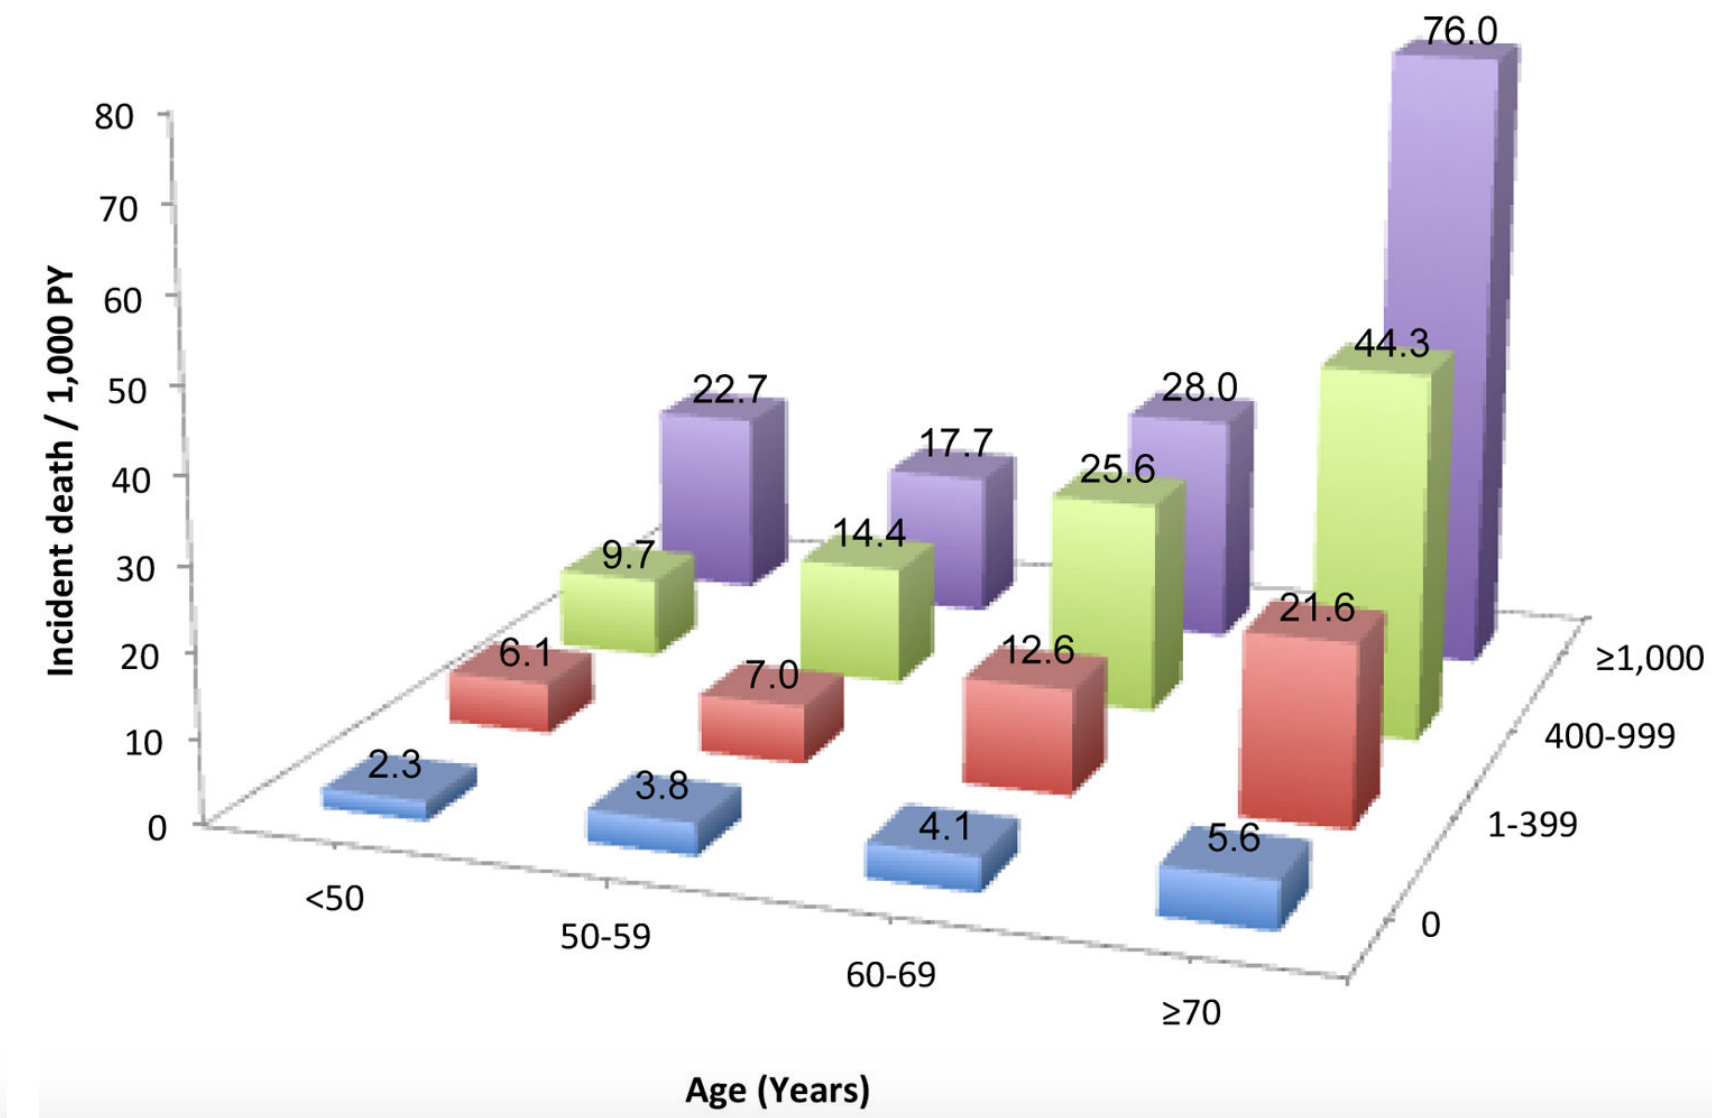
Incidental lymphopenia and mortality: a prospective cohort study https://pubmed.ncbi.nlm.nih.gov/31932337/

Blood counts in adult and elderly individuals: defining the norms over eight decades of life https://pubmed.ncbi.nlm.nih.gov/32030733/

Effect of Aging on Serum Uric Acid Levels: Longitudinal Changes in a Large Japanese Population Group https://pubmed.ncbi.nlm.nih.gov/12242321/

Liver enzymes and risk of all-cause mortality in general populations: a systematic review and meta-analysis. https://pubmed.ncbi.nlm.nih.gov/24585856/

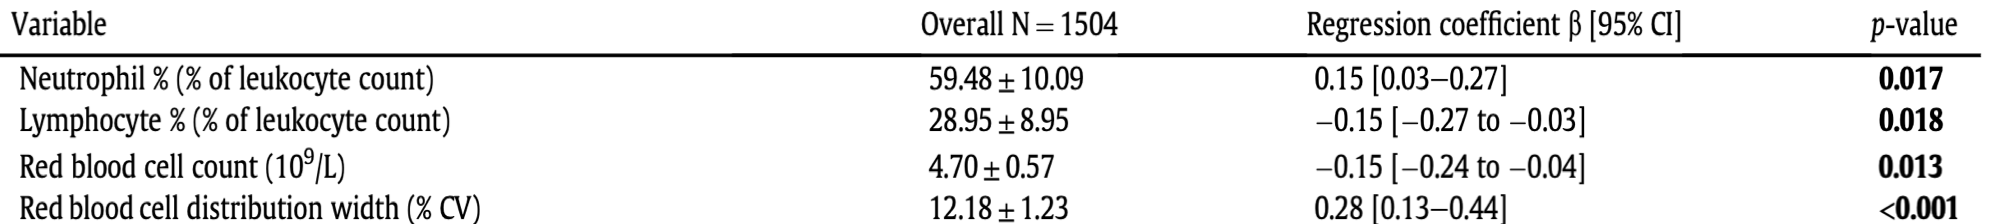
Increased red blood cell distribution width (RDW) is associated with higher glycosylated hemoglobin (HbA1c) in the elderly https://pubmed.ncbi.nlm.nih.gov/25651746/

Advertisement

Neutrophils, Lymphocytes, Monocytes: What’s Optimal For Health And Longevity?

White blood cells (WBCs) comprise many different cell types, including neutrophils, lymphocytes, monocytes, eosinophils, and basophils.

Neutrophils, lymphocytes, and monocytes account for ~99% of WBCs, and accordingly, in the video I propose optimal ranges for these cell types in terms of health and longevity.

Circulating Biomarkers Associated With Coronary Artery Calcification

The coronary artery calcification (CAC) score is a measure of how much calcification is in the coronary arteries, and accordingly, is an in vivo measure of atherosclerosis. Why is the CAC score important? Besides its role in atherosclerosis, risk of death for all causes goes up at any age as the CAC score increases. For ex., in people younger than 50 (left side below), as the CAC score increases from 0 to 1-399, 400-999, and > 1000, risk of death for all causes increases by ~10-fold, from 2.3 per 1000 person years (PY) to 6.1/1000, 9.7/1000, and 22.7/1000. Similarly, for people older than 70y (right side below), as the CAC score increases, baseline all-cause mortality risk increases ~15-fold, from 5.6/1000 to 21.6/1000, 44.3/1000, and 76/1000, respectively (Hartaigh et al. 2016):

Screen Shot 2019-10-20 at 8.40.05 AM.png

Are blood biomarkers associated with CAC? When the CAC score was elevated, a greater percentage of white blood cells (WBCs) that were neutrophils and the red blood cell distribution width (RDW%) were higher, whereas lower CAC scores were associated with higher levels for the fraction of lymphocytes divided by total WBCs and higher total red blood cells (den Harder et al. 2018):

n l rdw cac

In agreement with these data, CAC scores > 100 were associated with a higher RDW% (13.0%) and a higher neutrophil/lymphocyte ratio (NLR; 1.54), when compared with CAC < 100 (RDW = 12.8%; NLR = 1.39; Gürel et al. 2019).

The findings that a higher RDW% and higher levels of neutrophils, but lower levels of lymphocytes are associated with a higher CAC score is in agreement with the data for how these variables change with aging and their associations with all-cause mortality risk. First, note that I previously reported that RDW% increases during aging and is associated with an increased risk of death from all causes (https://michaellustgarten.wordpress.com/2019/09/25/optimizing-biological-age-rdw/). Similarly, neutrophils increase, whereas lymphocytes decrease, thereby leading to a higher neutrophil/lymphocyte ratio during aging, which is associated with an increased all-cause mortality risk (https://michaellustgarten.wordpress.com/2019/10/10/neutrophil-lymphocyte-ratio-and-survival/).

If you’re interested, please have a look at my book!

References

den Harder AM, de Jong PA, de Groot MCH, Wolterink JM, Budde RPJ, Iŝgum I, van Solinge WW, Ten Berg MJ, Lutgens E, Veldhuis WB, Haitjema S, Hoefer IE, Leiner T. Commonly available hematological biomarkers are associated with the extent of coronary calcifications. Atherosclerosis. 2018 Aug;275:166-173. doi: 10.1016/j.atherosclerosis.2018.06.017.

Gürel OM, Demircelik MB, Bilgic MA, Yilmaz H, Yilmaz OC, Cakmak M, Eryonucu B. Association between Red Blood Cell Distribution Width and Coronary Artery Calcification in Patients Undergoing 64-Multidetector Computed TomographyKorean Circ J. 2015 Sep;45(5):372-7. doi: 10.4070/kcj.2015.45.5.372.

Hartaigh BÓ, Valenti V, Cho I, Schulman-Marcus J, Gransar H, Knapper J, Kelkar AA, Xie JX, Chang HJ, Shaw LJ, Callister TQ, Min JK. 15-Year prognostic utility of coronary artery calcium scoring for all-cause mortality in the elderly. Atherosclerosis. 2016 Mar;246:361-6. doi: 10.1016/j.atherosclerosis.2016.01.039.

Sarcopenia, Disease Risk, And The Neutrophil/Lymphocyte Ratio

In an earlier post, based on data from the Baltimore Longitidunal Study on Aging (BLSA), I suggested that total white blood cell (WBCs) counts between 3500 to 6000 cells per microliter of blood may be optimal for reducing disease risk and for maximizing longevity (https://michaellustgarten.wordpress.com/2015/08/13/blood-testing-whats-optimal-for-wbc-levels/).

However, within WBCs, neutrophils increase, whereas lymphocytes decrease during aging (Ruggiero et al. 2007, Starr and Dreary 2011). As a result, the ratio between neutrophils with lymphocytes (NLR) increases during aging from ~1.5 in 20 year olds to ~1.8 in adults older than 75y (Li et al. 2015):

Screen Shot 2019-10-06 at 3.40.06 PM

An increased neutrophil/lymphocyte ratio during aging may be bad for health and disease risk. First, a higher neutrophil/lymphocyte ratio is associated with sarcopenia (defined as the age-related loss of muscle mass and physical function) in older adults (average age, 72y; Öztürk et al. 2018):

Screen Shot 2019-09-13 at 7.46.06 AM

Second, risk of death for all causes is significantly increased for older adults (average age, 66y) that had higher NLR values (60-80%, >80%, equivalent to NLR = 1.92-2.41, > 2.41), when compared with lower NLR values (< 20%, 20-40%, 40-60%, equivalent to NLR < 1.90; Fest et al. 2019):

nlr

Similarly, all-cause mortality risk was 30% increased in older adults (average age, 54y) that had NLR values > 1.77, when compared with < 1.77, and 40% increased for NLR values > 2.15, when compared with < 2.15 (Kime et al. 2018).

What are my NLR values? Over 17 blood test measurements from 2015 – 2019, my average NLR is 1.11. So far so good!

nlr


If you’re interested, please have a look at my book!


References

Fest J, Ruiter TR, Groot Koerkamp B, Rizopoulos D, Ikram MA, van Eijck CHJ, Stricker BH. The neutrophil-to-lymphocyte ratio is associated with mortality in the general population: The Rotterdam Study. Eur J Epidemiol. 2019 May;34(5):463-470.

Kim S, Eliot M, Koestler DC, Wu WC, Kelsey KT. Association of Neutrophil-to-Lymphocyte Ratio With Mortality and Cardiovascular Disease in the Jackson Heart Study and Modification by the Duffy Antigen Variant. JAMA Cardiol. 2018 Jun 1;3(6):455-462. doi: 10.1001/jamacardio.2018.1042.

Li J, Chen Q, Luo X, Hong J, Pan K, Lin X, Liu X, Zhou L, Wang H, Xu Y, Li H, Duan C. Neutrophil-to-Lymphocyte Ratio Positively Correlates to Age in Healthy PopulationJ Clin Lab Anal. 2015 Nov;29(6):437-43. doi: 10.1002/jcla.21791.

Öztürk ZA, Kul S, Türkbeyler İH, Sayıner ZA, Abiyev A. Is increased neutrophil lymphocyte ratio remarking the inflammation in sarcopenia? Exp Gerontol. 2018 Sep;110:223-229.

Ruggiero C, Metter EJ, Cherubini A, Maggio M, Sen R, Najjar SS, Windham GB, Ble A, Senin U, Ferrucci L. White blood cell count and mortality in the Baltimore Longitudinal Study of AgingJ Am Coll Cardiol. 2007 May 8;49(18):1841-50.

Starr JM, Deary IJ. Sex differences in blood cell counts in the Lothian Birth Cohort 1921 between 79 and 87 years. Maturitas. 2011 Aug;69(4):373-6.