
1 Lb Raw Carrot Challenge (New Champion!)
Leave a reply
With use of a food scale, I’ve been tracking my daily macro- and micronutrient intake every day since April 2015. In addition, I have 15 blood test measurements during that period, and accordingly, I’m able to examine correlations between my dietary intake with my circulating biomarkers. In this post, I’ll address the question, is my dietary cholesterol intake significantly correlated with plasma levels of cholesterol?
1. Plasma levels of total cholesterol vs. dietary cholesterol:

In the plot we see a borderline significant (p = 0.06), moderate correlation (r = 0.5) between my plasma total cholesterol with my dietary cholesterol intake. However, note that total cholesterol is comprised of “good” and “bad” parts, with HDL as the “good”, and with non-HDL cholesterol, including LDL and VLDL, as the “bad”. What does that data look like?
2. Plasma levels of non-HDL (LDL+VLDL) cholesterol vs. dietary cholesterol:
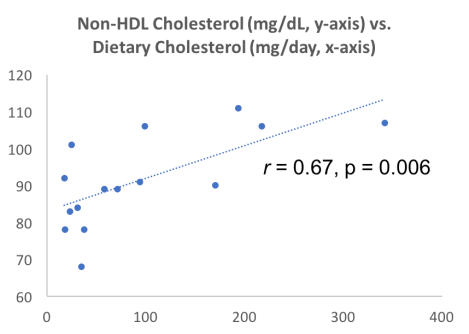
In the plot we see a highly significant (p = 0.006), strong correlation (r = 0.67) between my non-HDL cholesterol levels with my dietary cholesterol intake. It’s not possible to show causation via correlation, but this data suggests that my dietary cholesterol intake may be driving increased levels of non-HDL cholesterol.
3. Plasma levels of HDL cholesterol vs. dietary cholesterol:
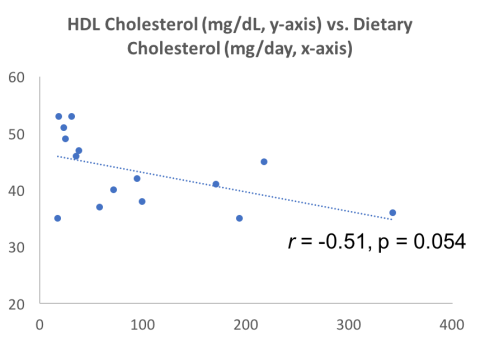
In the plot, first note that in contrast with the positive correlations between total and non-HDL cholesterol with my dietary cholesterol intake, the correlation between HDL with my dietary cholesterol intake is negative (i.e., going in the opposite direction; r = 0.51), and borderline significant (p = 0.054).
Cumulatively, it looks like my dietary cholesterol intake may be related to increased “bad” cholesterol and decreased “good” cholesterol. As a limitation of this approach, although I’ve shown blood test data for 15 measurements (which is a decent sample size), I only have 4 measurements with an average daily cholesterol intake around 200 mg or greater. In the near future, I expect to average 200 mg of daily cholesterol (or more) per day, so let’s see if these correlations hold up!
If you’re interested, please have a look at my book!

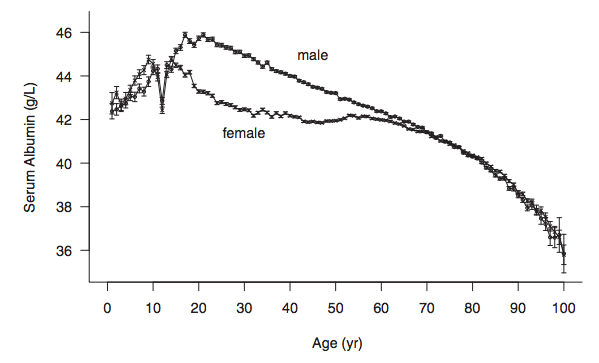
Levels of serum albumin peak at about 20 years old (~4.6 g/dL for males, ~4.4 g/dL for females), then decrease during aging, as shown for the 1,079,193 adults of Weaving et al. (2016):
Similar age-related decreases for serum albumin albumin have also been reported in smaller studies: Gom et al. 2007 (62,854 subjects); Dong et al. 2010 (2,364 subjects); Le Couteur et al. 2010 (1,673 subjects); Dong et al. 2012 (1,489 subjects).
Why is it important that serum levels of albumin decrease during aging? Reduced levels of albumin are associated with an increased risk of death from all causes. For example, in the 1,704,566 adults of Fulks et al. 2010, serum albumin levels > 4.4 g/dL and 4.5 g/dL for females and males, respectively, were associated with maximally reduced risk of death from all causes, regardless of age (younger than 50y, 50-69y, or 70y+):

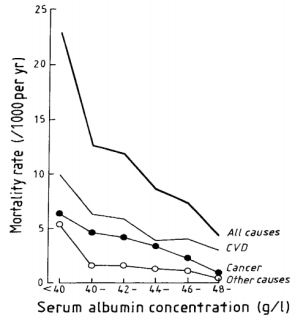
The association between reduced levels of serum albumin with an increased risk of death from all causes have also been found in smaller studies. In a ~9 year study of 7,735 men (age range, 40-59y), when serum albumin was less than 4 g/dL, the mortality rate was 23/1000/per year, compared with 4/1000/per year for subjects with values greater than 4.8 g/dL (Phillips et al. 1989):
Similarly, in older adults (average age, ~80y, 672 subjects), serum albumin levels greater than 4.5 g/dL (equivalent to 45 g/L) were associated with significantly reduced all-cause mortality risk, when compared with compared with < 4.1 g/dL (equivalent to 41 g/L, Takata et al. 2010):

Decreased levels of serum albumin (less than 4 g/dL) being associated with an increased all-cause mortality risk was also identified in a 12-year study of 287 older adults (average age, ~75y, Sahyoun et al. 1996).
Can the age-related decrease in serum albumin be minimized, or prevented? Shown below is my data for serum albumin since 2005, when I was 32y:
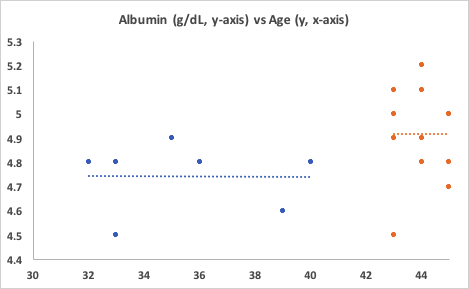
First, note the period from when I was 32y until 40y. No age-related decrease! My average albumin value over 7 measurements was 4.74 g/dL. Unfortunately, I didn’t track my dietary info during that time.
Also note the period from 43y to 45y. First, my albumin levels are significantly higher than the first period, 4.92 g/dL (p=0.027)! Second, again note the absence of an age-related decrease. Based on the data of Weaving et al. (2016), my albumin levels should be around 4.4 g/dL, but I’ve got them going in the opposite direction! How have I been able to do that?
Since April 2015, with use of a food scale, I’ve been tracking my daily dietary intake, including macro and micronutrients (54 variables). For each orange data point in the second period, I have an average dietary intake for each of the 54 variables that I can use to correlate with serum albumin. Based on that data, I can make an educated guess at what could potentially increase, or decrease it.
Of the 54 dietary variables that I track, only 3 were significantly correlated with albumin: positive associations for alpha-carotene (r = 0.66, p = 0.027), beta-carotene (r = 0.75, p =0.007), and a negative association for Vitamin K (r = -0.64, p = 0.03). Shown below is the strongest correlation of the three, beta-carotene, vs. serum albumin.

The majority of my alpha and beta-carotene intake comes from carrots, with a smaller amount coming from butternut squash. Interestingly, beta-cryptoxanthin, a Vitamin A metabolite that is abundant in butternut squash, was not significantly associated with serum albumin. Butternut squash is also a good source of alpha- and beta-carotene, so if butternut squash was driving the correlation between the carotenes with albumin, I’d expect beta-crypoxanthin to also be significantly associated with it. However, since it’s not, carrots are the most likely source driving the association. Also note that the my average intake of Vitamin K is dramatically higher (1410 mcg; range, 1080-2203 mcg) than the RDA or AI, which are ~100-120 mcg/day. The negative association between my Vitamin K intake with albumin suggests that I should keep it closer to 1100 mcg/day to potentially keep my albumin levels high.
If you’re interested, please have a look at my book!
References
Dong MH, Bettencourt R, Barrett-Connor E, Loomba R. Alanine aminotransferase decreases with age: the Rancho Bernardo Study. PLoS One. 2010 Dec 8;5(12):e14254.
Dong MH, Bettencourt R, Brenner DA, Barrett-Connor E, Loomba R. Serum levels of alanine aminotransferase decrease with age in longitudinal analysis. Clin Gastroenterol Hepatol. 2012 Mar;10(3):285-90.e1.
Gom I, Fukushima H, Shiraki M, Miwa Y, Ando T, Takai K, Moriwaki H. Relationship between serum albumin level and aging in community-dwelling self-supported elderly population. J Nutr Sci Vitaminol (Tokyo). 2007 Feb;53(1):37-42.
Dong MH, Bettencourt R, Barrett-Connor E, Loomba R. Alanine aminotransferase decreases with age: the Rancho Bernardo Study. PLoS One. 2010 Dec 8;5(12):e14254.
Fulks M, Stout RL, Dolan VF. Albumin and all-cause mortality risk in insurance applicants. J Insur Med. 2010;42(1):11-7.
Le Couteur DG, Blyth FM, Creasey HM, Handelsman DJ, Naganathan V, Sambrook PN, Seibel MJ, Waite LM, Cumming RG. The association of alanine transaminase with aging, frailty, and mortality. J Gerontol A Biol Sci Med Sci. 2010 Jul;65(7):712-7.
Phillips A, Shaper AG, Whincup PH. Association between serum albumin and mortality from cardiovascular disease, cancer, and other causes. Lancet. 1989 Dec 16;2(8677):1434-6.
Sahyoun NR, Jacques PF, Dallal G, Russell RM. Use of albumin as a predictor of mortality in community dwelling and institutionalized elderly populations. J Clin Epidemiol. 1996 Sep;49(9):981-8.
Takata Y, Ansai T, Soh I, Awano S, Sonoki K, Akifusa S, Kagiyama S, Hamasaki T, Torisu T, Yoshida A, Nakamichi I, Takehara T. Serum albumin levels as an independent predictor of 4-year mortality in a community-dwelling 80-year-old population. Aging Clin Exp Res. 2010 Feb;22(1):31-5.
Weaving G, Batstone GF, Jones RG. Age and sex variation in serum albumin concentration: an observational study. Ann Clin Biochem. 2016 Jan;53(Pt 1):106-11.
My goal is to break the world record for lifespan, 122 years, which is currently held by Jean Calment. How do I plan to do that? A good start would be calorie restriction (CR), a diet where you eat 10-30%+ less calories than your normal intake. CR is the gold standard for increasing lifespan in a variety of organisms, including yeast, flies, worms, and rodents (McDonald et al. 2010).
With the goal of maximizing my health and lifespan, in April 2015, I started a CR diet. Inherent in that was weighing all my food and recording it on an online website that tracks macro-and micro-nutrients. From then until March 2016, I was pretty good at keeping my calories relatively low, as I averaged 2302 calories. However, since 3/2016, it’s been exceedingly difficult to keep my calories that low, as I’ve averaged 2557 calories/day. So is having a higher calorie intake worse for my lifespan goal than a lower calorie intake?
Maybe not. In addition to tracking my daily nutrition since 2015, I’ve also had regular blood testing performed. I’ve measured the typical things that you get at a yearly checkup, including the lipid profile (triglycerides, total cholesterol, LDL, HDL, VLDL) markers of kidney and liver function (BUN, creatinine, uric acid, and ALT, AST, respectively), and the complete blood count (red and white blood cells, and their differentials). By tracking my daily nutrition and circulating biomarkers, I’m able to quickly intervene on any potential aging and disease-related mechanisms by using my diet to optimize my circulating biomarkers.
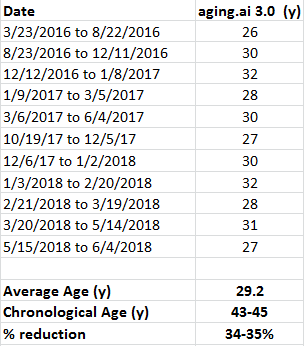
On my quest for optimal health and lifespan, biological age is more important than my chronological age (I’m 46y). So what’s my biological age? Between 2016-2019, the group at Insilico Medicine published 2 papers that included circulating biomarker data from more than 200,000 people (Putin et al. 2015, Mamoshina et al. 2018) to derive a biological age predictor (aging.ai). So what’s my biological age?
Shown below is my predicted biological age over 13 blood tests from 3/2016 to 6/2019:

Although I wasn’t on a CR diet during that time, my average biological age was 29.2 years, which is ~34% younger than my chronological age. Would my biological age be even younger with a lower calorie intake? I’m working on reducing my calorie intake again (it’s not easy for me), so stay tuned for that!
Here are the my biomarker values corresponding to each blood test, for anyone who wants to double check the results:

References
Mamoshina P, Kochetov K, Putin E, Cortese F, Aliper A, Lee WS, Ahn SM, Uhn L, Skjodt N, Kovalchuk O, Scheibye-Knudsen M, Zhavoronkov A. Population specific biomarkers of human aging: a big data study using South Korean, Canadian and Eastern European patient populations. J Gerontol A Biol Sci Med Sci. 2018 Jan 11.
McDonald RB, Ramsey JJ. Honoring Clive McCay and 75 years of calorie restriction research. J Nutr. 2010 Jul;140(7):1205-10.
Putin E, Mamoshina P, Aliper A, Korzinkin M, Moskalev A, Kolosov A, Ostrovskiy A, Cantor C, Vijg J, Zhavoronkov A. Deep biomarkers of human aging: Application of deep neural networks to biomarker development. Aging (Albany NY). 2016 May;8(5):1021-33.
If you’re interested, please have a look at my book:
Sean Manaea threw a no-hitter last night, against arguably one of the best lineups in baseball. Post-no-hitter, the question is whether Manaea will ascend into becoming an elite starting pitcher, or will be go the way of pitchers like Philip Humber and Homer Bailey, who also threw a no-hitters, but had a hard time getting outs after that?
To answer this question, we’ll look at where Manaea’s been, and make a prediction about where he’s going. First, in Manaea’s 3-year career at Indiana State, he was solid, but not spectacular: 15-12, 3.13 ERA, 1.24 WHIP. Also note that he had a relatively high BB-rate: 3.9 BB/9 IP. Why is the BB-rate important? When ranking starting pitchers (SP) by IP in 2017, the average BB-rate for these pitchers was 2.5 BB/9IP, and only 4 of the top 20 had BB-rates higher than 3.1: Martinez (3.12), Verlander (3.15), Dickey (3.17), Gonzalez (3.54). I’ve chosen to focus on IP because true #1’s throw a lot of IP. For examples, see Sale, Kluber, Sherzer, Verlander. Can you be a #1 starter if you don’t throw around 200 IP? I don’t think so, and I’m even more old school than that: I think true #1’s should throw closer to 250 IP than 200 IP. Note that Manaea has never thrown more than 160IP in a single year, so whether he can get to 200 IP is currently unknown.
What about Manaea’s minor league career? When compared with his college career, it’s virtually identical. In the minors, he had a cumulative 16-9 record, 2.84 ERA, 1.25 WHIP, and 3.5 BB/9IP. Again, the BB-rate is too high, and also note that he didn’t throw more than 121 IP in any of his 3 minor league seasons. Stretching a SP from 120 IP/yr in the minors to 200 IP+ in the majors may be too much without increasing injury risk. For more on that, see (https://www.si.com/mlb/2018/02/19/young-pitcher-year-after-effect-report-card).
Prior to 2018, based on Manea’s performance in college and the minors, I’d would’ve projected that he’d become an average-to-slightly above average SP, but not a dominant #1. Pitchers who throw ~160 IP are closer to being #4 or #5 starters than #1s. The no-hitter argues against that, right? Also, note that Manaea’s BB-rate in 2018 is currently 1.5 BB/9IP. Granted, it’s a small sample size, 36IP, and whether Manaea can continue to keep the BB-rate that low in 2018 in unknown. But consider this: when average or slightly-above average pitchers ascend to becoming dominant #1s, the BB-rate is almost always dramatically reduced. For great examples of that, see Randy Johnson, Corey Kluber, and Clayton Kershaw.
So can Manaea keep the BB-rate low and throw 200 IP+? If he can, he will have ascended into becoming a dominant #1 in 2018.
Stats via http://thebaseballcube.com/players/profile.asp?ID=163027

In an earlier post I wrote about the association between elevated circulating levels of homocysteine with an increased risk of death from all causes (https://michaellustgarten.wordpress.com/2017/11/22/homocysteine-and-all-cause-mortality-risk/). I started to post updates in that link, but I’ve decided to move them to here.
As of 6/2018, I now have tracked dietary data (I weigh all my food and record the values in cronometer.com) that corresponds to 7 homocysteine measurements:

12/5/2017: Despite 42 days of 800 micrograms of supplemental folic acid, bringing my average daily folate intake to 2026 micrograms/day, my plasma homocysteine was essentially unchanged at 11.7 uMoL, when compared with my baseline value of 11.8 uMol.What’s next on the list to reduce it? Trimethylglycine, also known as betaine. I’m a proponent of using diet as a first strategy, and to increase my dietary betaine levels, I’ll eat beets and quinoa, bringing my daily betaine levels to ~500 mg/day. Let’s see how it turns out on my next blood test!
1/2/2018: ~500 mg/day of betaine from beets and quinoa did absolutely nothing to my homecysteine levels. In fact, it got worse (15.3 uMoL)! To test the hypothesis that it wasn’t enough betaine, next I tried 4 grams/day of betaine (also known as trimethylglycine, TMG).
2/20/18: Supplemental TMG did absolutely nothing in terms of reducing my homocysteine to values below baseline! Also note that there is evidence that TMG increases blood lipids, including LDL and triglycerides (TG; Olthof et al. 2005), and that’s exactly what it did to me. My average LDL and TG values since 2015 (11 measurements) are 77 and 50 mg/dL, respectively. On TMG, these values increased to 92 and 72 mg/dL, respectively, making them my highest values over 11 individual blood tests (with the exception of 1 day with an LDL of 93 mg/dL). Next, I tried a stack that included 50 mg of B6, 1000 mcg of B12, and 400 mcg of methylfolate, as supplementation with these B-vitamins has been shown to lower homocystine (Lewerin et al. 2003).
3/20/18: Finally, some progress! My homocysteine levels were reduced during the B-vitamin supplementation period. I’ve written it like that because I’m not sure if it was the B-vitamins that caused it. For example, in the image below, we see the correlation between my dietary B6 intake with homocysteine. The trendline is down, which I would expect if B6 supplementation actually is playing a role in reducing my homocysteine levels. However, note that the correlation between my dietary B6 levels with homocysteine is not very strong (r = .48), resulting in a moderate R2 of 0.23 (similar data was obtained for B12 and folate). With 5 blood test measurements corresponding to 5 dietary periods, if B6 is playing a role, I would expect a stronger correlation. Nonetheless, with more data, the correlation may strengthen, so stay tuned for that!

5/14/2018: I changed B6-B12-methylfolate supplements so that I’d only have to take pills from 1 bottle instead of from 3. That supplement, however, had 1.5 mg of B6 instead of the 50 mg that was in my original supplement. Less B6 didn’t result in a higher homocysteine value-in fact, it went down (slightly), from 10.8 to 10.6. If an increased amount of B6 was causing lower levels of homocysteine, I would’ve expected higher, not (barely) lower homocysteine levels. This suggests that maybe my B6 intake has nothing to do with my homocysteine levels.
6/4/2018: Despite no changes to my supplements, my homocysteine came down a little more, to 10.2. Interestingly, the correlation (r) between homocysteine with my total dietary (diet + supplements) intake of B6, B12, and methylfolate is 0.39, 0.68, 0.29, respectively. The correlation between my B12 intake with homocysteine looks moderately strong, whereas the correlations for B6 and folate are weak. Based on this data, it’s possible I had a mild B12 deficiency that was causing elevated homocysteine. Note that my average B12 intake, without supplements is ~8 mcg/day, which is more than 3-fold higher than the RDA.
In looking at the association between my dietary data with homocysteine, a stronger correlation (r = 0.91; R2 = 0.83) has emerged…for my protein intake! In other words, a higher protein intake is more strongly correlated with lower homocysteine than B12:

7/11/2018: To explore the strong association between my protein intake with homocysteine, I increased my protein intake from an average value of 104 g/day for the period that preceded my June measurement (5/15/2018 – 6/4/2018) to 136 g/day for the period up to my 7/11/2018 measurement (6/5/2018 – 7/10/2018). The result? Lower homocysteine, to 8.2 uMol/L! Interestingly, the correlation between my dietary protein intake with homocysteine remained strong (r = 0.86, R2 = 0.73, n = 7 measurements).
What about my B6, methyl-B12, methyl-folate stack? I’m still taking it, although it looks like methyl-B12 may be the only factor that is associated with my homocysteine levels. In support of that, the correlation between each with homocysteine is r = 0.02, 0.73, 0.36, respectively.
Because I now have my homocysteine < 9 umol/L, it may be time to optimize other variables (in addition to the metabolic panel and CBC). Stay tuned!
If you’re interested, please have a look at my book:
References
Lewerin C, Nilsson-Ehle H, Matousek M, Lindstedt G, Steen B. Reduction of plasma homocysteine and serum methylmalonate concentrations in apparently healthy elderly subjects after treatment with folic acid, vitamin B12 and vitamin B6: a randomised trial.vEur J Clin Nutr. 2003 Nov;57(11):1426-36.
Olthof MR, van Vliet T, Verhoef P, Zock PL, Katan MB. Effect of homocysteine-lowering nutrients on blood lipids: results from four randomised, placebo-controlled studies in healthy humans. PLoS Med. 2005 May;2(5):e135.
