Category Archives: Dietary Tracking

15+ Years Younger Than My Chronological Age: Blood Test #2 In 2020

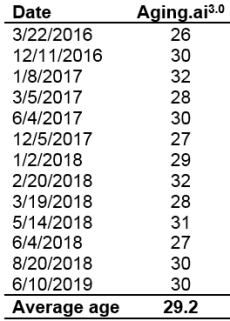
Exactly 1 month ago, my first biological age measurement of 2020 was 32.75y (https://michaellustgarten.wordpress.com/2020/02/14/biological-age-32-75y-chronological-age-47y-first-2020-measurement/). When considering that my chronological age is 47y, that’s a 14 year improvement, but I wasn’t (and still aren’t) satisfied. When I sent my blood for analysis, I was battling a mild upper respiratory infection (cough, no fever), which likely raised my WBCs, thereby resulting in a higher biologic age. Also, I was experimenting with a higher intake of meat, eggs, and cheese, to see what affect that it would have on my circulating biomarkers. On that blood test in February, my creatinine levels were higher than my 2015-2020 average value, and if those foods were associated with circulating levels of creatinine, reducing them should also reduce creatinine, and accordingly, further improve my biological age. I also assumed that all other variables on Levine’s Phenotypic Age calculator would be unchanged.

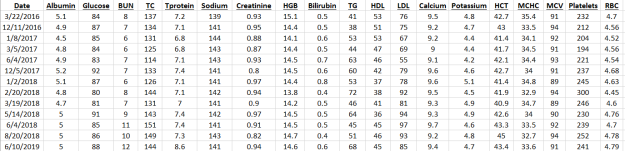
On March 9 2020, I sent my blood for analysis so that I could calculate biological age with Levine’s PhenotypicAge. Almost exactly as expected, my WBCs (4.7 * 10^3 cells/microliter) were closer to my 2015-2020 average value (4.6), rather than the higher value (5.8) in my blood test last month. Similarly, reducing my intake of beef, eggs, and cheese brought creatinine from 1.08 to 0.97 mg/dL, which is closer to its 5-year average (0.94 mg/dL). As a result, I further reduced my biological age by 1.14 years to 31.61y, which is 15+ years younger than my chronological!

pa 3.9.2020

Because I track my diet every day, I can investigate the correlation between my meat, eggs, and cheese intake with creatinine. I now have 8 blood tests that correspond to dietary data, and interestingly, there is a moderately strong correlation between my average daily beef+egg+cheese intake with creatinine (r = 0.55). Based on these data, I’m going to continue to minimize consumption of these foods, with the goal of optimizing creatinine.cr mec intake

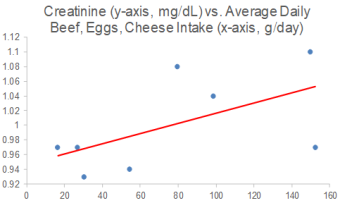
On a final note, I also expected to further reduce my CRP from 0.3 to something lower, but it slightly increased to 0.37 mg/L. While that is far from a high value, lower is better, and in future blood tests I’ll try to figure out how to further reduce it.

If you’re interested in calculating your biological age, here’s the Excel link:

DNAmPhenoAge_gen (1)


Uric acid: What’s optimal?

The reference range for uric acid is 4.0 – 8 mg/dL for men, and 2.5 – 7 mg/dL for women. Are these values optimal for health? To answer that question, let’s have a look at how circulating levels of uric acid change during aging, and their association with risk of death for all causes.

Uric acid increases during aging in both men and women. Kuzuya et al. (2002) studied how uric acid changes during a 10-year intervals for various birth cohorts, including 32yr olds, 39yr olds, 47yr olds, 56yr olds, and 65 yr olds (1960-1969, 1950-1959, 1940-1949, 1930-1939, 1920-1929 birth cohorts, respectively). For each birth cohort, uric acid levels increased during aging for men (left image below), whereas they increased for women starting at 40 years old:

Screen Shot 2020-01-06 at 7.18.04 AM

In terms of mortality risk, lowest risk of death for all causes was associated with uric acid levels of 5 – 7 mg/dL for men and 4 – 6 mg/dL for women in the 9,118 adults (average age, 43y) of Hu et al. (2019). Also note the U-shaped curve for both genders, whereas mortality risk increases at both low and high levels of uric acid:

Screen Shot 2020-01-05 at 2.55.00 PM.png

Similarly, the lowest risk of death for all causes was associated with uric acid levels of 7 mg/dL for men, and 4 mg/dL for women in the 375,163 adults (average age, 40y) of Cho et al. (2018), with mortality risk significantly increasing at uric levels < 3.5 and > 9.5 mg/dL for men, < 2.5 and > 7.5 mg/dL for women. Collectively, these 2 studies in middle-aged adults suggest that uric acid levels ~ 4 mg/dL for women and ~7 for men may be optimal for reducing risk of disease for all causes. It’s also important to note that both low and higher values are associated with an increased mortality risk.

The data for the Hu and Chu studies are in younger adults, so how does the data look in older adults? Lowest all-cause mortality risk was associated with uric acid levels between 4 – 5 mg/dL in the 121, 771 older adults (average age, 73y) of Tseng et al. (2018), with mortality risk significantly increasing below 4 and > 8:

Screen Shot 2020-01-05 at 2.43.46 PM.png

What are my uric acid levels? From 2016 to 2018, I measured it 15x, and although my average value of 5.2 mg/dL is not too low or too high in terms of an increased all-cause mortality risk, it increased during that 3-year period (R2 = 0.2886). When considering that uric acid increases during aging, can I reduce it with diet?

ua ml

Because I track my daily nutritional intake, I can look for correlations between my dietary intake with circulating biomarkers. Interestingly, a moderately strong correlation between my lycopene intake with uric acid (R2 = 0.3343, p=0.024) was present from 2016 to 2018:

ua vs lyco.png

Lycopene is found almost exclusively in tomatoes and watermelon. If these foods are related to my increasing levels of uric acid, if I ate less of them, I’d expect to see a corresponding decrease in uric acid. So, in 2019, I ate less of these foods, thereby reducing my average lycopene intake from 11,585 to 9,132 micrograms per day. How did that affect circulating levels of uric acid?

In 6 measurements for 2019, my average uric acid level was 4.6 mg/dL, a value that was significantly different (p=0.02) from the 2016-2018 average of 5.2 mg/dL. Whether eating less watermelon and tomatoes caused the decrease is unknown, but it’s good to know that uric acid can be potentially modified with dietary change!

my ua


If you’re interested, please have a look at my book!

References

Cho SK, Chang Y, Kim I, Ryu S. U-Shaped Association Between Serum Uric Acid Level and Risk of Mortality: A Cohort Study. Arthritis Rheumatol. 2018 Jul;70(7):1122-1132. doi: 10.1002/art.40472.

Hu L, Hu G, Xu BP, Zhu L, Zhou W, Wang T, Bao H, Cheng X. U-Shaped Association of Serum Uric Acid with All-cause and Cause-Specific Mortality in US Adults: A Cohort Study. J Clin Endocrinol Metab. 2019 Oct 25. pii: dgz068. doi: 10.1210/clinem/dgz068.

Kuzuya M, Ando F, Iguchi A, Shimokata H. Effect of aging on serum uric acid levelslongitudinal changes in a large Japanese population group. J Gerontol A Biol Sci Med Sci. 2002 Oct;57(10):M660-4.

Tseng WC, Chen YT, Ou SM, Shih CJ, Tarng DC; Taiwan Geriatric Kidney Disease (TGKD) Research Group. U-Shaped Association Between Serum Uric Acid Levels With Cardiovascular and All-Cause Mortality in the Elderly: The Role of Malnourishment. J Am Heart Assoc. 2018 Feb 10;7(4). pii: e007523. doi: 10.1161/JAHA.117.007523.

Ending Aging-Related Diseases 2019: Lustgarten Presentation

In the first half of this presentation, I talk about my contribution to the gut-muscle axis in older adults, and in the second half, my personalized approach to optimal health!

Also, here’s the article that corresponds to the presentation:
https://www.leafscience.org/the-gut-microbiome-affects-muscle-strength-in-older-adults/

If you’re interested, please have a look at my book!

Life Expectancy Increase (12-14 Years) With 5 Factors

Following five lifestyle-related factors is associated with a gain in average life expectancy (Li et al. 2018). What are these factors? Not smoking, having a BMI between 18.5 to 24.9 kg/m2, engaging in more than 30 minutes of moderate to vigorous physical activity (at a minimum, walking ~3 miles per hour; 30 minutes of that = 1.5 miles of walking per day), moderate alcohol intake (5 to 15 g/d for women and 5 to 30 g/d for men), and a high diet quality score.

Starting at age 50y, having all 5 of these factors was associated with a life expectancy of an additional 43.1 years for women, and 37.6 years for men, which is an increase in average life expectancy of 14 years for women and 12 years for men, respectively:

Screen Shot 2019-09-29 at 12.49.55 PM.png

Quantifying whether or not you have the first 4 factors is easy, but what qualifies as having a high dietary score? The alternative healthy eating index (AHEI; McCullough et al. 2002) was used to define the dietary score. An AHEI score of more than 43.5 in women and 50 in men qualifies as having a high dietary quality. How is the AHEI defined?

If you eat more than 5 servings of vegetables (1 serving = ~3 ounces, or 80g) per day, you get 10 points. Similarly, more than 4 servings of fruit gets you 10 points. If you eat 1 serving (= 1.5 ounces, or 42 grams) of nuts and or soy protein (tofu) you get 10 points. If your intake of white meat (including fish, poultry) divided by red meat is greater than 4, you get 10 points. If you eat > 9 grams of cereal fiber (not 9 grams of grains, but the actual fiber content) per day, you get 10 points. For example, 9 grams of cereal fiber corresponds to 90g/day of dry oats. Alcohol is also included within the AHEI: if you have 1.5 – 2.5 servings of alcoholic drinks per day (for men) or 0.5 – 1.5 servings/day for women, that’s 10 points. Zero points would be not consuming alcoholic drinks, or > 3.5 drinks for men, and > 2.5 drinks per day for women. Having a polyunsaturated/saturated fat (P:S) intake > 0.5 yields 8 points, whereas a ratio > 0.7 yields 10 points. Consuming < 0.9 grams of trans fat per day yields 10 points, and finally, using a multivitamin for more than 5 years yields 10 points. To determine your score, have a a look at the median AHEI values reported for men:

Screen Shot 2019-09-29 at 10.11.15 AM

And for women:

Screen Shot 2019-09-29 at 10.13.37 AM.png

How many of the 5 factors do I have? I don’t smoke, my BMI is within the BMI range (my body weight was 158 this morning, so barely!), and I easily walk more than an hour/day + 3-4 days of exercise/week, so I qualify for the first 3 factors. However, I rarely drink alcohol, so I don’t qualify for that factor. What about the diet quality factor? To determine that, I’ll need to calculate if I have more than 50 AHEI points.

For the AHEI index, getting 5, 4, and 1 servings of veggies, fruit, and nuts per day is easy for me, so I’ve got 30 points so far. I eat oats once or twice/week, but not enough to get 9g of cereal fiber/day, so 0 points there. I eat 80 grams of sardines every day (560 grams/week), and ~150 grams of red meat per week, for a ratio of 3.7. That wouldn’t qualify me for 10 points, but 8 instead (see Quintile 4), where the white/red meat ratio would need to be higher than 2.5. I rarely drink alcohol, so 0 points for me there. Using last week’s dietary data, my P:S ratio is about 0.5, and my trans fat intake (almost exclusively from full-fat dairy) is 0.7 g/day, so I get 8 points and 10 points, respectively. In terms of multivitamin use, I only supplement with Vitamin D in the winter, and with a methylfolate-methylcobalamin-B6 stack (to reduce my homocysteine by ~10%). I haven’t been supplementing with that stack for more than five years, so I get a 0 there. Nonetheless, my score is 56 points, which would qualify me as having a high diet quality score.

Collectively, I have 4 of the 5 lifestyle factors that are associated with an increase in life expectancy. Based on the data from Li et al., my average life expectancy would be 85.4y. Adding in moderate alcohol intake would give me all 5 factors, and would result in a life expectancy gain of an additional 2.2 years. I’ve included 1-2 glasses of wine in my diet in the past, but it had no effect on my HDL or other circulating biomarkers, so I removed it. For me, the risk related to alcohol intake may not be worth the gain in life expectancy. Also note that these are average, population-based values, and I expect an additional gain in life expectancy gain because of my continuous quest for biological age optimization (https://michaellustgarten.wordpress.com/2019/09/09/quantifying-biological-age_!

References

Li Y, Pan A, Wang DD, Liu X, Dhana K, Franco OH, Kaptoge S, Di Angelantonio E, Stampfer M, Willett WC, Hu FB. Impact of Healthy Lifestyle Factors on Life Expectancies in the US Population. Circulation. 2018 Jul 24;138(4):345-355. doi: 10.1161/CIRCULATIONAHA.117.032047.

McCullough ML, Feskanich D, Stampfer MJ, Giovannucci EL, Rimm EB, Hu FB, Spiegelman D, Hunter DJ, Colditz GA, Willett WC. Diet quality and major chronic disease risk in men and womenmoving toward improved dietary guidanceAm J Clin Nutr. 2002 Dec;76(6):1261-71.

If you’re interested, please have a look at my book!

Higher Magnesium Intake, Less Arterial Calcification?

Circulating levels of calcium can deposit in the coronary arteries (and in other arterial sites), a process that is known as coronary artery calcification (CAC). Arterial calcification is associated with arterial stiffness, which increases risk for adverse cardiovascular events, including cardiovascular disease-related mortality (Allison et al. 2012).

Can CAC accumulation be slowed/minimized/prevented? One possible factor may involve the dietary intake of magnesium (Mg). As shown below, adults (average age, ~53y) that had a median dietary Mg intake of 425 mg/day had ~50% reduced odds of having any CAC, when compared with lower Mg intakes (Hruby et al. 2014):

cac mg

Getting at least 425 mg of dietary Mg is relatively easy for me. Plotted below is my dietary magnesium intake for the 365 day period from August 31, 2018 until September 2, 2019. All of that comes from food, as I don’t supplement with Mg. In addition, my average daily Mg intake during that period is 786 mg/day (red line):

mg intake

Based on my average Mg intake, my odds for having any CAC should be minimized. However, the best approach would be to actually measure CAC. Stay tuned for that data, sometime later this year!

Which foods contribute to my 786 mg Mg intake/day? ~14% of that comes from spinach, as over that same time period, I averaged 4.82 oz. of spinach/day, which supplies 107 mg of Mg. Other moderate sources of Magnesium (for me) come from carrots and bananas (~59 mg/day each), strawberries (43 mg/day), red bell peppers (37 mg/day), broccoli (26 mg/day), cacao beans (23 mg/day), and others.

If you’re interested, please have a look at my book!

References

Allison MA, Hsi S, Wassel CL, Morgan C, Ix JH, Wright CM, Criqui MH. Calcified atherosclerosis in different vascular beds and the risk of mortality. Arterioscler Thromb Vasc Biol. 2012 Jan;32(1):140-6.

Hruby A, O’Donnell CJ, Jacques PF, Meigs JB, Hoffmann U, McKeown NM. Magnesium intake is inversely associated with coronary artery calcification: the Framingham Heart Study. JACC Cardiovasc Imaging. 2014 Jan;7(1):59-69.

Optimizing Biological Age: Is Calorie Restriction Essential?

My goal is to break the world record for lifespan, 122 years, which is currently held by Jean Calment. How do I plan to do that? A good start would be calorie restriction (CR), a diet where you eat 10-30%+ less calories than your normal intake. CR is the gold standard for increasing lifespan in a variety of organisms, including yeast, flies, worms, and rodents (McDonald et al. 2010).

With the goal of maximizing my health and lifespan, in April 2015, I started a CR diet. Inherent in that was weighing all my food and recording it on an online website that tracks macro-and micro-nutrients. From then until March 2016, I was pretty good at keeping my calories relatively low, as I averaged 2302 calories. However, since 3/2016, it’s been exceedingly difficult to keep my calories that low, as I’ve averaged 2557 calories/day. So is having a higher calorie intake worse for my lifespan goal than a lower calorie intake?

Maybe not. In addition to tracking my daily nutrition since 2015, I’ve also had regular blood testing performed. I’ve measured the typical things that you get at a yearly checkup, including the lipid profile (triglycerides, total cholesterol, LDL, HDL, VLDL) markers of kidney and liver  function (BUN, creatinine, uric acid, and ALT, AST, respectively), and the complete blood count (red and white blood cells, and their differentials). By tracking my daily nutrition and circulating biomarkers, I’m able to quickly intervene on any potential aging and disease-related mechanisms by using my diet to optimize my circulating biomarkers.

On my quest for optimal health and lifespan, biological age is more important than my chronological age (I’m 46y). So what’s my biological age? Between 2016-2019, the group at Insilico Medicine published 2 papers that included circulating biomarker data from more than 200,000 people (Putin et al. 2015, Mamoshina et al. 2018) to derive a biological age predictor (aging.ai). So what’s my biological age?

Shown below is my predicted biological age over 13 blood tests from 3/2016 to 6/2019:

agingai2

Although I wasn’t on a CR diet during that time, my average biological age was 29.2 years, which is ~34% younger than my chronological age. Would my biological age be even younger with a lower calorie intake? I’m working on reducing my calorie intake again (it’s not easy for me), so stay tuned for that!

Here are the my biomarker values corresponding to each blood test, for anyone who wants to double check the results:
agingai2 values

References

Mamoshina P, Kochetov K, Putin E, Cortese F, Aliper A, Lee WS, Ahn SM, Uhn L, Skjodt N, Kovalchuk O, Scheibye-Knudsen M, Zhavoronkov A. Population specific biomarkers of human aging: a big data study using South Korean, Canadian and Eastern European patient populations. J Gerontol A Biol Sci Med Sci. 2018 Jan 11.

McDonald RB, Ramsey JJ. Honoring Clive McCay and 75 years of calorie restriction research. J Nutr. 2010 Jul;140(7):1205-10.

Putin E, Mamoshina P, Aliper A, Korzinkin M, Moskalev A, Kolosov A, Ostrovskiy A, Cantor C, Vijg J, Zhavoronkov A. Deep biomarkers of human aging: Application of deep neural networks to biomarker development. Aging (Albany NY). 2016 May;8(5):1021-33.

If you’re interested, please have a look at my book: