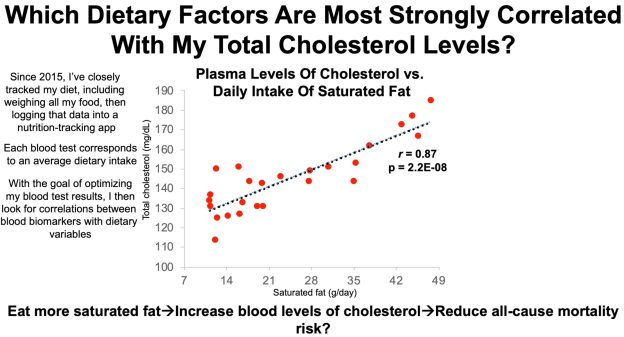
In an earlier video, I presented data for total cholesterol (TC) levels in blood in terms of changes during aging and all-cause mortality risk. I’ve measured TC 25 times in the past 5 years, and in this video, I present that data, and my approach to optimize it.
How much Vitamin C (ascorbic acid) is optimal for health? To answer this question, I’ll examine the association between circulating levels of Vitamin C with all-cause mortality risk. Then, which dietary Vitamin C intake corresponds to optimal plasma levels? Let’s have a look!
A variety of studies have investigated associations between plasma (or serum) Vitamin C with all-cause mortality risk:
In a 4-year study of 1,115 older adults (average age ~79y), plasma vitamin C values greater than 66 uM (micromolar) were associated with significantly decreased all-cause mortality risk, when compared with values less than 17 uM (Fletcher et al. 2003).
In a 12-year study of 725 older adults (average age, 73y), plasma vitamin C values greater than 52 uM were associated with significantly reduced all-cause mortality risk (Sahyoun et al. 1996). Interestingly, the most reduced mortality risk was found in those with plasma Vitamin C values greater than 89 uM, a value that can only be attained with dietary Vitamin C intakes greater than 1000 mg/day (more on this below!).
In a 16-year study of 8,453 middle-aged adults (average age ~49y), serum Vitamin C values greater than 45 uM were associated with significantly reduced all-cause mortality risk, when compared with values less than 17 uM (Simon et al. 2001).
In a 13-year study of 948 older adults (average age, 67y), serum Vitamin C values greater than 55 uM were associated with significantly reduced all-cause mortality risk, when compared with values less than 13.5 uM (Wang et al. 2018).
In a 13-year study of 1,054 older adults (average age ~76y), elevated plasma levels of Vitamin C (risk ratios were reported without the actual Vitamin C concentration) were associated with significantly decreased all-cause mortality risk (Bates et al. 2011).
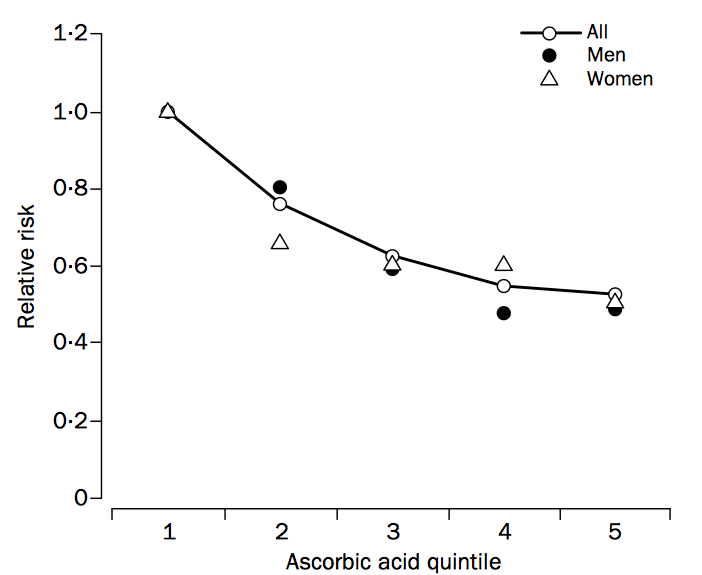
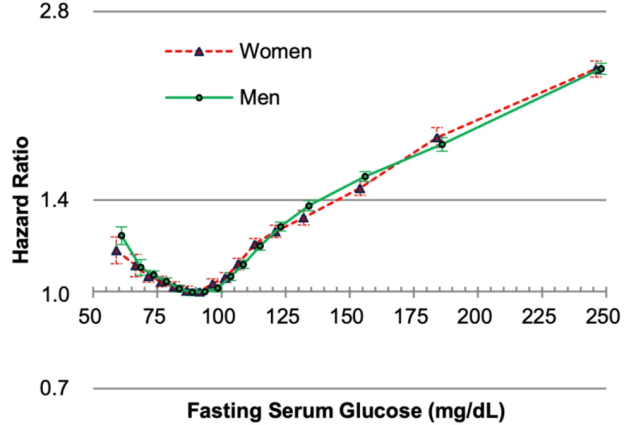
In a 4-year study of 19,496 older adults (average age ~59y), plasma Vitamin C values greater than 48 uM in men and 59 uM in women (both in quintile 3, shown below) were associated with significantly reduced all-cause mortality risk (Khaw et al. 2001). The most reduced all-cause mortality risk included average Vitamin C values of 73 uM for men and 85 uM for women (shown below in quintile 5), values which require greater than 500 mg of dietary Vitamin C/day (more on this also below!).
Studies that show weaker or no association between the plasma Vitamin C concentration with all-cause mortality risk include Loria et al. (2000) and Jia et al. (2007). In Loria et al. (2000), 9,450 middle aged adults (~48y) were followed for 12-16 years. Men in the highest Vitamin C quartile (> 74 uM) had significantly reduced all-cause mortality risk, when compared with men in the low plasma Vitamin C group (< 28 uM). Although a similar association was identified for women, significance was lost after multivariable adjustment. In Jia et al. (2007), although plasma Vitamin C values less than 61 uM were associated with increased all-cause mortality risk in older adults (median age, ~80y) that were studied for ~7.5 years, these data were not statistically significant (p-value = 0.18). However, the study sample size (398 subjects) may have been too small to detect significant effects.
Collectively these studies show that low circulating levels of Vitamin C may be related to an increased mortality risk, whereas plasma values greater than ~50 uM are consistently associated with reduced all-cause mortality risk. How much dietary vitamin C is required to attain 50 uM+?
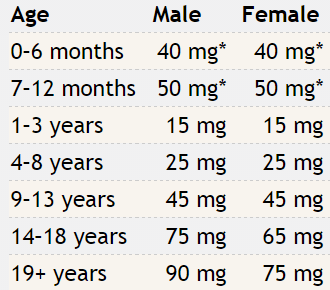
As shown below, the RDA for dietary Vitamin C is 90 mg for males and 75 mg for females older than 19 years (Institute of Medicine 2000).
If you consume the RDA for Vitamin C, what plasma Vitamin C concentration will that yield? Shown below is how the plasma Vitamin C concentration varies according to ingested dose (Levine et al. 1996). Consuming the RDA value for Vitamin C yields a plasma Vitamin C value of 20-30 uM. From the studies listed above, that would put you in the increased all-cause mortality risk group! How much dietary Vitamin C would be needed to achieve plasma values greater than 50 uM? From the plot, we see that a dietary Vitamin C intake at double the RDA would be necessary. Furthermore, because 2 studies have reported decreased all-cause mortality risk at plasma Vitamin C values greater than 66 uM, dietary intakes intake between 500-1000+ mg/day may be necessary:
Which foods are Vitamin C-rich? As shown below, sweet peppers (yellow, red, and green) are the All-Stars for Vitamin C content per 100 calories:
What’s my average daily Vitamin C intake? Shown below is my average daily Vitamin C intake, 971 mg/day (red line) over the past 400+ days:
Note that I don’t supplement with Vitamin C, and that amount is completely from food. Also, I generally split my Vitamin C intake throughout the day, with about 2/3 in the morning and the remaining at night, to try to keep my circulating Vitamin C levels relatively saturated at > 70 uM. I haven’t measured my circulating C levels (yet), but that’s on the to do list!
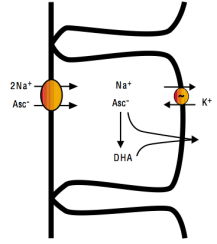
With the goal of optimizing plasma levels of Vitamin C, it is also important to monitor dietary sodium intake. Intestinal absorption of Vitamin C requires dietary sodium (Friedman and Zeidel 1999). As shown below, 1 ascorbate ion (asc-) is absorbed from the intestinal lumen into intestinal epithelial cells in the presence of 2 sodium (Na+) ions. Vitamin C can then diffuse into the blood as Asc- or as dehydroascorbate (DHA):
Accordingly, based on my average dietary Vitamin C intake of 971 mg/day, to maximize absorption, a corresponding dietary sodium intake of 1940 mg would also be necessary.
These data are now in video format!
References
Bates CJ, Hamer M, Mishra GD. Redox-modulatoryvitamins and minerals that prospectivelypredictmortality in olderBritishpeople:the National Diet and NutritionSurvey of peopleaged65years and over. Br J Nutr. 2011 Jan;105(1):123-32.
Fletcher AE, Breeze E, Shetty PS. Antioxidant vitamins and mortality in older persons: findings from the nutrition add-on study to the Medical Research Council Trial of Assessment and Management of Older People in the Community. Am J Clin Nutr. 2003 Nov;78(5):999-1010.
Friedman PA, Zeidel ML. Victory at C. Nat Med. 1999 Jun;5(6):620-1.
Institute of Medicine. Food and Nutrition Board. Dietary Reference Intakes for Vitamin C, Vitamin E, Selenium, and Carotenoids. Washington, DC: National Academy Press, 2000.
Jia X, Aucott LS, McNeill G. Nutritional status and subsequent all-causemortality in men and women aged 75 years or over living in the community. Br J Nutr. 2007 Sep;98(3):593-9.
Khaw KT, Bingham S, Welch A, Luben R, Wareham N, Oakes S, Day N. Relation between plasma ascorbic acid and mortality in men and women in EPIC-Norfolk prospective study: a prospective population study. European Prospective Investigation into Cancer and Nutrition. Lancet. 2001 Mar 3;357(9257):657-63.
Levine M, Conry-Cantilena C, Wang Y, Welch RW, Washko PW, Dhariwal KR, Park JB, Lazarev A, Graumlich JF, King J, Cantilena LR. VitaminCpharmacokinetics in healthyvolunteers: evidence for a recommended dietary allowance. Proc Natl Acad Sci U S A. 1996 Apr 16;93(8):3704-9.
Loria CM, Klag MJ, Caulfield LE, Whelton PK. Vitamin C status and mortality in US adults. Am J Clin Nutr. 2000 Jul;72(1):139-45.
Sahyoun NR, Jacques PF, Russell RM. Carotenoids, vitamins C and E, and mortality in an elderly population. Am J Epidemiol. 1996 Sep 1;144(5):501-11.
Simon JA, Hudes ES, Tice JA. Relation of serum ascorbic acid to mortality among US adults. J Am Coll Nutr. 2001 Jun;20(3):255-63.
Wang SM, Fan JH, Taylor PR, Lam TK, Dawsey SM, Qiao YL, Abnet CC. Association of plasmavitaminCconcentration to total and cause-specificmortality: a 16-year prospectivestudy in China. J Epidemiol Community Health. 2018 Dec;72(12):1076-1082.
In this video, I discuss data for 6 blood test measurements since 2018 that show a Phenotypic (Biological) Age that is ~14 years than my current age (47y).
In this relatively short clip, I talk about how serum levels of creatinine change during aging, what levels are associated with risk of death for all causes, and I show my own data for 15+ years!
Exactly 1 month ago, my first biological age measurement of 2020 was 32.75y (https://michaellustgarten.wordpress.com/2020/02/14/biological-age-32-75y-chronological-age-47y-first-2020-measurement/). When considering that my chronological age is 47y, that’s a 14 year improvement, but I wasn’t (and still aren’t) satisfied. When I sent my blood for analysis, I was battling a mild upper respiratory infection (cough, no fever), which likely raised my WBCs, thereby resulting in a higher biologic age. Also, I was experimenting with a higher intake of meat, eggs, and cheese, to see what affect that it would have on my circulating biomarkers. On that blood test in February, my creatinine levels were higher than my 2015-2020 average value, and if those foods were associated with circulating levels of creatinine, reducing them should also reduce creatinine, and accordingly, further improve my biological age. I also assumed that all other variables on Levine’s Phenotypic Age calculator would be unchanged.
On March 9 2020, I sent my blood for analysis so that I could calculate biological age with Levine’s PhenotypicAge. Almost exactly as expected, my WBCs (4.7 * 10^3 cells/microliter) were closer to my 2015-2020 average value (4.6), rather than the higher value (5.8) in my blood test last month. Similarly, reducing my intake of beef, eggs, and cheese brought creatinine from 1.08 to 0.97 mg/dL, which is closer to its 5-year average (0.94 mg/dL). As a result, I further reduced my biological age by 1.14 years to 31.61y, which is 15+ years younger than my chronological!
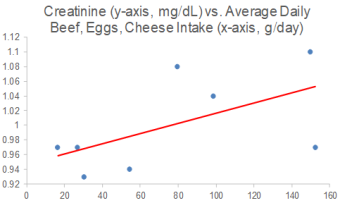
Because I track my diet every day, I can investigate the correlation between my meat, eggs, and cheese intake with creatinine. I now have 8 blood tests that correspond to dietary data, and interestingly, there is a moderately strong correlation between my average daily beef+egg+cheese intake with creatinine (r = 0.55). Based on these data, I’m going to continue to minimize consumption of these foods, with the goal of optimizing creatinine.
On a final note, I also expected to further reduce my CRP from 0.3 to something lower, but it slightly increased to 0.37 mg/L. While that is far from a high value, lower is better, and in future blood tests I’ll try to figure out how to further reduce it.
If you’re interested in calculating your biological age, here’s the Excel link: