Join us on Patreon! https://www.patreon.com/MichaelLustgartenPhD
Discount Links:
At-Home Metabolomics: https://iollo.com?ref=michael-lustgarten
NAD+ Quantification: https://www.jinfiniti.com/intracellular-nad-test/
Use Code: ConquerAging At Checkout
Epigenetic, Telomere Testing: Trudiagnostic.pxf.io/R55XDv
Use Code: CONQUERAGING
Oral Microbiome: https://www.bristlehealth.com/?ref=michaellustgarten
Use Code: ConquerAging
Green Tea: https://www.ochaandco.com/?ref=conqueraging
At-Home Blood Testing: https://getquantify.io/mlustgarten
Diet Tracking: https://shareasale.com/r.cfm?b=1390137&u=3266601&m=61121&urllink=&afftrack=
If you’d like to support the channel, you can do that with the website, Buy Me A Coffee: https://www.buymeacoffee.com/mlhnrca
Conquer Aging Or Die Trying Merch! https://my-store-d4e7df.creator-spring.com/
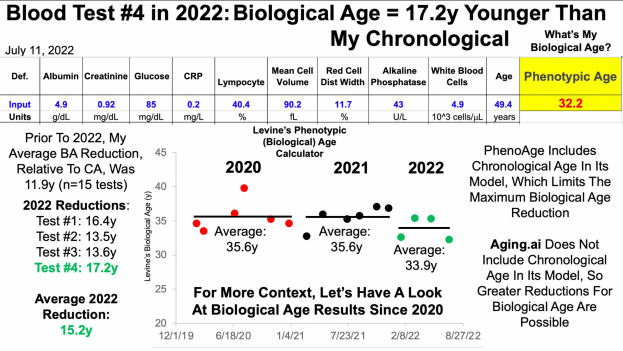
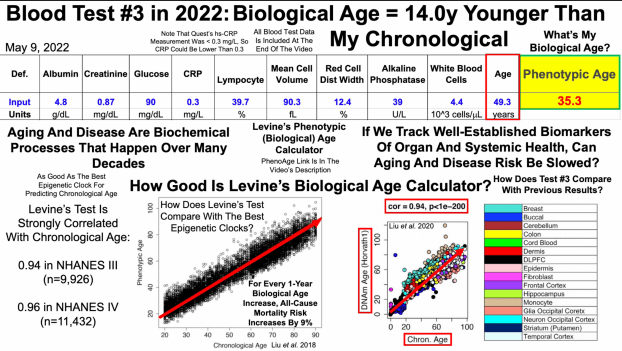
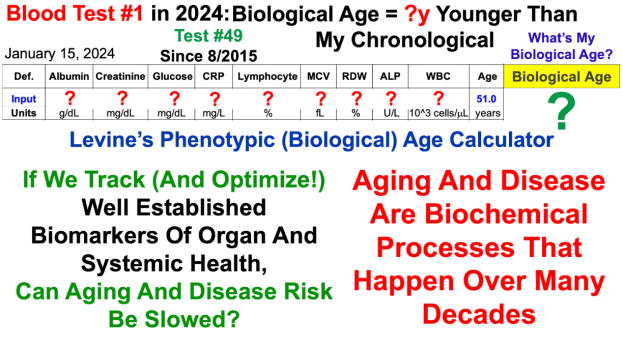
The Excel file to calculate Levine’s Biological Age is embedded in this link from my website: