Join us on Patreon! https://www.patreon.com/MichaelLustgartenPhD
Discount Links:
NAD+ Quantification: https://www.jinfiniti.com/intracellular-nad-test/
Use Code: ConquerAging At Checkout
Telomere and Epigenetic Testing: Trudiagnostic.pxf.io/R55XDv
Use Code: CONQUERAGING
NAD+ Quantification: https://www.jinfiniti.com/intracellular-nad-test/
Use Code: ConquerAging At Checkout
At-Home Metabolomics: https://iollo.com?ref=michael-lustgarten Use Code: CONQUERAGING At Checkout
Oral Microbiome (Enter Code: ConquerAging): https://www.bristlehealth.com/?ref=michaellustgarten
At-Home Blood Testing: https://getquantify.io/mlustgarten
Green Tea: https://www.ochaandco.com/?ref=conqueraging
Diet Tracking: https://shareasale.com/r.cfm?b=1390137&u=3266601&m=61121&urllink=&afftrack=
If you’d like to support the channel, you can do that with the website, Buy Me A Coffee: https://www.buymeacoffee.com/mlhnrca
Conquer Aging Or Die Trying Merch! https://my-store-d4e7df.creator-spring.com/
Papers referenced in the video:
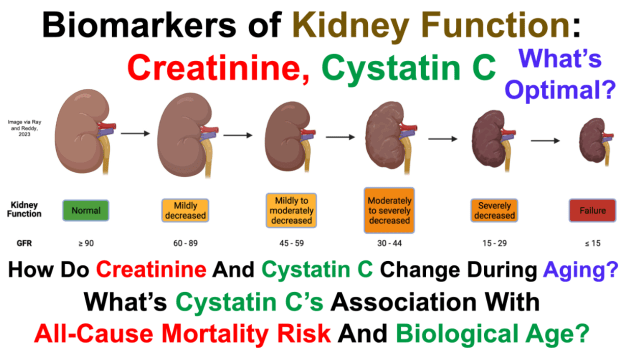
Structural and physiological changes of the kidney with age and its impact on chronic conditions and COVID-19 https://pubmed.ncbi.nlm.nih.gov/37031725/
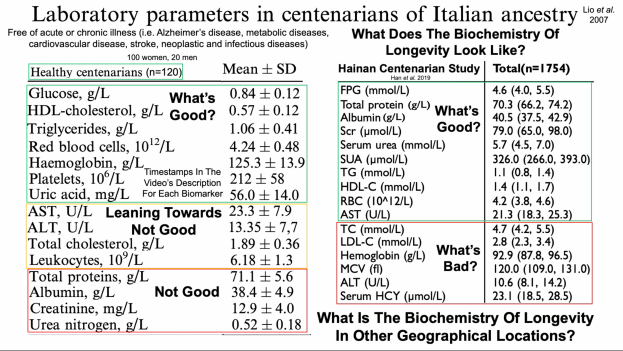
Age-related changes in clinical parameters and their associations with common complex diseases https://pubmed.ncbi.nlm.nih.gov/26623014/
Predicting Age by Mining Electronic Medical Records with Deep Learning Characterizes Differences between Chronological and Physiological Age
https://www.ncbi.nlm.nih.gov/pmc/articles/PMC5716867/
Variation in serum creatinine level is correlated to risk of type 2 diabetes
https://pubmed.ncbi.nlm.nih.gov/24396680/
Age and cystatin C in healthy adults: a collaborative study https://pubmed.ncbi.nlm.nih.gov/19749145/
Cystatin C and long-term mortality among subjects with normal creatinine-based estimated glomerular filtration rates: NHANES III (Third National Health and Nutrition Examination Survey) https://pubmed.ncbi.nlm.nih.gov/21109116/
Biological age estimation using circulating blood biomarkers https://www.nature.com/articles/s42003-023-05456-z