Mean corpuscular volume (MCV) is one of the 10 variables included in the biological age calculator, PhenoAge (see https://michaellustgarten.wordpress.com/2019/09/09/quantifying-biological-age/
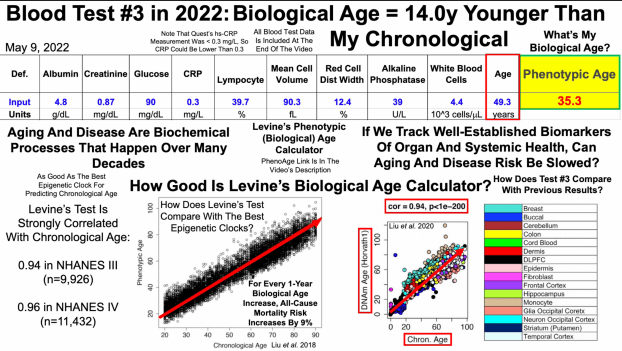
). It’s calculated by dividing the fraction of the blood that contains RBCs (hematocrit) by RBCs (MCV = hematocrit/RBC), thereby identifying the average volume contained within red blood cells. Although the MCV reference range is 80 – 100 femtoliters (10^-15L), what’s optimal in terms of a youthful biological age, and minimized disease risk?
MCV increases during aging. In support of this, using a small subset of samples from the Baltimore Longitudinal Study on Aging (values not in parentheses), MCV increased from average values of 88.8 in young (18-39y), to 91.3 in middle-aged (40-59y), to 92.4 in old (>60y) subjects. Similarly, MCV also increased in the full sample size from the Baltimore Longitudinal Study on Aging (values in parentheses) from 89.2 to 91.1 to 92.9 in young, middle-aged and old, respectively (Araki and Rifkind, 1984):

In a larger study that included 3,358 subjects, MCV increased from median values of 92.2 in women and 93.4 in men younger than 60y to 94.2 and 95.7 in women and men older than 60y, respectively (Lee et al. 2018):

When considering that MCV increases during aging, one would predict that higher levels would be associated with an increased risk of death of all causes. In support of this, in the 36,260 subjects of Yoon et al. (2016), MCV levels > 94.2 in women and > 95.8 in men (Tertile 4) were associated with a 55% and 44% increased risk of death from all causes, respectively, when compared with MCV values between 89.2 – 91.6 in women and 90.5 – 93 in men (Tertile 2):

Collectively, these data suggest that a lower MCV may be better in terms of biologic youth, and for a lower risk of death from all causes. What are my MCV values? I’ve measured MCV 25 times over the past 16 years. In my 30’s, I measured it 7 times, with an average MCV = 90. In my 40’s, I’ve measured it 18 times, for an average value = 91.1. Although these 2 groups of data are not significantly different (p=0.09), the red trendline for these data is slightly up (R2=0.02), which suggests that my MCV is slowly increasing with age:

Although my MCV values are seemingly far from the increased mortality risk of Yoon et al. (> 95.8), it increases during aging, so I’ve definitely got my eye on it. Should it start to increase, I’ll intervene with dietary changes. Stay tuned!
If you’re interested, please have a look at my book!
References
Araki K, Rifkind JM. Age dependent changes in osmotic hemolysis of human erythrocytes. J Gerontol. 1980 Jul;35(4):499-505.
Lee Eun-jin, Kim Mi-young, Lee Eun-yeop, Jeon Beom, Lee Ji-won, Kim Han-sung, Kang Hee-jeong, Lee Young-kyung, Eun Jin Lee, Miyoung Kim, Eunyup Lee, Kibum Jeon, Jiwon Lee, Han-Sung Kim, Hee Jung Kang, Young Kyung Lee.vEstablishment of reference section for general blood test in healthy elderly. Establishing Reference Intervals for Complete Blood Cell Count in Healthy Korean Elderly Individuals. J Lab Med Qual Assur 2018; 40: 27-37. doi.org/10.15263/jlmqa.2018.40.1.27.
Yoon HJ, Kim K, Nam YS, Yun JM, Park M. Mean corpuscular volume levels and all-cause and liver cancer mortality. Clin Chem Lab Med. 2016 Jul 1;54(7):1247-57. doi: 10.1515/cclm-2015-0786.